
Abstract
In order to understand the influences of natural draft cooling tower (NDCT) with flue gas injection on pollutant concentrations of the theoretical plume downwash area, an automatic air quality monitoring station was set in the theoretical plume downwash area of NDCT in Qinling power plant to get hourly SO2 and NO2 concentrations over a year. The results show that: 100% 1h average concentrations of SO2 and 99.64% NO2 observations satisfied the requirements of Chinese ambient air quality standard. High pollutant concentrations caused by plume downwash of NDCT with flue gas injection are not observed during the monitoring period, and there are no significant differences (P > 0.05) between pollutant concentrations in the theoretical plume downwash area under the prevailing westerly wind conditions (37.2 ± 24.8 μg/m3) and easterly wind conditions (36.9 ± 22.3 μg/m3), while the concentrations under conditions of west wind speed > 5m/s are significantly lower (P < 0.01) than those under conditions of west wind speed < 1.2m/s. The observations of this study indicate that ground pollutants at high concentration owing to plume downwash would not occur in the theoretical plume downwash area of NDCT with flue gas injection.
1. Introduction
Natural draft cooling tower (NDCT) with flue gas injection refers to the technology discharging the desulfurized flue gas of power plants via natural draft cooling tower instead of stack. The principle of this technology is to increase the upraise height of plume by the wrapping and uplifting effect of large amount of hot air in the NDCT, and then the diffusion range of flue gas is enlarged and the ground concentration of pollutants is reduced [Citation1–Citation4]. Given the advantages such as simplifying flue gas system, saving project land and investment and improving energy efficiency, the technology has been widely applied in power plants with different installed capacity in Germany since 1980s. Meanwhile, a series of environmental impact assessment guidelines have been formed in Germany [Citation5–Citation9]. Since the early 2000s the technology has been popularized and applied in more than 20 power plants in China. However, due to the absence of specific environmental impact assessment standards and unified understanding of the environmental impact of NDCT with flue gas injection, it has not received large-scale promotion and application in China [Citation10,11].
The atmospheric environmental impact of NDCT with flue gas injection has been analysed by previous studies with the promotion of this technology in China. In the respect of environmental impact assessment model, the influencing factors on rising height of flue gas and the localization of the model parameters based on German evaluation model have been identified in a large body of literatures, which have important guiding significance to understand the characteristics of this technology and to facilitate the practical application of the evaluation model [Citation12–Citation18]. The environmental impact of flue gas exhausted by cooling tower and by high chimney were compared in some studies, most of which indicated better performance of flue gas exhausted by cooling tower [Citation13–15,19,20], while contrast conclusion was drawn in the study of a power plant in Tianjin by Zhou et al. [Citation13]. In the respect of pollutant concentrations of theoretical plume downwash area, strong wind weather conditions would cause high pollutant concentrations in the cavity zone of NDCT according to the downwash theory. The characteristics of plume downwash and the range of downwash cavity zone were analyzed through the methods of theoretical analysis, ambient wind tunnel test and numerical model [Citation21–Citation24]. Ma et al. compared the flue gas parameters of NDCT with flue gas injection under fully mixed method and involvement method, indicating overestimated probabilities of flue gas downwash in evaluation model based on fully mixed method [Citation21]. Zhang et al. carried out a numerical wind tunnel model to analyse the characteristics of downwash cavity zone of a power plant using the technology of NDCT with flue gas injection. The results show that the maximum pollutant ground concentration would rise with the increase of the wind speed, and there is a cavity area where the high-concentration pollutant gathered at downwind of the cooling tower [Citation23]. In the respect of observations on NDCT with flue gas injection, related field measurements are limited in China. Chen et al. measured the distribution of emission parameters inside and outlet of a cooling tower under typical working conditions of a thermal power plant, indicating non uniform mixing state for the flue gas exhausted by NDCT [Citation25]. SF6 tracer gas test was carried out in Guohua Sanhe power plant by Zhao et al. However, the results reach the opposite conclusion of studies using numerical wind tunnel model [Citation26].
Thus, there is a need to make some progresses in the present study. Firstly, there are no uniform conclusions between different methods on the ground concentrations of downwash cavity caused by NDCT with flue gas injection. Secondly, related observation studies, especially long time continuous filed measurements, are insufficient to support the results of the model and theoretical analysis. In this work, based on hourly observations in the theoretical plume downwash area of NDCT in Qinling power plant over a year, data mining methods such as statistical analysis and hypothesis test are used to evaluate the actual environmental impact of NDCT with flue gas injection. As such, the results of this study are helpful to provide observation support for related studies on environmental impact of such projects and for promotion of the technology.
2. Methodology
2.1. Background of Qinling power plant and research area
Huaneng Qinling power plant is located at the foot of Qinling Mountain in Shaanxi province, with the county of Huaxian in the West and the city of Huayin in the East. The site of the plant is flat in the East-West direction, while the South is blocked by the Qinling Mountain. Owing to the particular topography, the prevailing wind direction at the plant site is west wind. The Qinling power plant has four phase projects in total, of which, 2 × 125 MW units of phase-1 project (#1 and #2) were shut down in 2008, unit #3 and #4 of phase-2 project (2 × 200 MW) were shut down in 2010 and 2013, respectively, 2 × 200 MW units of phase-3 project (#5 and #6) were shut down in July of 2014, and unit #7 and #8 of phase-4 project (2 × 600 MW) were put into operation in 2011 and 2014, respectively. The technology of NDCT with flue gas injection was applied in the unit #7 and #8, in which, the field measurements in this work are based on the cooling tower of unit #7.
2.2. Sampling and analysing
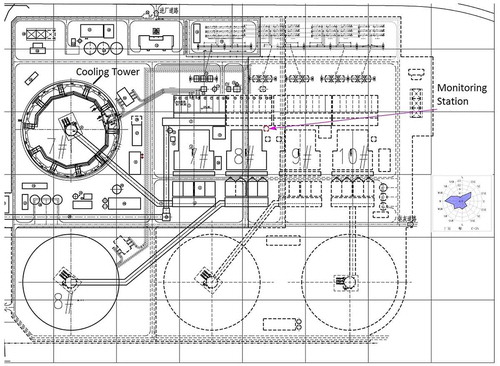
According to the cavity size of results in environmental wind tunnel test, in the theoretical downwash area an automatic air quality monitoring station was set on the east side of the unit #7 cooling tower at a distance of 300 meters. shows the general layout plan of the plant and the location of monitoring station. Hourly ground level SO2 and NO2 concentrations were sampled and analyzed from August 1, 2014 to August 13, 2015. The equipment with automatic calibration function realized zero-scale calibration for SO2 and NO2 analyzer every day during the observation period. On-site inspection was conducted once a week to calibrate the analyzer. Airtightness of the sampling pipeline was checked quarterly. Further, sampling flow of the analyzer and flow of the calibrating instrument were calibrated once every six months. Finally, 8628 effective observation data of hourly SO2 concentrations and 8641 effective observation data of hourly NO2 concentrations were obtained. The monitoring method and data validity meet the requirements of < Ambient air quality standards>(GB3095-2012).
Figure 1. General layout of the plant and the location of #7 cooling tower and monitoring station.
Based on long time continuous observation, environmental impact of NDCT with flue gas injection on the theoretical plume downwash area was evaluated by statistical analysis and hypothesis test. Firstly, SO2 and NO2 observation data were compared to select the appropriate evaluation factor. In order to reduce the effects of pollution sources in heating period on the observation results, the data of non-heating period was selected and divided into six groups by two operation conditions (normal operation and out of service) and three weather conditions (static wind, and easterly wind and westerly wind). Then, independent t-test was used to analyse the variation characteristics and select the evaluation factor. Secondly, under the assumptions of the conclusions of theoretical analysis, observation data should present corresponding results if the conclusions of theoretical analysis are right. Thus, hypothesis test was used to check that whether the observations support theoretical understandings or not. Hourly wind direction and wind speed data were obtained from both Huaxian weather station (18 km on the west of plant) and Huayin weather station (14 km on the east of plant).
3. Results of automatic air quality monitoring station
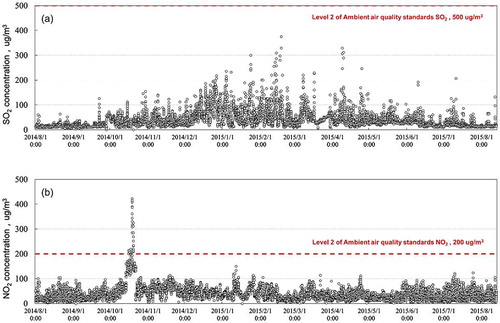
illustrates the distributions of hourly ground level SO2 and NO2 concentrations during the monitoring period. The average 1 h SO2 concentration is 39.2 ± 33.9 μg/m3, and the maximum 1 h SO2 concentration is 375 μg/m3, which was observed in the heating period of 2015 (18 February 2015). All hourly SO2 concentrations during the monitoring period are less than 500 μg/m3, which means all of the SO2 observations met level 2 requirements of < Ambient air quality standards>(GB3095-2012). The average hourly SO2 concentration of heating period (66.7 ± 44.6 μg/m3), as presented in , is significantly higher than that of non-heating period (30.6 ± 23.9 μg/m3, p < 0.01), indicating that the monitoring station was affected by SO2 emissions of winter heating. As for NO2, the average 1 h NO2 concentration is 38.9 ± 30.0 μg/m3, and the maximum concentration is 422 μg/m3, accounting for 211% of the ambient air quality standard. However, 99.64% NO2 observations are less than the air quality standard during the monitoring period. The maximum observed concentration might be caused by denitration system failures or other influences of accidental factors. Of note, the pattern of NO2 indicates that there are no differences between the concentrations of heating period and those non-heating period, which was not consistent with the pattern of SO2.
Figure 2. Hourly ground level SO2 and NO2 concentrations during the monitoring period.
4. Effects on ground concentration of the theoretical downwash area
4.1. Evaluation factor selection
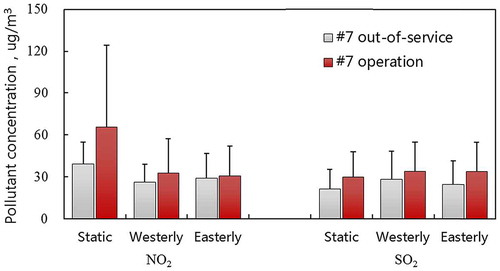
shows the comparisons of NO2 and SO2 concentrations under six conditions. Under unit #7 out-of-service condition, when the wind is static the average NO2 and SO2 concentrations are 39.3 ± 15.5 μg/m3 and 21.6 ± 14.0 μg/m3, respectively. Both are significantly less than those of normal operation condition (NO2: 65.6 ± 58.8 μg/m3, SO2: 30.2 ± 17.6 μg/m3, p < 0.01), which indicates that NDCT with flue gas injection of unit #7 had contributions on the monitoring station. Under unit #7 normal operation condition, the average NO2 concentrations are 32.9 ± 24.5 μg/m3 and 31.0 ± 21.1 μg/m3 when the winds are westerly and easterly, respectively, and both are less than the concentration of 65.6 ± 58.8 μg/m3 under static wind condition (p < 0.01). However, the pattern of SO2 does not coincide with that of NO2, namely, SO2 concentrations under westerly and easterly wind conditions are not less than that of static wind condition. It should be noted that the NO2 source of unit #7 is greater than that of SO2, but there are no significant differences between NO2 and SO2 concentration under wind conditions, which indicate that other external SO2 sources have greater effect on the monitoring station than those of external NO2 sources. Thus, NO2 is better than SO2 as the evaluation factor.
Figure 3. Comparisons of NO2 and SO2 concentrations in non-heating period.
4.2. Comparison of observation data under east wind and west wind conditions
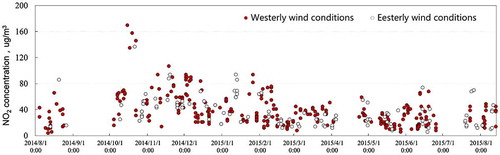
According to the results of theoretical analysis and environmental wind tunnel test, there would be a downwash cavity zone where the high concentration pollutant gathered at downwind of the cooling tower under wind conditions, which would further affect the ground concentration in the downwash area. In this work, monitoring station was located in the east side of the theoretical downwash area. Given the downwash effect of flue gas under westerly wind condition, the concentration under this condition should be higher than that under easterly wind conditions. presents the distributions of NO2 concentration under easterly wind and westerly wind conditions with operation of unit #7. The average NO2 concentrations are 37.2 ± 24.8 μg/m3 and 36.9 ± 22.3 μg/m3 under westerly and easterly wind conditions, respectively, indicating no significant differences in the independent t-test (p = 0.905). Of note, there are no significant differences between easterly wind and westerly wind conditions when unit #7 is out-of-service (p = 0.461). Hence, the continuous observation data could not support the theoretical understanding of elevated ground concentration in the downwash area of cooling tower.
Figure 4. Distributions of NO2 concentration under easterly and westerly wind conditions with operation of unit #7.
4.3. Comparison of observation data under strong wind and weak wind conditions
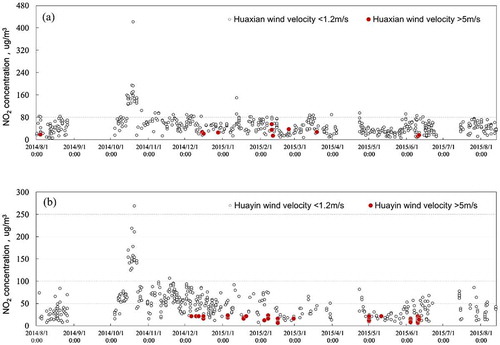
According to the results of theoretical analysis and numerical wind tunnel test, flue gas downwash would be notable when wind speed is greater than 3–4 m/s, and the maximum pollutant ground concentration would rise with the increase of the wind speed. Accordingly, concentration under strong westerly wind condition should be greater than that under weak westerly wind condition. shows the distributions of NO2 concentration under strong and weak westerly wind conditions with velocity > 5 m/s and < 1.2 m/s. The average NO2 concentration is 26.1 ± 12.5 μg/m3 under strong westerly wind condition of Huaxian, which is significantly lower than 50.5 ± 32.9 μg/m3 under weak westerly wind condition (p < 0.05). Similarly, the average NO2 concentration under strong westerly wind condition of Huayin is significantly lower than that under weak westerly wind condition (15.1 ± 4.9 μg/m3 and 51.2 ± 32.4 μg/m3, p < 0.01). However, the results of studies using numerical wind tunnel test presented higher ground concentration with greater wind speed, especially for wind speed at 6 m/s as the most unfavourable weather condition. The maximum NO2 ground concentrations could reach 130–272 μg/m3 in the downwash area of cooling tower [Citation12,19,23,24]. The NO2 ground concentrations at monitoring station were only 6–23 μg/m3 (14.6 ± 5.2 μg/m3) when the westerly wind speed reached 5.6–6.5 m/s in our study. Although the emissions are different between this study and existing research, there are order-of-magnitude differences which indicating that the observation data could not support the theoretical understanding of elevated ground concentration under strong wind condition.
Figure 5. Distributions of NO2 concentration under westerly wind conditions with velocity > 5 m/s and < 1.2 m/s.
The observation results in our work are consistent with the findings from SF6 tracer test by Zhao et al., namely, ground concentration would decrease with the increase of the wind speed [Citation26]. It should be noted that the sampling sites in the SF6 tracer test are 1500 meters from the cooling tower, and the distance is far beyond the theoretical downwash area. High ground concentrations were not observed by the monitoring station might be caused by the following reasons. Firstly, the place high-concentration pollutant gathering at downwind of the cooling tower located at high altitude, not connecting with ground [Citation11,24]. Secondly, the velocity, temperature and pressure of mixed flue gas from cooling tower are non-uniform according to the study of Zhao, and the actual downwash probabilities of non-uniform flue gas are lower than those of well mixed flue gas assumed in numerical wind tunnel test [Citation21,25]. Although strong wind conditions are unfavourable to the plume rise of NDCT with flue gas injection, they are beneficial to the pollutants diffusion. Overall, there is no significant rise of ground concentration caused by flue gas downwash.
5. Conclusions
The main conclusions of this article are as follows.
Based on continuous filed measurements on NDCT with flue gas injection over one year, 1 h average concentrations of SO2 and NO2 were 39.3 ± 33.9 μg/m3 and 39.0 ± 30.0 μg/m3, respectively. 100% SO2 observations and 99.64% NO2 observations satisfied the requirements of < Ambient air quality standards>(GB3095-2012).
Attention needs to be paid to the selection of evaluation factor in environmental impact post assessments of NDCT with flue gas injection. In this work, NO2 is selected as evaluation factor since external SO2 sources have greater effect on the monitoring station than those of NO2 sources.
Observation data in this work could not support the theoretical understanding of environmental and numerical wind tunnel test, including no significant differences between concentrations under easterly wind and westerly wind conditions, and significantly lower concentrations under strong wind conditions than those of weak wind conditions.
Therefore, more studies of filed measurements and theoretical analysis are needed to evaluate the environmental impact of NDCT with flue gas injection.
Disclosure statement
No potential conflict of interest was reported by the authors.
Funding
This work was supported by the Northwest Electric Power Design Institute Research Project [grant number XB1-JX11-2013].
Notes on contributors
Su Shenshen is a staff member of the Water & Environmental Division of the Electric Power Planning & Engineering Institute (EPPEI). He is a senior engineer and has a certificate as a consulting engineer. He received his Ph.D. in environmental science in 2014 from Peking University, Beijing, China. He is currently working on design, consultation of environmental protection and pollution control of thermal power plant. Email: [email protected]
Zhang Renfeng is a staff member of the Environmental Division of the Northwest Electric Power Design Institute Co., Ltd. of China Power Engineering Consulting Group (NWEPDI). He is a senior engineer and has a certificate as an environmental impact assessment engineer. He is currently working on design of environmental protection and pollution control of thermal power plant. Email: [email protected]
Ma JiJun is a staff member of the Environmental Division of the Northwest Electric Power Design Institute Co., Ltd. of China Power Engineering Consulting Group (NWEPDI). He is a professorate senior engineer and has a certificate as an environmental impact assessment engineer. He is currently working on design of environmental protection and pollution control of thermal power plant. Email: [email protected]
Xie Yongping is the head of the Environmental Division of the Northwest Electric Power Design Institute Co., Ltd. of China Power Engineering Consulting Group (NWEPDI). He is a professorate senior engineer and has a certificate as an environmental impact assessment engineer. He is currently working on design of environmental protection and pollution control of thermal power plant. Email: [email protected]
Sun Xijin is a staff member of the Environmental Division of the Northwest Electric Power Design Institute Co., Ltd. of China Power Engineering Consulting Group (NWEPDI). He is currently working on design of environmental protection and pollution control of thermal power plant. Email: [email protected]
Han Jianhua is the vice-director of the production management department of Huaneng Shaanxi Qinling Mountains Power Generation Co., Ltd. He has a certificate as a senior economist. He is currently working on environmental protection and pollution control management of thermal power plant.
References
- Tang YL. Application of technology for ‘combining stack and cooling tower into one’ in coal-fired power plants [J]. Electr Power Constr. 2005;26(2):11–12.
- Lin Y. The technology characteristics of natural draft cooling tower with flue gas injection and its engineering data [J]. Res Environ Sci. 2005;18(1):35–39.
- Yao ZQ. Transmission and diffusion of plume in thermal power plant [M]. Beijing: China Electric Power Press; 2003.
- Nielinger J, Kost WJ, Braun F, et a1. Atmospheric dispersion modeling within water vapour plumes of cooling towers [C]. Proceedings of the 1 lth International Conference on Harmonisation within Atmospheric Dispersion Modelling for Regulatory Purposes. Cambridge, 2007. p. 229–233.
- Schatzmann M, Policastro AJ. An advanced integral model for cooling tower plume dispersion [J]. Atmos Environ. 1984;18:663–674.10.1016/0004-6981(84)90253-1
- Schatymann M. Entwicklung und anwendung eines kuhlturm schwadenmodells [M]. Berlin: E SchVerlag; 1984.
- Verein Deutscher Ingenieure. VDI 3782 Part 3 Dispersion of air pollutants in the atmosphere determination of plume rise [S]. Berlin: Beuth Verlag GmbH; 1985.
- Verein Deutscher Ingenieure. VDI 3784 Part 2, Environmental meteorology: dispersion modelling for the discharge of flue gas via cooling towers [S]. Berlin: Beuth Verlag GmbH; 1990.
- Verein Deutscher Ingenieure. VDI 3945 Part 3, Environmental meteorology atmospheric dispersion models particle model [S]. Berlin: Beuth Verlag GmbH; 2000.
- Mo H, Liu SM. Existing question and recommendation for the technological evaluation of natural draft cooling towers (NDCT) with flue gas injection [J]. Electr Power Environ Prot. 2009;25(3):48–50.
- Mo H. Discussion on atmospheric environment protection zone in environmental impact assessment about technology of natural draft cooling towers with flue gas injection [J]. Environ Prot Sci. 2010;36(6):39–41.
- Cui KQ, Li H. The environmental effect of natural draft cooling towers with flue gas injection in a burning coal plant, Part I: the parallel calculation of plume rise [J]. Res Environ Sci. 2005;18(1):27–31.
- Zhou Y, Wang HY, Li ZQ, et al. Applicability of Austal 2000 in Atmospheric Impact Assessment for ‘Cooling Tower with Flue Gas Injection’ Project in China [J]. Adm Tech Environ Monit. 2012;24(1):56–61.
- Ma ZQ, Wang L, Zhu JH, et al. Analysis of the atmospheric environmental impact of a stack-cooling tower project for a 2 × 300 MW generating unit [J]. Res Environ Sci. 2012;25(12):1416–1421.
- liu YC, Yang HB, Wang HY, et al. Uplifted height of flue gas from cooling tower and its pollutant concentration [J]. J Meteorol Environ. 2010;26(1):40–44.
- Zhao H. Sensitivity analysis of landing concentration using AUSTAL2000 [J]. China Electr Power (Technol). 2014;10:127–129.
- Liang D. Environmental impact analysis of natural draft cooling tower with flue gas injection in coal-fired power plant [D]. Beijing: North China Electric Power University; 2008.
- Yang JX. The analysis about the plume rise of the gas discharged from cooling tower [J]. Electr Power Technol Environ Prot. 2010;26(1):23–24.
- Cui KQ, Cai FH. The environmental effect of natural draft cooling towers with flue gas injection in a burning coal plant. Part II: the evaluation of environment effect for the case at Huaneng Beijing thermoelectric plant [J]. Res Environ Sci. 2005;18(1):31–34.
- Zhang RF, Wei Y, Yang L. Environmental impact comparison of stack-in-tower configuration and a stand-alone chimney in coal-fired power plant – taking Baoji No.2 power plant for example [J]. Electr Power Environ Prot. 2012;28(2):1–3.
- Ma J, Tain WX, Jiang YS. Parameters and the rise height of flue gas at the exit of the cooling tower [J]. Environ Sci Technol. 2014;37(120):475–478.
- Chen KH, Song C, Li Q. Numerical analysis of plume rise of cooling tower with flue gas injection [J]. Power Syst Eng. 2008;24(2):12–14.
- Zhang LN, Ma Z, Zhou Y, et al. Study on the diffusing of flue gas pollutant from natural draft cooling tower with flue gas injection using numerical wind tunnel mode [J]. Environ Pollut Control. 2013;35(4):67–74.
- Zhang LN, Zhao L, Chen L, et al. Comparative study on flue gas discharge by natural draft cooling tower with flue gas injection between numerical wind tunnel mode and physical wind tunnel [J]. Environ Sci Technol. 2013;36(5):141–146.
- Chen YZ, Zhao D, Chai FH, et al. Emission parameters experimentation and characteristics of cooling towers with flue gas injection [J]. Res Environ Sci. 2010;23(5):543–547.
- Zhao D, Chen YZ, Chai FH, et al. Atmospheric diffusion experiments with tracer gas SF6 on cooling towers with flue gas injection emission [J]. Res Environ Sci. 2010;23(5):548–554.