
 ?Mathematical formulae have been encoded as MathML and are displayed in this HTML version using MathJax in order to improve their display. Uncheck the box to turn MathJax off. This feature requires Javascript. Click on a formula to zoom.
ABSTRACT
In recent years, plant factories have been drawing attention for their capability to solve global food crisis. However, the energy cost of plant factories is high due to the power consumption of air conditioning and cultivation systems necessary for realizing semi-automatic production. As this high cost hinders their propagation,, plant factories must minimize the energy cost of growing plants. We propose an operation planning method of cultivation systems for minimizing energy cost minimization while producing plants with the same amount and quality. The effect of electricity charge and weather factors on electric power consumption under various real-world constraints are used to decide the appropriate operation plan of cultivation systems. Simulation results show that the operation plan of cultivation systems properly reflects the effect of electricity charge and weather factors on electric power consumption to reduce energy cost.
1. Introduction
Global food crisis has been forecasted due to the decline in agricultural workers, population increase, and abnormal weather. Indoor plant factories can be built anywhere, and they mass produce plants in limited land. The products can also be cultivated by a small number of people working in a stable environment without being influenced by the weather. Given these characteristics, plant factories have been drawing attention for their capability to solve agricultural and food problems. However, 55.9% of companies operating plant factories in Japan are in deficit [Citation1].
Huge running cost is an important issue in plant factory management. In a plant factory, controlling air conditioning and lighting is necessary to keep the internal environment stable, resulting in high energy costs. To reduce energy cost, studies propose energy-saving devices, such as LEDs [Citation2], for environmental control. The drawback is that the power consumption of such apparatus may dynamically change due to weather factors. Especially in situations wherein maintaining internal environment is necessary in a plant factory, more electricity may be consumed than expected if weather factors are not considered, increasing the energy cost. Studies on the operation planning of such apparatus in general-purpose factories and buildings have been conducted [Citation3], but operation planning of environmental control systems considering the influence of weather factors has not been discussed well. In addition, various management constraints in retaining the freshness of plants and the working hours of employees when harvesting should be considered when devising an appropriate operation plan.
In this study, we develop an operation planning method of cultivation systems for reducing energy cost while considering the impact of weather factors. The proposed method considers the effect of weather factors on power consumption and the real-world implementation of the formulated operation plan.
2. Plant factory
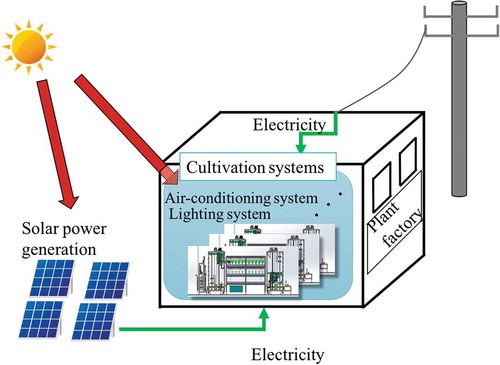
We focus on a plant factory with semi-automated cultivation and solar power generation systems. shows a schematic image of the plant factory. We assume that each cultivation system can be independently operated according to an individual operation plan and that all electricity generated by the solar power generation system is immediately consumed by the cultivation systems.
Figure 1. Schematic image of a plant factory.
2.1. Cultivation systems
In a cultivation system, plants grown for a certain number of days are harvested manually at a certain time every day, and new seedlings are supplied after every harvest. A cultivation system operates the daily light–dark period for growing plants according to a control schedule and controls thermal environments to maintain regular cultivation. shows a typical example of the daily power consumption of a cultivation system. The high power consumption time implies the light period; the low power consumption time, the dark period. Harvesting work is carried out immediately after switching from dark to light period. For example, in , harvesting work will be conducted at 14:30.
Figure 2. Power consumption of a cultivation system.
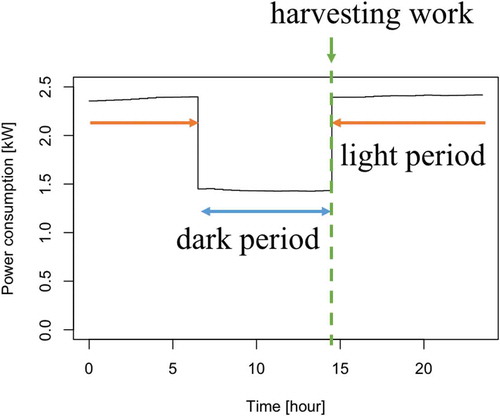
As shown in , the power consumption of a cultivation system changes according to the given schedule. Power consumption is also affected by weather factors, such as outside temperature and humidity. The start time of the light period is defined as the start time of the operation cycle of the cultivation system in this paper. The total energy cost of a plant factory is greatly influenced by the operation cycle schedule of cultivation systems. In this study, we focus on minimizing energy cost by scheduling the operation cycle of cultivation systems individually.
2.2. Constraints in operating cultivation systems
Plants brought out from cultivation systems should be harvested as soon as possible to maintain their freshness. Time allotted for harvesting work and the daily working hours of harvesters must be considered in the operation planning of cultivation systems because the number of harvesters is limited. In this study, we consider the two following constraints:
the maximum number of cultivation systems activating per unit time
the start time of the operation cycle of cultivation systems
As harvesting work is performed manually, the amount of plants that can be harvested simultaneously is limited to the number of harvesting workers. In our proposed operation planning method described in the next section, we introduce two real-world constraints. The first constraint restricts the number of cultivation systems that run in the same operation cycle. The second constraint restricts the harvesting work time of workers.
3. Operation planning of cultivation systems for energy cost reduction
Considering the influence of external environmental factors that vary due to seasonal changes, we derive appropriate operation plans of cultivation systems for reducing energy cost. In our planning method, we take the two following steps:
Investigate the causal relationship between environmental factors, including weather factors and controllable factors, such as power consumption of the cultivation systems, and express power consumption as a function of environmental factors.
Plan the operation schedule of cultivation systems by solving the energy cost minimization problem under the intended environmental situation.
3.1. Relationship between environmental and controllable factors
At the first step of our framework, we investigate the relationship between environmental factors and controllable factors by using data monitored in an actual plant factory on the basis of additive Bayesian networks [Citation4]. An additive Bayesian network is a kind of probabilistic graphical model [Citation5]. In this model, statistical causal relationships between variables are described by combinations of generalized linear models [Citation6]. Statistical structure is determined from the viewpoint of the maximum log marginal likelihood framework [Citation7,Citation8]. In this study, optimal structure is examined using a method similar to greedy hill-climbing algorithm [Citation9]. The derived causal relationships between variables are indicated as a directed acyclic graph. For example, if the causal structure between three variables x, y, and z are represented (see ), then the relationship implies the following linear model:
Figure 3. Relationship of three variables.
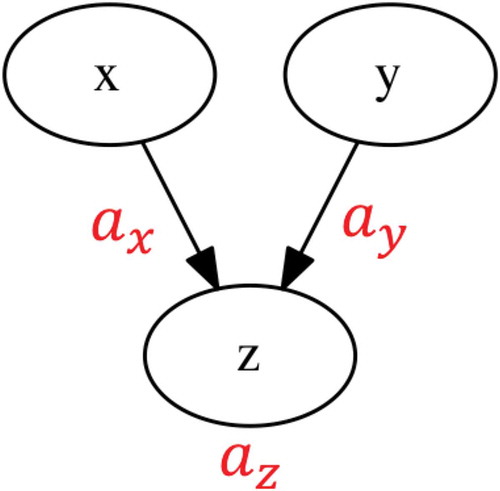
where ,
, and
indicate regression coefficients.
By investigating the relationship between multiple variables, we can eliminate the indirect relationship between various environmental factors and power consumption and focus on the direct relationship. In this study, the expected power consumption under the given environmental condition is estimated using the real-world data set. First, we derive the additive Bayesian networks for environmental variables and controllable variables, and this statistical structure is derived on the basis of a data set collected in a real system. Focusing on variables that directly affect power consumption, we express power consumption as a function of these variables. We use the average values for the controllable variables and derive the expected power consumption under the given environmental situation. We make two individual models for the light and dark periods by using the data sets collected from each period.
3.2. Operation planning of cultivation systems
Let ,
, and
be the decision variables.
is the number of cultivation systems whose operation cycle starts at time
,
is the purchased electric energy at time
, and
is the maximum power consumption. We consider the following objective function aiming to minimize the electricity charge (energy cost) related to the power consumption of cultivation systems.
where is the electricity price at time
,
is the basic price per unit, and
is the time section. The function consists of the basic charge calculated by maximum power consumption during the period and the electricity charge calculated by consumed electricity.
When minimizing Equation (2), we consider the following constraints:
where is the power consumption on time
of the cultivation system that activates at time
,
is the solar power generation output at time
,
is the total number of cultivation systems,
is the start time of the operation cycle of cultivation systems,
is the maximum number of cultivation systems that run in the same operation cycle, and
is the set of possible timings for devoting harvest work which indicates harvest work duty hours. Equation (7) indicates the constraints on the start time of the operation cycle and the maximum number of cultivation systems.
Optimizing Equation (2) under constraints (3)–(8) is a mixed integer programming (MIP) problem, and Gurobi solver [Citation10] is used to address this problem in this study.
4. Numerical simulation and discussion
Using real-world data, we experimentally evaluate the proposed framework and show the optimization result of the operation plan of cultivation systems that minimizes energy cost, considering the influence of environmental factors on power consumption. We first investigate the relationship between power consumption and other variables and express power consumption as a function of directly related variables. We then optimize the operation plan of the cultivation systems. The devised plan is evaluated by annual simulation.
4.1. Relationship between environmental factors and power consumption
We investigate the statistical relationship between power consumption, environmental control variables/factors, and weather factors shown in using additive Bayesian networks. We use a real-world data set collected in the six-month operation at the actual plant.
Table 1. Variables investigated in the experiment.
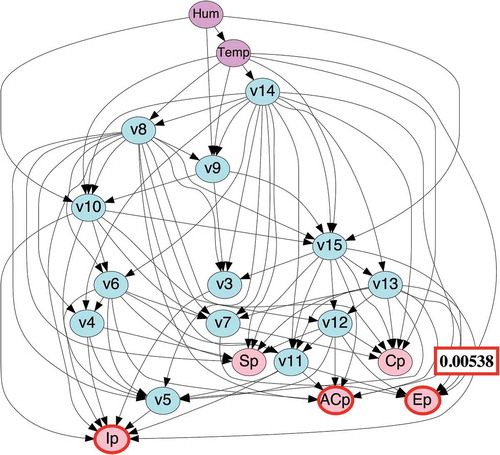
By analyzing relationships using real-world data composed of these variables, we obtain variables that directly affect power consumption. and show the result of directed acyclic graphs for light and dark periods, respectively. In these figures, the relationship in which the objective variable tends to be affected by the explanatory variable is represented by arrows. For example, in , (power supply AC 100V power consumption) is directly affected by
, v6, v9, v10, and v14.
Figure 4. Result of light period.
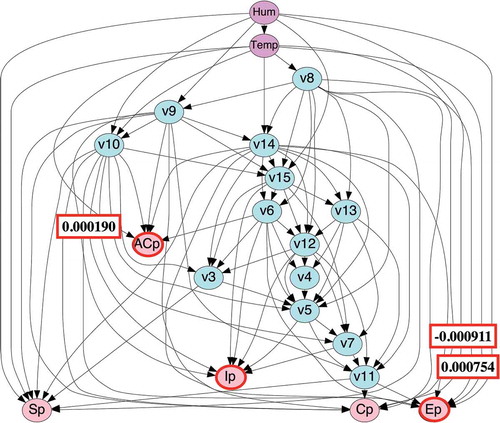
Figure 5. Result of dark period.
Total power consumption is obtained by the sum of ,
, and
as shown in Equation (9).
where is the power consumption [kW].
According to the result shown in and , ,
, and
are expressed by Equations (10) and (11) for each period as follows:
[light period]
[dark period]
Substituting Equations (10) and (11) for Equations (9), (12) and (13) express power consumption as functions of outside temperature and humidity for each case of light and dark periods.
[light period]
[dark period]
where is the difference between outside temperature and indoor setting temperature [°C], and
is the humidity [
].
In the light period, power consumption increased by 0.00773 kW when temperature rose 1°C, and power consumption decreased 0.000911 kW when humidity increased by 1%. In the dark period, power consumption increased by 0.00538 kW when temperature rose 1°C but was not directly affected by humidity. The influence of weather factors was weaker on power consumption in the dark period.
4.2. Evaluation of proposed scheme
In the following, we evaluate the effect of energy cost reduction based on the simulation using real-world data. The simulation period is one year (365 days). the power consumption of the cultivation system is calculated according to Equations (11) and (12). The start time of the operation cycle of each cultivation system τ is decided from candidates , and
and
are given as 2000 and 416, respectively. In this simulation, harvest duty hours
is set to be
, i.e., 9:00–19:00. Coefficients
and
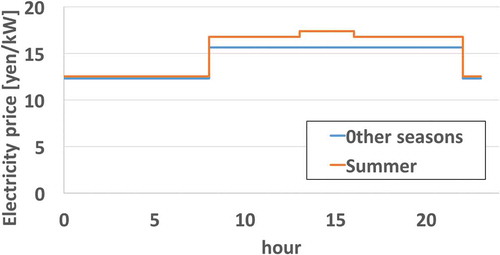
in Equation (2) are given on the basis of the electricity price plan of Tokyo Electric Power Company (see ). We assume that the rated output of the solar power generation system is 1000 kW. This power generation amount is derived on the basis of the solar radiation information in Tsukuba provided by the Japan Meteorological Agency [Citation11] in 2015. The following formula is used.
Figure 6. Electricity price.
where is the amount of solar radiation at time
,
is the intensity of solar radiation (=1),
is the loss coefficient (=0.73),
is the rated output,
is the angle of incidence of solar radiation on panel at time
, and
is the sun altitude at time
.
We compare the derived operation plan based on the proposed method with two other plans. First is the operation plan that activates 100 cultivation systems every 30 minutes between 9:00–19:00 (uniform plan). Second is the operation plan that uses average power consumption without considering weather factors (see ).
Figure 7. Average power consumption of a cultivation system.
shows maximum power consumption ratio per year and cost ratio of the plan derived from the proposed method, the uniform plan, and the plan discounting weather factors. The result shows that maximum power consumption was largest in the plan that discounted weather factors. The energy cost of the plan based on the proposed method is 1.13% less than that of the uniform plan and 0.04% less than that of the plan discounting weather factors. Considering the total amount of electricity required annually at a plant factory, the result implies that we can expect significant improvement in terms of energy cost.
Table 2. Relative power consumption and cost.
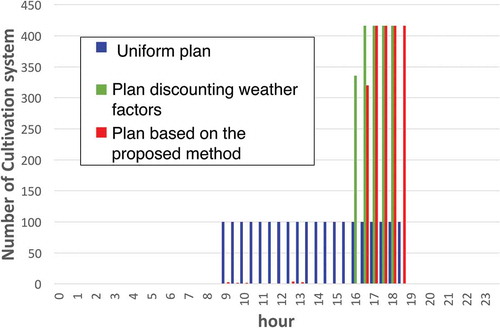
shows the number of cultivation systems starting at each time slot. The plan discounting weather factors and the plan based on the proposed method provided almost the same operation plan schedule. In the plan discounting weather factors, all cultivation systems started between 16:00 and 18:00, whereas in the plan based on the proposed method, the operation cycle of several cultivation systems started between 9:00 and 13:00. To reduce annual maximum power consumption and basic fee, several cultivation systems were rescheduled to different time slots. This rescheduling causes the smaller maximum power consumption of the plan based on the proposed method than that of the plan discounting weather factors.
Figure 8. Number of cultivation systems starting at each time slot.
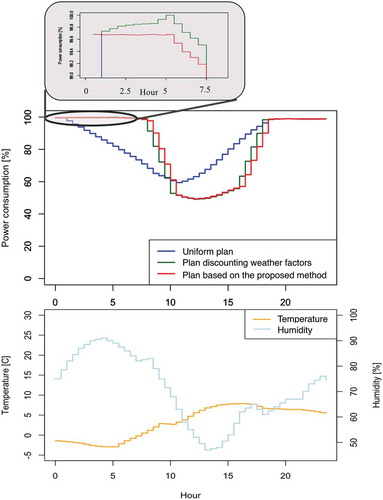
shows an example of half-hourly changes in temperature and humidity and the corresponding daily power consumption under operations shown in . In , maximum power consumption occurred at 5:00 when the temperature was very low. Thus, an increased amount of electric power was required to maintain the internal environment. The proposed method prevents such an increase in power consumption. The proposed method also suppresses power consumption during daytime when electricity price is high and increases power consumption at night when electricity price is low. This experiment shows that the proposed method is beneficial in terms of energy cost and real-world constraints.
Figure 9. Power consumption of derived pattern and weather factors.
5. Conclusions
Under various constraints to be considered in the plant factory, we formulated the optimization problem for the operation plan of the cultivation systems. Weather factors were considered using additive Bayesian networks for reducing energy cost. The numerical simulation based on real data showed that energy cost can be reduced by considering the influence of weather and environmental factors.
In this paper, we propose an independent air-conditioning control scheme for individual cultivation systems. We should note that cooperation between the global air-conditioning control scheme for the whole cultivation room and the local control scheme for each cultivation system will be important for achieving further energy cost reduction particularly in large-scale plant factories; though it remains as a future work.
Disclosure statement
No potential conflict of interest was reported by the authors.
Additional information
Notes on contributors
Saya Murakami
Saya Murakami received her Bachelor of Engineering degree in electrical engineering and bioscience from Waseda University, Japan in 2017, and she is currently a graduate student at the Department of Electrical Engineering and Bioscience at Waseda University. Her research interest includes energy management of plant factories. She is a student member of the Institute of Electrical Engineers in Japan (IEEJ).
Yu Fujimoto
Yu Fujimoto received his PhD in engineering from Waseda University, Tokyo, Japan in 2007. He is an associate professor at the Advanced Collaborative Research Organization for Smart Society, Waseda University. His primary areas of interest are machine learning and statistical data analysis. His current research interests include data mining in energy domains, especially for controlling power in smart grids, and statistical prediction of power fluctuations under the large-scale introduction of renewable energy sources.
Yasuhiro Hayashi
Yasuhiro Hayashi received his BE, ME, and DEng degrees from Waseda University, Japan in 1989, 1991, and 1994, respectively. In April 1994, he became a research associate at the Ibaraki University, Japan. In April 2000, he became an associate professor at the Department of Electrical and Electronics Engineering at the Fukui University. He became a professor in the Department of Electrical Engineering and Bioscience at Waseda University in April 2009. His research interests are optimization of distribution systems and forecasting, operation, planning, and control related to renewable energy sources and demand response.
Hideki Fuchikami
Hideki Fuchikami has been working for Mayekawa Mfg. Co., Ltd., Ibaraki, Japan since 2004. He received his ME degree from the Saga University in 2004. His current research interest is industrial heat pump systems.
Toshirou Hattori
Toshirou Hattori received his ME degree from Waseda University, Japan in 1979. He joined Mayekawa Mfg. Co., Ltd., in 1979. He became the director of the R&D center in 2009 and is now the executive director. His research interests are chemical engineering and product development.
References
- Japan Greenhouse Horticultural Association. Large scale facilities gardening/plant factory - actual situation survey case studies; 2016 Mar. Japanese. Accessed on 6th June 2018. Available from: http://www.jgha.com/jisedai/h27/r2/h27r25.pdf
- Watanabe H. Light-controlled plant cultivation system in Japan – development of a vegetable factory using LEDs as a light source for plants. Acta Hortic. 2011;907:37–44.
- Shrouf F, Ordieres-Meré J, García-Sánchez A, et al. Optimizing the production scheduling of a single machine to minimize total energy consumption costs. J Clean Prod. 2014 Mar;67:197–207.
- Pittavino M. Additive Bayesian networks for multivariate data: parameter learning, model fitting and applications in veterinary epidemiology. Zurich, Switzerland: University of Zurich; 2016.
- Koller D, Friedman N. Probabilistic graphical models principles and techniques. London, England: The MIT Press;2009.
- McCullagh P. Generalized linear models. Eur J Oper Res. 1984 Jun;16(3):285–292.
- Lewis FI abn: modelling multivariate data with additive bayesian networks. R package version 1.0.2. 2016
- Lewis FI, Brülisauer F, Gunn GJ. Structure discovery in Bayesian networks: an analytical tool for analysing complex animal health data. Prev Vet Med. 2011 Jun;100(2):109–115.
- Mitchell M, Holland JH, Forrest S. When will a genetic algorithm outperform hill climbing? Morgan-Kaufmann. Advances in neural information processing systems. San Francisco, CA, USA; 1994. p. 51–58.
- Gurobi Optimization, Inc. Gurobi optimizer reference manual; [ cited 2017 Apr 10]. Accessed on 6th June 2018. Available from: https://www.gurobi.com
- New solar energy use handbook editing committee. New solar energy utilization handbook. Tokyo, Japan: Japan solar energy society; 2000–12. p. 1–5, 784–785.