
 ?Mathematical formulae have been encoded as MathML and are displayed in this HTML version using MathJax in order to improve their display. Uncheck the box to turn MathJax off. This feature requires Javascript. Click on a formula to zoom.
ABSTRACT
In this paper, the authors propose a method of improvement of power quality by static synchronous compensators (STATCOMs) for low voltage system (single-phase STATCOMs) added the function of harmonic suppression. In the proposal method, the STATCOMs control the voltage of the distribution system within the proper range by compensating the reactive power. Additionally, they are operated as the filtering function and suppress harmonics of the voltage of the distribution system. The filtering gain is determined by PI controlling the error between the voltage total harmonic distortion of the point voltage at the installation of STATCOMs and the target value. In order to verify the validity of the proposal method, the numerical calculations are carried out by using an analytical model of distribution system which interconnected photovoltaic generation systems. Simulation results show the effect of improvement of power quality on both sides of voltage deviation and harmonics.
1. Introduction
In recent years, against a background of an environmental problem and resource problem, the number of interconnection of distributed generators (DGs) such as the photovoltaic generations (PVs) and wind power generations have been increasing. However, the outputs of these DGs change rapidly with the influences of the weather, condition of location, etc. It may cause the voltage fluctuation in the distribution system. Therefore, it is concerned that the point voltages of distribution system change violently and they may deviate from the proper range for voltage. On the other hand, there is also concern about the deterioration of power quality of the distribution system such as the increase of harmonics. These are thought to be caused by the progress of power electronics technology and the increase of the number of interconnection of DGs for home. In general, to maintain the point voltages in the distribution system, the various control devices such as the load ratio control transformer (LRT), the step voltage regulator (SVR), the static var compensator (SVC), and the static synchronous compensator (STATCOM) have been used. Moreover, the active filter has been used to suppress harmonics in the distribution system. Most of these devices are installed at the high voltage system, and the various studies on the voltage management by them in the distribution system interconnected DGs have been done [Citation1–Citation4]. However, most of the DGs are generally installed in the low voltage system and the number of them will be increasing more and more in the future. Therefore, it is considered that it may become more difficult to control the voltage in the low voltage system completely by the devices installed at the high voltage system. To this problem, installing the voltage control devices at the low voltage system has been proposed. For example, it has been reported about researches of development of the compact STATCOM and the single-phase active filter [Citation5–Citation7]. In the above background, the authors have been proposed a voltage control method by STATCOMs for low voltage system [Citation8].
In this paper, the authors focus on that circuit configuration of STATCOM is the same as the active filter and propose a method of improvement of power quality by STATCOMs for low voltage system (single-phase STATCOMs) added the function of harmonic suppression. In the proposal method, the STATCOMs control the voltage of the distribution system within the proper range by compensating the reactive power. Additionally, they are operated as the filtering function and suppress harmonics of the voltage of the distribution system. The filtering gain is determined by PI controlling the error between the total harmonic distortion (THD) of the point voltage at the installation of STATCOMs and the target value. In order to verify the validity of the proposal method, the numerical calculations are carried out by using an analytical model of distribution system which interconnected PVs.
2. STATCOM for low voltage system
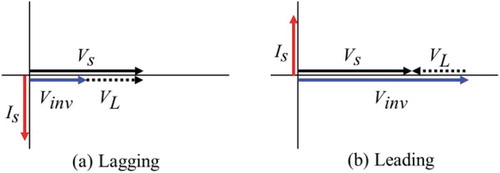
shows the main circuit of STATCOM for low voltage system. It is a single-phase voltage type inverter composed by switching devices such as IGBT, a DC-capacitor C, and an interconnected inductor L. By controlling the switching devices, it is possible to generate an AC waveform of any amplitude, frequency, and phase from the DC voltage charged in the capacitor. shows the generation principle of the reactive power by STATCOM. In , Vs is the system voltage, Vinv is the output voltage of STATCOM, and VL is the potential difference between Vs and Vinv. When Vs is larger than Vinv, the lagging reactive current is outputted in the side of the distribution system. In contrast, when Vs is smaller than Vinv, the leading reactive current is outputted. Therefore, STATCOM can absorb or supply the reactive power to maintain the voltage at the installation point by controlling Vinv.
Figure 1. Main circuit of STATCOM for low voltage system.
Figure 2. Generation principle of reactive power by STATCOM.
On the other hand, the circuit configuration of the active filter is the same as STATCOM which is a voltage type inverter. In this study, a voltage detection system is used as a control method of the active filter [Citation9]. In this way, the compensating current reference ih* is given by (1).
where vh is the harmonics in the installation point voltage and Kv is a control gain. The active filter behaves as a resistance of 1/Kv () to harmonic voltage. It is possible to suppress the spread of harmonics phenomenon by setting the gain Kv accurately.
3. Voltage control by STATCOMs
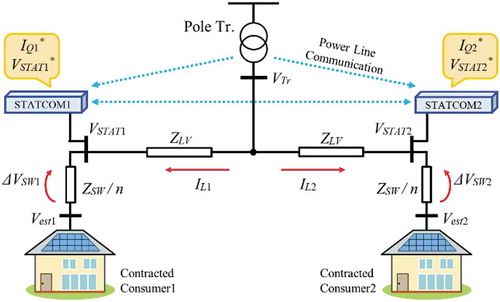
shows the conceptual diagram of the supposed low voltage system. The supposed low voltage system is spread to left and right from the pole transformer. In this study, STATCOM for low voltage system is installed on each utility pole at both ends of the low voltage system. Moreover, the STATCOM can get the measurement information of the pole transformer and another STATCOM from the power line communication. When the reverse power flow from PVs installed at the consumer is happened, the voltage rise will be occurred at the consumer caused by the reverse current flow of PVs through the service wire. In Japan, it is defined to maintain the consumer voltage of the low voltage system based on 100 V within 1016 V. Therefore, the target voltage of STATCOMs must be set considering the voltage rise at the service wire.
Figure 3. Conceptual diagram of low voltage system.
In this study, STATCOMs estimate the interconnection point voltage of consumer and the reference reactive current is determined from the following steps.
[Step 1]
At first, contract plural consumers between the pole transformer and the installation point of STATCOM to one.
[Step 2]
Next, estimate the interconnection point voltage of the contracted consumer Vest. Vest is calculated by (2)–(4).
where ILi is a current flowing to the contracted consumer i, VTr is a voltage of the secondary side of the pole transformer, VSTATi is an interconnection point voltage of STATCOMi, ZLV is the average impedance of low voltage distribution line, Zsw is the average impedance of service wire, n is the number of contracted consumers, Vsw is the change amount of voltage at the service wire, Vesti is the estimated interconnection point voltage of the contracted consumer i.
[Step 3]
If Vest deviates the target range of voltage determine the target voltage of STATCOM VSTAT* considering the voltage rise at the service wire. VSTAT* is calculated by (5).
where VSTATi* is the target voltage of STATCOMi, VTarget_H and VTarget_L are upper and lower limit of the target range of voltage, respectively.
[Step 4]
In this study, each STATCOM shares the control amount to reduce the total capacity of itself using the power line communication. The target voltage of STATCOM after sharing the control amount VSTAT_share* is calculated by (6).
where VSTATi_share* is the target voltage of STATCOMi after sharing the control amount and M is the number of STATCOMs installed in a low voltage system.
[Step 5]
Finally, determine the reactive current reference IQ* after sharing the control amount of each STATCOM. IQ* is calculated by PI controlling the error of VSTAT_share* and VSTAT as the following (7).
where IQi* is the reactive current reference of STATCOMi, KP1 is proportional gain, and KI1 is integral gain.
4. Proposed control method of STATCOMs
shows the block diagram of the control circuit with the filtering function. The control circuit is composed of two units, the voltage control unit and the harmonics control unit. In the voltage control unit, the reactive current reference iQ* is calculated by PI controlling the error of the target voltage VSTAT_share* and the interconnection point voltage of STATCOM VSTAT as already mentioned in Chapter 3.
Figure 4. Block diagram of control circuit with filtering function.
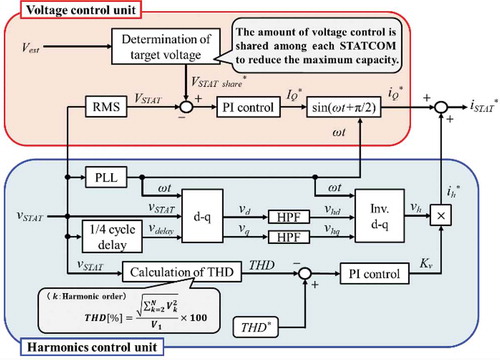
On the other hand, the compensating current reference ih* is calculated in the harmonics control unit, and the control principle is the same as the active filter. At first, the detected voltage vSTAT is transformed into the d-q coordinates, vd and vq. Then, the dc component of them which corresponds to the fundamental frequency is extracted by high-pass filters (HPFs). After that, the harmonic voltage vh is calculated by the inverse d-q transformation of the harmonic voltages on the d-q coordinates, vhd and vhq. Moreover, the control gain Kv is determined by PI controlling the error between the THD of vSTAT and the target value THD*. The voltage THD and Kv are given by (8) and (9). Therefore, ih* is calculated by (1).
where THD is the total harmonic distortion, V1 is the fundamental voltage, Vk is the k-th harmonic voltage, KP2 is proportional gain, and KI2 is integral gain.
At last, the output current reference of STATCOM iSTAT* is determined as the total value of iQ* and ih*, and given by (10). In this control method, STATCOM is operated as the filtering function even when there is no voltage deviation in the low voltage system, and it is useful for the improvement of power quality throughout the day.
5. Numerical calculation example
In order to verify the validity of the proposed method, the numerical calculations are carried out by using an analytical model of distribution system under widespread of PVs.
5.1. Analytical model and simulation condition
The analytical model of the distribution system is shown in . In this figure, the high voltage system (6.6 kV-50 Hz distribution system) is simulated with a voltage source including the fifth harmonic voltage of 5%. In this study, the analysis target is a low voltage system supposed as a single-phase three-wire system. The simulation condition is shown in .
Figure 5. Analytical model of the distribution system.
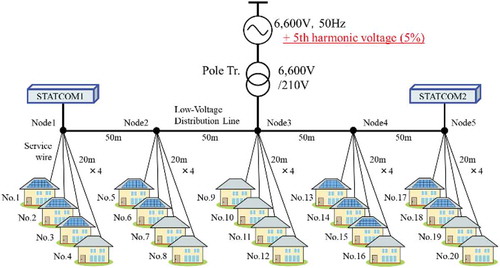
Table 1. Simulation condition.
The supposed low voltage system is spread to left and right from the pole transformer. STATCOMs are installed at Node1 and Node5, ends of the low voltage system. The target value of THD is set to 3% since 6.6 kV distribution system needs to be kept the voltage THD under 5% and the voltage distortion of each order harmonic under 3% as the level of harmonic environmental target in Japan [Citation10].
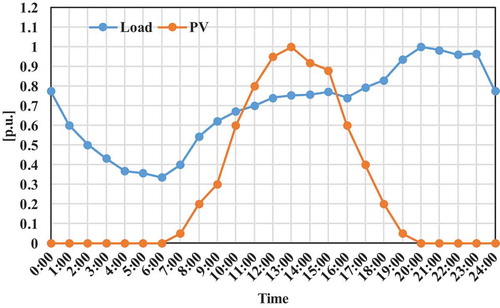
The total number of residential loads (consumers) are 20 and four of them are connected at each node. Moreover, most PVs are interconnected to end sides of the distribution system assuming the voltage deviation from the proper range. The consumers installed PVs are No.1, No.2, No.3, No.5, No.6, No.13, No.14, No.15, No.17, and No.18, it is 50% of the consumers. The load curve and the output of PV used for the numerical calculation are shown in .
Figure 6. Input data (load curve and output of PV).
5.2. Simulation results
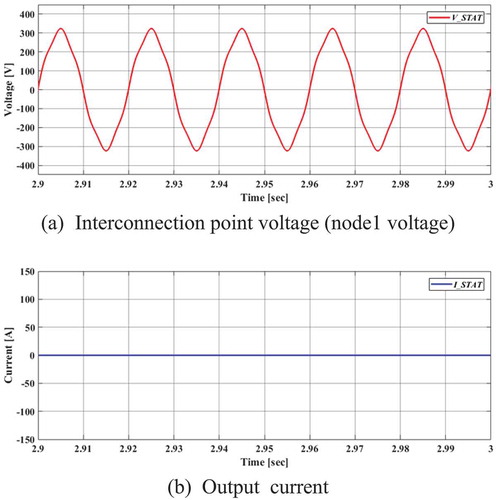
– show simulation results without STATCOM control. shows consumer voltages and the voltages deviate the upper limit of proper range in the daytime by the influence of PVs. shows the THD of each node voltage. In , the voltage THD is kept to about 5% in all nodes by a voltage source used as the high voltage system. However, in the daytime, voltage THDs are under 5%. It is thought to be caused by the increase of fundamental voltage by the influence of PVs. Moreover, shows the waveforms of STATCOM1 at 13:00. It can also be confirmed from that interconnection point voltage (node1 voltage) deviates the upper limit of proper range and the waveform itself is distorted. At this time, the output current of STATCOMs is zero as shown in , since STATCOMs are not operated.
Figure 7. Consumer voltages without control.
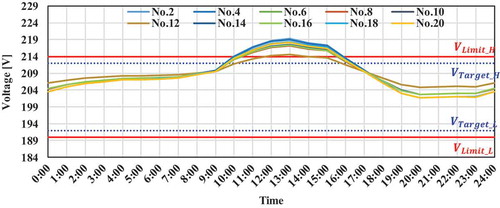
Figure 8. THD of each node voltage without control. (a) Interconnection point voltage (node1 voltage). (b) Output current.
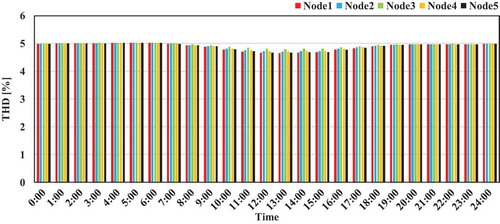
Figure 9. Waveforms of STATCOM1 at 13:00 without control.
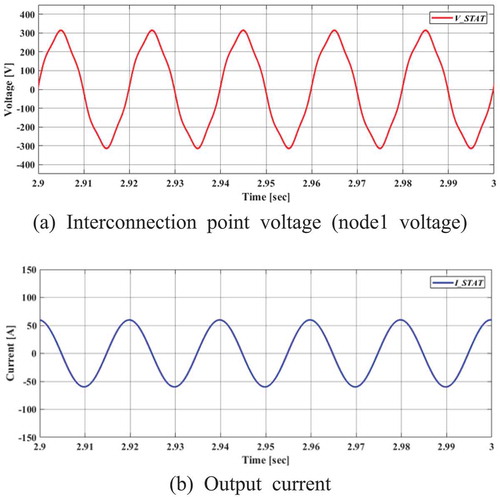
– show simulation results with conventional STATCOM control. Conventional control means only voltage control by reactive power control of STATCOM. shows consumer voltages and they are controlled within the proper range. However, the THD of each node voltage is still kept to about 5% as shown in . shows the output of STATCOMs. As shown in , STATCOMs are operated in the daytime depending on the amount of voltage deviation from the target range. Additionally, the value of each STATCOM output is almost the same, since the control amount is shared between each STATCOM to reduce the total capacity of itself. The maximum output is about 9.1 kVA. Moreover, shows the waveforms of STATCOM1 at 13:00. Compared with , the peak value of interconnection point voltage (node1 voltage) is decreasing (). It is thought to be caused by the reactive power control of STATCOM and the reactive output current is shown in .
Figure 10. Consumer voltages with conventional control.

Figure 11. THD of each node voltage with conventional control.
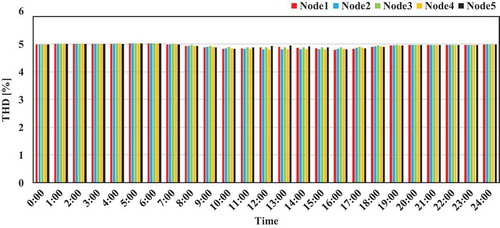
Figure 12. Output of STATCOMs with conventional control. (a) Interconnection point voltage (node1 voltage). (b) Output current.
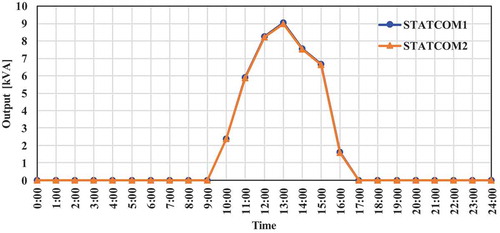
Figure 13. Waveforms of STATCOM1 at 13:00 with conventional control.
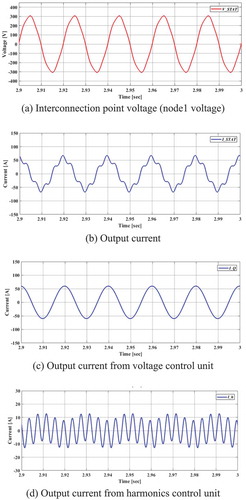
– show simulation results with proposed STATCOM control which is including the filtering function. shows consumer voltages and they are controlled within the proper range. Additionally, the THD of each node voltage is also controlled and decreasing to about 3% (). The THD of node3 voltage is larger than 3% and the largest value in all nodes. It is thought to be due to that node3 is located farthest from interconnection points of STATCOMs (node1 and node5). However, it is thought to be enough effect, since there is no rule about the voltage THD in low voltage system in Japan. The broken line in means the content rate of harmonics included in the voltage source used as a high voltage system and the environmental target value of harmonics in a Japanese high voltage system. shows the outputs of STATCOMs. As shown in , STATCOMs are operated throughout the day. The average output for harmonics control is about 1.7 kVA and the maximum output for voltage control is about 9.1 kVA. Therefore, the maximum total output of STATCOM is about 10.8 kVA. Moreover, shows the waveforms of STATCOM1 at 13:00. The waveform of interconnection point voltage (node1 voltage) is getting close to a sinusoidal wave with no distortion (). At this time, the output current of STATCOM is shown in . It is a total value of output currents from the voltage control unit () and the harmonics control unit (). It can also be confirmed from that STATCOM is compensating both the reactive power and harmonics voltage at the interconnection point.
Figure 14. Consumer voltages with proposed control.
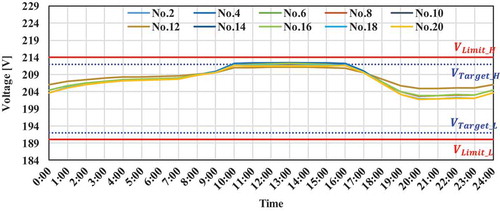
Figure 15. THD of each node voltage with proposed control.
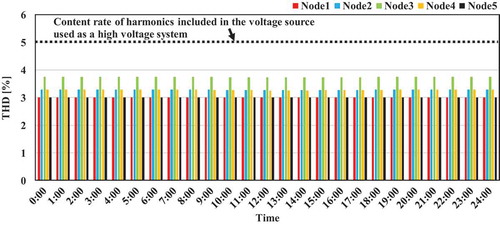
Figure 16. Output of STATCOMs with proposed control. (a) Interconnection point voltage (node1 voltage). (b) Output current. (c) Output current from voltage control unit. (d) Output current from harmonics control unit.
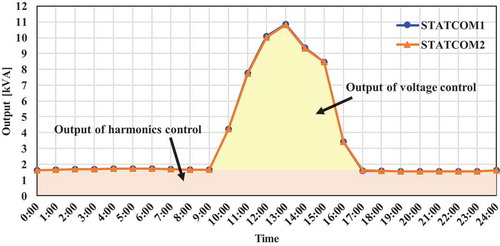
Figure 17. Waveforms of STATCOM1 at 13:00 with proposed control.
6. Conclusion
In this paper, the authors proposed the method of improvement of power quality by STATCOMs for low voltage system added the function of harmonic suppression. In the proposed method, the STATCOMs are operated as the filtering function even when there is no voltage deviation in low voltage system and compensate both the reactive power and harmonic voltage at the interconnection point throughout the day. In order to verify the validity of the proposed method, the numerical calculations were carried out by using an analytical model of distribution system under widespread of PVs. Simulation results showed the improvement effect of power quality on both sides of voltage deviation and harmonics.
In the future, it is necessary to investigate the cooperative control method with another voltage devices. Moreover, the authors will develop a STATCOM for low voltage system and verify the usefulness of the proposed method using the experiment facilities.
Disclosure statement
No potential conflict of interest was reported by the authors.
Additional information
Funding
Notes on contributors

Shoji Kawasaki
Shoji Kawasaki received the B.S. and M.S., and Doctor of Engineering degrees in electrical engineering from Fukui University, Fukui, Japan in 1991, 1993, and 2009, respectively. He joined Komatsu Ltd. in 1993. And after he joined the Department of Electrical and Electronics Engineering, Fukui University for nineteen years, he is now an Associate Professor in the Department of Electronics and Bioinformatics, Meiji University. His research interests are advancement of electric power system and improvement of power quality. He is a member of IEEE and IEE of Japan.

Keitaro Suzuki
Keitaro Suzuki received B.S degree in science and technology from Meiji University, Japan in 2017. He is now a master course student of Meiji University. His research interests are control of inverter used for renewable energy, and improvement of power quality.
References
- Iioka D, Sakakibara K, Yokomizu Y, et al. Distribution voltage rise at dense photovoltaic power generation area and its suppression by SVC. IEEJ Trans PE. 2006;126(2):153–158.
- Kawasaki S, Kanemoto N, Taoka H, et al. Cooperative voltage control method by power factor control of PV systems and LRT. IEEJ Trans PE. 2012;132(4):309–316.
- Kawasaki S, Kurokawa N, Taoka H, et al. Cooperative control by system voltage control equipments in consideration of reducing capacity of STATCOM. IEEJ Trans PE. 2014;134(5):378–385.
- Yamashita H, Jintakosonwit P, Fujita H, et al. Voltage regulation performance of a shunt active filter intended for installation on a power distribution system. IEEJ Trans IA. 2003;123(11):1351–1358.
- Fukushima K, Noda T, Kabasawa Y, et al. Development of a distributed static synchronous compensator micro-STATCOM (Part 1) – its concept and fundamental validation using a prototype model. Electric Power Engineering Research Laboratory Report; Central Research Institute of Electric Power Industry (CRIEPI); 2012. ( CRIEPI, No.H11029).
- Kabasawa Y, Noda T, Fukushima K, et al. Development of a distributed static synchronous compensator micro-STATCOM (Part 2) – A study of consumer voltage regulation when photovoltaic generation systems and electric vehicles come into wide use. Electric Power Engineering Research Laboratory Report; Central Research Institute of Electric Power Industry (CRIEPI); 2012. ( CRIEPI, No.H11030).
- Yoshida H, Wada K, Shimizu T. Frequency limitation method for reducing the power rating of a single-phase active filter. IEEJ Trans IA. 2014;134(2):202–208.
- Koyama M, Suzuki K, Kawasaki S. Voltage control method by STATCOM for low voltage system. Proc Annu Meeting Rec IEEJ. 2017;6–179:303–304.
- Akagi H. Control strategy and site selection of a shunt active filter for installation on a power distribution system. IEEJ Trans IA. 1996;116(3):285–293.
- Special Committee on Harmonic Suppression Measures. Guidelines for harmonic suppression technology. The Japan Electric Association; 2013. (JEAG 9702).