
ABSTRACT
Exposure to cold climate is an inevitable consequence of military training in Norway. Adequate peripheral microcirculation in the extremities is important to maintain temperature, and to protect against freezing cold injuries. The aim of this study was to investigate the variability in skin rewarming ability. The study subjects consisted of 260 healthy Norwegian army conscripts, following a mild cold provocation test (hands immersed in 20°C water for 1 min) using dynamic infrared thermography (DIRT). Thermal images were obtained to investigate any differences in skin rewarming ability of the hand (fingers). DIRT took place under standardised and stable study conditions. Conscripts were characterised as either slow, intermediate or rapid rewarmers. While 90% could recover, partially or completely, within 4 min to the skin temperature values before the provocation test, 10% showed a slow rewarming pattern. In the slow rewarmers, the rewarming ability was correlated with a low average temperature of the hands prior to the cooling test. The healthy young army conscripts in this study showed a large variability in their rewarming ability following a standardised mild cold provocation test.
Introduction
More than half of Norway is above the Polar Circle. In the harsh Norwegian climate, the annual number of army conscripts undergoing basic military winter training is approximately 7,500. People in the northern part of the country, and especially in the inland areas, are exposed to winter conditions with temperatures often reaching −40°C. The incidence of cold injuries among soldiers during winter service in the northern part of Scandinavia has been reported to be around 2% per year [Citation1,Citation2].
Since exposure to cold climate is an inevitable consequence of military training, there is a need for increased focus on prevention and risk factor identification for cold injuries in soldiers [Citation3]. However, there are no evidence-based techniques for identifying individual risk factors for susceptibility to cold injuries [Citation4]. Skin-surface temperature is highly dependent on blood circulation in the outer millimetres of the skin, which is controlled by a complex autonomic regulatory system as well as local factors. There are although research findings underpinning the fact that nerve function governing vessel diameter is essential in terms of regulation of peripheral microcirculation as part of the pathophysiology of cold injuries [Citation5].
When exposure to cold climate, the individual seems to respond with dynamic adaptation in which the arterio-venous anastomoses (AVAs) are thought to play a major role [Citation6]. Non-myelinated fibres on the wall of the vessel are under the influence of the sympathetic nervous system, and the “Hunting reaction” mediated through cold-induced vasodilation is important in regulating finger bloodflow [Citation7].
Studies in humans have shown that there is a good correlation between peripheral circulation and skin temperature [Citation8], particularly in the acral appendages [Citation9]. In Raynaud’s phenomenon and other peripheral circular disturbances, infrared thermography (IRT) has been used to define potential endpoints in therapeutic trials that overcome the limitation of self-reported assessment [Citation10]. Dynamic infrared thermography (DIRT), involving the use of thermal provocations tests, has been used in investigating circulatory disturbances especially in the hands such as vasospastic disorders seen in Raynaud’s phenomenon [Citation11–Citation13].
Since vasomotor responses in the skin are good indications of peripheral nerve function, it has been assumed that slow rewarmers after a mild cold provocation test might be less protected against cold injuries [Citation14].
Aim
The main aim of this study was to investigate the variability in the ability of skin rewarming of the fingers monitored with DIRT in a large, random cohort of young healthy army conscripts. A second aim was to relate peripheral skin rewarming to a variety of intrinsic and extrinsic variables.
Materials and method
The study subjects consisted of 260 army conscripts from 2 cohorts. In august 2014, 122 conscripts enrolled in the Panzer-Battalion (August cohort). In January 2015, 138 conscripts enrolled in the Artillery-battalion (January cohort). All conscripts in both cohorts carried out their basic training at Setermoen garrison (68.9°N, 18.3°E) in Troms County, Northern Norway, one of the coldest military camps in the country.
Thermographic imaging was performed during the first week of the conscript duty, both at enrolment in August and in January. The military education starts with an introductory recruit period with conscript training including basic military skills, weapons training, drills and physical training [Citation15]. The August cohort continued with more specialised Panzer battalion functions [Citation16]. The January cohort entered the winter exercise more or less directly after their 8 weeks introductory recruit period.
All conscripts enrolling to the Panzer and Artillery battalion is medically preselected through a thorough screening process in which many of candidates are excluded, the clear majority due to medical complaints. The inclusion criterion was normal findings at medical screening during enrolment. The conscripts completed a questionnaire regarding previous injuries and/or diseases that could interfere with the study protocol. No one was excluded due to health complaints or previous medical history. There was a loss to follow-up of 2 + 3 conscripts, leaving 120 and 135 conscripts in the August and January cohorts, respectively. In total, 255 conscripts were included in the analyses.
Due to the military training schedule, the available time to carry out our study was limited to a few days, and the conscripts were examined at different times of the day. Thus, to process a large number of conscripts, we had to perform DIRT throughout the whole day (08:00–20:00).
The conscripts were allowed to follow the daily intake of food at the ordinary fixed hours of serving in the military campus. The conscripts were not allowed to smoke, use smokeless moist powdered tobacco (snus) or to drink caffeine-containing liquids less than 2 h before DIRT. They were also instructed not to drink any hot or cold beverages less than 1 h before, and not to wash their hands in cold water less than 30 min before DIRT.
The conscripts were also asked to assess their temperature status compared to what they thought other experienced. They were informed that people differ in the way they evaluate temperature and are different in the way they assess warm/cold hands. The question to the conscripts was “Compared to others, how do you assess the temperature of the palmar side of your hands?”
An informed consent was obtained before enrolment into the study. The regional ethical committee approved the research protocol.
The conscripts had a mean age of 22.5 years (range 22–31) with a mean BMI 23.79 kg/m2 (range 16–34). A percentage of 12 were female. A high proportion was using smokeless tobacco (snuss) while a minor part were smokers, which mirrored recent trends in Scandinavian tobacco use [Citation17]. Concerning the use of nicotine, the conscripts were asked if they had previously used nicotine or were current users. The wording of the question did not separate these two situations.
All conscripts were asked to rate their current general health, choosing between four categories: “very poor”, “poor”, “good” and “very good”. The clear majority (99.5%) evaluated their own general health as good or very good, and noone selected the alternative “very poor”. The conscripts were not asked to rate their physical activity, but all conscripts entering the Panzer and Artillery battalion are generally at an equally well-trained level.
The conscripts were also asked to rate their own mental health. The question was in terms of mental health, have you the latest 4 weeks felt yourself nervous/agitated, fear, irritable, down/depressed or lonely? These optional alternatives were given in four categories: “no”, “a little”, “quite a lot” and “a lot” grading the mental status from 0 to 3. The conscripts were also asked whether they had felt secure and “quiet”, “happy”, “optimistic”, and for these responses, the answers were valued in a reversed scale (3–0).
To our knowledge, the composite scores of mental issues and risk taking have not been used in previous comparable studies. The risk-taking behaviour was assessed in a similar way by asking, using a self-constructed questionnaire. The conscripts were told that we were interested in their risk-taking behaviour in daily life. The conscripts were asked specifically if any of the following is present or previous behaviour. The areas in which the conscripts should rate their risk-behaviour were spare time risk-taking assessment, taking risks with health, risk taking at work, financial risk taking, ignoring safety risks and social risk taking. The self-assessing risk-taking scores had five levels (0–4): “never”, “rarely”, “occasionally”, “often” and “very often”. The overall score is a combined variable based on the answers to all the questions. All conscripts rated themselves with a low risk-taking-related behaviour.
See for descriptive characteristics.
Nervous/Agitated, fear, irritable, down/depressed, lonely
Secure and quiet/happy/optimistic (NB reversed scale)
Spare time risk-taking assessment, taking risks with health, risk taking at work, financial risk taking, ignoring safety risks, social risk taking
Table 1. Descriptive characteristics of the two cohorts (n = 255).
The research venue
DIRT took place under standardised and stable conditions in three adjoining rooms in a well-heated building at Setermoen garrison. For both cohorts, the indoor temperature in the three adjoining examination rooms was held at 23°C (± 1°C). During the investigation of the August cohort, the outdoor temperature at Bardufoss Weather Observation Station, next to Setermoen Garrison, at 2 pm was 20.8°C.
For the January cohort, the outdoor temperature at Bardufoss Weather Observation Station at 2 pm was −9.7°C. All conscripts were acclimatised, for a minimum of 30 min to the indoor room temperature before the DIRT examination. Prior to the acclimatisation, the January cohort waited dressed in full winter clothing inside in an adjacent hall at room temperature of 15°C for at least 1 h.
In each of the three examination rooms, there were identical experimental setups for the DIRT examinations. The conscripts waited outside the rooms in an adjoining hallway wearing standard indoor uniforms. Upon their turn, each conscript entered one of the three rooms, as it became available (random order).
All three rooms had north-facing windows with drawn curtains. The maximum air movement at the ceiling close to the air ventilation in- and outlets was 2.2–2.5 m/s, while the airflow at hand-height in the sitting position was less than 0.1 m/s as measured by a TA-5 Thermal anemometer (Serial 089251).
DIRT procedure
In each of the examination rooms, the conditions were kept as identical as possible using the same procedure and type of equipment. With exposed forearms, the conscript was comfortably seated using a standard office chair with an adjustable height. During DIRT, both hands were positioned palms down on a grid made of thin nylon netting strung on a plastic frame [Citation18] ().
Figure 1. The set-up for dynamic infrared thermography (DIRT). Figure 1 reprinted with permission from Ina Isabella Høiland, the author of the master thesis at the UiT – The Arctic University of Norway; “The effect of oral uptake of nicotine on skin blood perfusion of the face and hands in snus users as determined by thermography” [Citation18].
![Figure 1. The set-up for dynamic infrared thermography (DIRT). Figure 1 reprinted with permission from Ina Isabella Høiland, the author of the master thesis at the UiT – The Arctic University of Norway; “The effect of oral uptake of nicotine on skin blood perfusion of the face and hands in snus users as determined by thermography” [Citation18].](/cms/asset/6ecbd403-2974-4dc3-9a15-e4f8ee77bec1/zich_a_1536250_f0001_b.gif)
The nylon grid was positioned 7 cm (±0.5 cm) above a uniformly heated base plate (40 ± 2°C). This ensured a thermally uniform background for the thermal imaging. DIRT of the dorsal side of the hands encompassed a pre-cooling phase (T1), a cooling phase of 1 min (T2), and a 4-min recovery phase (T3, T4, T5 and T6). The pre-cooling phase includes baseline measurements before the DIRT takes place and includes also the time from the initial image (T1) until the hands are immersed in water.
Following the pre-cooling phase, the hands were briefly removed from the nylon grid and each placed inside a thin plastic bag that extended to the elbows. The gloved hands were then simultaneously immersed in 20°C water (± 1°C) for 1 min up to the level of the wrists. The selection of provocation test was based on literature, previous experience and pilot study [Citation19]. Directly following the cold challenge, the plastic bags were removed, and the hands replaced palm down on the nylon grid. During the 4-min recovery, thermal images were taken continuously at 1-s intervals [Citation19].
The stored thermographic images used for analysis were obtained from six different time points: one before (T1) and one immediately after the cold challenge (T2) and thereafter at 1-min intervals during the 4-min spontaneous rewarming period (T3–T6).
The thermographic cameras and the software
Three infrared (IR) cameras were used in the data collection: FLIR ThermaCAM™ T650 C, FLIR ThermaCAM™ A645sc and FLIR ThermaCAM™ S65HS. The emissivity was set to 0.98. A rainbow pallet was used as temperature colour scale. The IR cameras were calibrated using a stable and constant temperature black body source accurate to 0.1°C based on a certified and traceable temperature measurement source (IR-301 Blackbody controller – Infrared System Development Corporation). For the calibration process, the black body source had a set temperature of 36.1°C and emissivity of 0.96. The distance from the blackbody controller was 0.5 m (±0.1 m). The recorded temperature at FLIR ThermaCAM™ T650 C was 36.1°C, the FLIR ThermaCAM™ A645sc was 36.1°C and at FLIR ThermaCAM™ S65HS was 36.0°C.
ThermaCAM ResearchIR® version 3.5 (FLIR Systems AB, USA) software was used for assessing the mean temperature along a straight-line region of interest (ROI) positioned at the mid-dorsal side of all fingers. Each line extended from the middle of the nailbed and to the interdigital web. This gave 10 average individual finger-temperatures for each of the 6 different time points described above. These 10 averages were then used to calculate a mean temperature of all the fingers for each time point.
These average values were used as a numerical expression of the temperature status of the hand at each of the six selected measured time points (T1–T6). These values were used for statistical analysis.
Data analysis and statistics
Descriptive characteristics were presented as per cent (number) or mean (standard deviation, SD), as appropriate. Rewarming was defined as the difference between skin temperature at T6 (end-cooling) minus T2 (end-rewarming).
The null hypothesis was that all subjects rewarm identically. However, during thermographic imaging in the August cohort, it became very clear that the subjects could be subdivided into rewarming groups according to the visual impression. Two experienced thermography researchers (AJN and JBM) performed an independent judgement and separated all subjects in the August cohort into three groups: slow, intermediate and rapid responders. The rapid responders rewarmed completely. The intermediate responders rewarmed partially, while the slow responders did not show any significant rewarming at all during the 4-min observational period. Since the categorisation of rewarming groups was based on subjective impression, the groups were not statistically tested regarding significant differences in the distributions of subjects across these categories.
The three rewarming groups were thereafter defined using percentiles of the rewarming variable as follows: slow responders are those in the lowest 10th percentile, intermediate responders are those between the 10th and the 28th percentile and rapid responders are those above the 28th percentile. The selection of cut-off-point was chosen arbitrarily according to the visual impression of the thermographic images. The same subjective judgement was performed during the investigations in the January cohort.
Differences between groups were tested using two-sample t-test or ANOVA for continuous variables and Pearson chi-square test for binary variables. Trends in finger skin temperature of the hand over time (T1–T6) were presented as time point-specific means with the 2.5th, 10th and 97.5th percentile.
Trends in mean finger skin temperature over time were also presented according to the rewarming group. Tests of group and time point differences in temperature were assessed using linear mixed models where indicator variables of time and group were included as independent variables. Interaction terms between each time point and each group were added as two-way interaction terms. Possible dependencies between repeated observations were controlled for by specifying a compound symmetry covariance matrix.
Associations between rewarming as the dependent variable and socio-demographic variables, nicotine status and other personal characteristics as independent variables were assessed using multivariable linear regression models. For each independent variable, two models were assessed, one with adjustment for cohort and one with additional adjustment for the pre-cooling (T1) value.
The adjustments were performed by adding a binary cohort variable or a continuous T1 variable to the models. Graphical inspections of the residuals assessed model assumptions. Statistical analyses were performed using SPSS 21.0 (IBM Corp., Armonk, NY, USA) and SAS 9.4 (SAS Institute, Cary, NC, USA). All statistical tests were two-sided using a 5% significance level.
Results
The mean decrease in skin temperature during the cold provocation test was 6.7°C, being significantly larger for the January cohort (7.1°C) compared with the August cohort (6.3°C), (p < 0.01).
Within the cohorts, the conscripts showed quite different rewarming patterns. This is clearly demonstrated in which shows thermographic images of the entire dorsal aspect of the hands from T1 to T6 in three different recruits (a slow rewarmer, an intermediate rewarmer and a rapid rewarmer) from the August cohort.
Figure 2. An example of the DIRT examinations in three individual recruits from the August cohort (a rapid rewarmer – top row; an intermediate rewarmer – middle row and a slow rewarmer – lower row). The distribution of these three different rewarming patterns are in per cent (%) of the August cohort, n = 120. The thermographic images were obtained from six different time points: one before (T1) and one immediately after the cold challenge (T2) and thereafter at 1-min intervals during the 4-min spontaneous rewarming period (T3–T6).
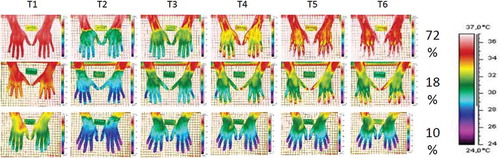
In the August cohort, 72% showed complete rewarming within 4 min (rapid rewarmer). An intermediate rewarming pattern was found in 18% of the conscripts where only part of the hands and fingers rewarmed to the T1 values. Ten per cent in this cohort did not return to their T1 values within the 4-min recovery phase. Similar findings were seen in the January cohort.
The difference in mean values in the different rewarming groups (slow, intermediate and rapid) is displayed in and shows trends with time and the distinction between the different rewarming classes. As shown in , there is a thermographic difference between slow, intermediate and rapid rewarmers at all time points of the DIRT procedure.
Figure 3. Mean finger skin temperature (±standard errors) according to time and groups of slow, intermediate and rapid rewarmers. The upper black line shows the profile of the rapid rewarmers (complete rewarming pattern), the middle blue line shows the intermediate rewarmers (partially rewarming pattern) and the lowest green line shows the results in the slow rewarming group (no or very little rewarming patterns).
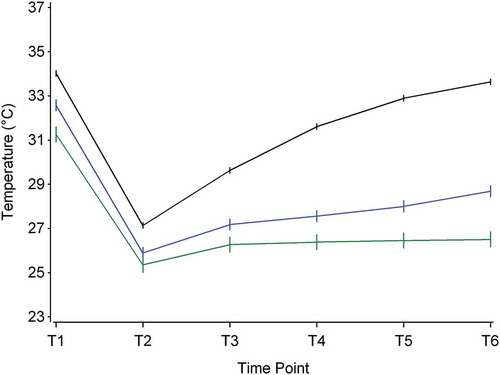
The rewarming ability, shown in the recovery phase (temperature at T6 minus temperature at T2), is calculated as the difference between skin temperature at T6 minus T2. Three rewarming groups were defined using percentiles of the rewarming variable as follows: Slow responders are those in the lowest 10th percentile, intermediate responders are those between the 10th and the 28th percentile and rapid responders are those above the 28th percentile.
We observed a significant difference in time trend between the groups, p < 0.0001. We also observed a significant difference between the groups within all the time points, except for time point T2 between slow and intermediate responders. For the other time points, trends of the means in temperature over time according to the three rewarming groups are displayed in .
Differences between August and January cohort
As shown in , the two cohorts differed somewhat in their subjective assessment regarding factors that may influence rewarming ability. For example, a previous cold injury was more often reported in the August cohort. In the January cohort, the conscripts more frequently reported profuse sweating. They also felt themselves less warm and assessed their body temperature to be colder compared to others, in contrast to the August cohort. No difference was found in self-reported episodes of white/blue fingers.
Table 2. Temperature-related factors and rewarming patterns in the two cohorts (n = 255).
The mean skin temperature values at our defined ROI in the August cohort were higher compared to the January cohort, both prior to and following the cold stress test (T1 and T2). The January cohort also had a lower mean skin temperature at T6. A statistically significant difference in mean skin temperature was found between the two cohorts, both at T2 and at T6. The August cohort was on average 2.1°C warmer at T2 and 3.2°C warmer at T6.
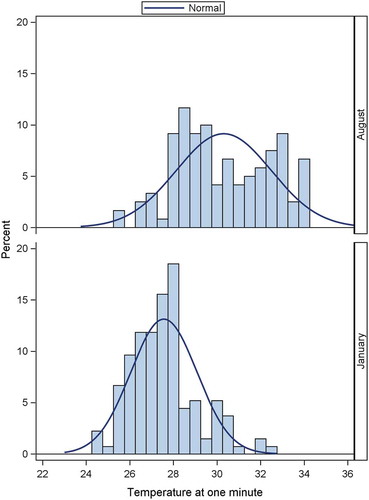
The rewarming patterns for the two cohorts were different throughout the recovery phase. This is clearly illustrated from the differences of the rewarming profiles shown in assessed 1 min after the cold challenge (T3). shows that the rewarming profiles in the August cohort are more widely distributed compared to the January cohort. The mean value for the August cohort is significantly higher compared to the January cohort, 30.3 and 27.6, respectively, p < 0.001. There is also a significant larger variation in the August compared to the January cohort, SD = 2.2 and 1.5, respectively, p < 0.01.
Figure 4. Histogram of rewarming profiles in the August cohort (upper panel) and in the January cohort (lower panel) in early recovery phase at 1 min (=T3).
Factors associated with rewarming ability
shows the association between rewarming and socio-demographic variables, nicotine status and other personal characteristics, adjusted for cohort, and with and without adjustment for pre-cooling (T1). High BMI was associated with improved rewarming, but this was non-significant after adjustment for T1.
Table 3. Linear regression coefficients for changes in temperature (rewarming ability = difference between T6 and T2) as dependent variable (n = 255).
Nicotine use was significantly associated with improved rewarming regardless of adjustment for T1. Six conscripts stating they had episodic periods of white/blue fingers had better rewarming ability compared to others, but this was only significant after adjustment for pre-cool temperature.
Conscripts who assessed themselves as feeling colder than others were significantly associated with being slow rewarmers. This was only of borderline significance when adjusted for T1.
Discussion
The main finding of this study is the variability seen among healthy young army conscripts in their rewarming ability following a standardised mild cold provocation test. This finding was consistent in the August and January cohorts. Conscripts in both cohorts could be characterised as either slow, intermediate or rapid rewarmers. While 90% could recover, partially (intermediate) or completely (rapid), within 4 min to the skin temperature values before the provocation test, 10% clearly had a clearly delayed rewarming pattern.
Reports of higher mean skin temperature in the August cohort at T1, T2 and T6, and differences in rewarming pattern between the two cohorts and trends illustrated in Figure 4, all strongly suggest a seasonal effect.
The DIRT protocol used in this study is used to classify recruits into different rewarming patterns. Brandstrom et al. found that cold injury occurrence was dispropotionally higher in men that were slow rewarmers compared to normal rewarmers after 15 months of military training in a cold environment in northern Sweden [Citation20]. Our study identified slow rewarmers, which could be related to higher occurrence of frostbite in accordance with what was found in the Sweedish army.
Another interesting finding in our study was that smokers and users of smokeless tobacco (snuss) belonged to the group of rapid rewarmers. In fact, they had on average the most rapid rewarming of all. Intermittent use and abstinence from nicotine may have paradoxical physiological effects [Citation21]. Miland and Mercer reported in their study that a period of abstinence from smoking of a few hours may, in elderly, result in a more rapidly recovering from a cold challenge compared to their non-smoking counterparts [Citation22]. Nicotine is rapidly metabolised, with an elimination half-life of 2 h. In addition to acute effects, the history of smoking may also affect rewarming responses. Based on previous research, our protocol included a restraining from smoking or using smokeless tobacco at least 2 h before the DIRT examination.
In both cohorts, there were conscripts reporting episodic periods of white/blue fingers. The issue of periodically white fingers is very important from the perspective of vasospastic reactions and cold sensitivity. However, the analysis was performed excluding these very few conscripts, leaving the conclusions unchanged. One should bear in mind that this is subjective information from a limited number of conscripts (N = 6), and the content validity of the information is unknown. On the other hand, if the information was correct, and these few conscripts experienced a rapid rewarming, this unexpected finding cannot easily be explained.
The infrared thermographic methodology
The use of infrared thermography to assess skin temperature and thereby indirectly indicate skin blood perfusion status is widely used in clinical settings. However, no evidence-based, consensus guideline exists to address the methods for collecting data in such situations, and an inter- and intra-examiner variability has been questioned. We prepared the research venue carefully to maintain the ambient and experimental conditions as stable as possible. Our research seems to be in accordance with a Delphi-processed checklist among leading experts in thermography [Citation23].
In terms of producing a cold stress, numerous procedures have been used, ranging from cold water immersion or convective air cooling to the use of aerosol sprays. Our use of 20°C water and an immersion time of the gloved hand of 1 min resulted in lowering the skin-temperature of the fingers by on average 6.7°C. This cold challenge is in accordance with proposed standards when investigating vasoactive responses in fingers [Citation11,Citation19].
Using average temperature lines on the dorsum of the fingers as ROI serve as a stable and reproducible investigating strategy [Citation11], despite possible thermal asymmetry. The straight-line ROI of the fingers used in this study also covered the fingernail, which strictly speaking cannot be included as true skin temperature.
There is little information on emissivity values for human nails although there are studies that show human skin and nails have similar thermal diffusivity [Citation19,Citation24]. Since the temperature under the nailbed is greatly influenced by AVAs’ activity and is a crucial thermoregulatory element in the regulation of skin temperature [Citation25], it was decided to include the nail in the measurements.
The effect of seasonality, especially the large difference in the outside temperatures between the two cohorts, is difficult to assess and indeed may partly explain the differences in the rewarming profiles in the two cohorts (). We attempted to minimise this problem by ensuring that the conscripts at wintertime-enrolment (January cohort) stayed indoors prior to the 30-min pre-DIRT acclimatisation.
We performed data collection throughout the whole day and at the time of each DIRT examination, the time following eating a meal may have affected the results, although all had to follow the instructions regarding not drinking hot and cold beverages 2 h prior the examination. We were also unable to register or pay attention to the circadian, diurnal rhythm or menstrual cycles of female conscripts.
In DIRT, we used a heating plate that may contribute to the passive heating of the hands. Although this might have contributed to a more rapid rewarming, this was a constant factor for all conscripts.
We recognise that there is no unified method to classify rewarming capacity/ability, and our description of this phenomenon. Our selection was to define rewarming as the difference between end-rewarming (T6) and end-cooling (T2). In a pilot study, we found that one way of standardising the study subjects was when hands were immersed in 20°C water for 1 min. The variance of the T1 value was at least larger than what was found at end-cooling (T2). We therefore found it inappropriate to include the T1 value to define “successful” rewarming.
Our categorisation of three rewarming groups (slow, intermediate and rapid) is based on subjective impression. The descriptive nature of our data did not invite statistically to test differences in the distributions of subjects across these subjective categories. However, it could be discussed whether we have the basis to present an individual as either a rapid, intermediate or slow rewarmer, during a single DIRT test. And further retains these characteristics in subsequent testing? An alternative conclusion is that individuals who happen to have cold hands at the beginning of the DIRT protocol will not rewarm within 4 min.
Conclusions
Our study describes great variability in rewarming ability of the fingers after a standardised cold provocation test in a large cohort of young healthy army conscripts. The protocol used in this study made it possible to distinguish between slow, intermediate and rapid rewarmers. The majority of the conscripts showed a rapid recovery from cooling of the hands. In the slow rewarmers, the rewarming ability was correlated with a low average temperature of the hands prior to the cooling test.
Disclosure statement
No potential conflict of interest was reported by the authors.
Additional information
Funding
References
- Lehmuskallio E, Lindholm H, Koskenvuo K, et al. Frostbite of the face and ears: epidemiological study of risk factors in Finnish conscripts. BMJ. 1995;311(7021):1661–10.
- Ervasti O, Juopperi K, Kettunen P, et al. The occurrence of frostbite and its risk factors in young men. Int J Circumpolar Health. 2004;63(1):71–80.
- Castellani JW. American College of sports medicine position stand: prevention of cold injuries during exercise. Med Sci Sports Exerc. 2006;38(11):2012–2029.
- Rintamaki H. Predisposing factors and prevention of frostbite. Int J Circumpolar Health. 2000;59(2):114–121.
- Imray C, Grieve A, Dhillon S. Cold damage to the extremities: frostbite and non-freezing cold injuries. Postgrad Med J. 2009;85(1007):481–488.
- Cheung SS, Daanen H. Dynamic adaptation of the peripheral circulation to cold exposure. Microcirculation. 2012;19(1):65–77.
- Daanen H. Finger cold-induced vasodilation: a review. Eur J Appl Physiol. 2003;89(5):411–426.
- de Weerd L, Mercer JB, Weum S. Dynamic infrared thermography. Clin Plast Surg. 2011;38(2):277–292.
- Stikbakke E. An infrared thermographic and laser doppler flowmetric investigation of skin perfusion in the forearm and finger tip: following a short period of vascular stasis. Tromsø (Norway): Universitetet i Tromsø; 2010.
- Pauling J. Use of infrared thermography as an endpoint in therapeutic trials of Raynaud’s phenomenon and systemic sclerosis. Clin Exp Rheumatology-Incl Supplements. 2012;30(2):S103.
- Ring EF, Ammer K. Infrared thermal imaging in medicine. Physiol Meas. 2012;33(3):R33–R46.
- Ammer K. Diagnosis of Raynaud’s phenomenon by thermography. Skin Res Technol. 1996;2(4):182–185.
- Merla A, Di Donato L, Di Luzio S, et al. Infrared functional imaging applied to Raynaud’s phenomenon. IEEE Eng Med Biol Mag. 2002;21(6):73–79.
- Brandstrom H, Wiklund U, Karlsson M, et al. Autonomic nerve system responses for normal and slow rewarmers after hand cold provocation: effects of long-term cold climate training. Int Arch Occup Environ Health. 2013;86(3):357–365.
- Forsvaret. Rekruttperioden [Norwegian). 2014 [cited 2018 Jun 4]; Available from: https://forsvaret.no/karriere/forstegangstjeneste/rekruttskole.
- Forsvaret. Panserbataljon [Norwegian). 2014 [cited 2018 Jun 4]; Available from: https://forsvaret.no/karriere/forstegangstjeneste/muligheter/haren/panserbataljonen.
- Grøtvedt L Smoking and snus use in Norway 2017 [cited 2017 Jan 11]; Available from: https://www.fhi.no/en/op/public-health-report-2014/risk–protective-factors/royking-og-snusbruk-i-noreg/.
- Hoiland II, de Weerd L, Mercer JB. The effect of oral uptake of nicotine in snus on peripheral skin blood circulation evaluated by thermography. Temperature (Austin). 2014;1(3):220–226.
- Ammer K. Cold challenge to provoke a vasospastic reaction in fingers determined by temperature measurements: a systematic review. Thermol Int. 2009;19(4):109–118.
- Brandstrom H, Grip H, Hallberg P, et al. Hand cold recovery responses before and after 15 months of military training in a cold climate. Aviat Space Environ Med. 2008;79(9):904–908.
- Yun AJ, Bazar KA, Lee PY, et al. The smoking gun: many conditions associated with tobacco exposure may be attributable to paradoxical compensatory autonomic responses to nicotine. Med Hypotheses. 2005;64(6):1073–1079.
- Miland AO, Mercer JB. Effect of a short period of abstinence from smoking on rewarming patterns of the hands following local cooling. Eur J Appl Physiol. 2006;98(2):161–168.
- Moreira DG. Thermographic imaging in sports and exercise medicine: a Delphi study and consensus statement on the measurement of human skin temperature. J Therm Biol. 2017;69:155–162.
- Dias DT. Thermal characterization in vitro of human nail: photoacoustic study of the aging process. Photochem Photobiol. 2007;83(5):1144–1148.
- Walloe L. Arterio-venous anastomoses in the human skin and their role in temperature control. Temperature (Austin). 2016;3(1):92–103.