
ABSTRACT
We investigated the availability of health system performance indicator data in Canada’s 18 northern regions and the feasibility of using the performance framework developed by the Canadian Institute for Health Information [CIHI]. We examined the variation in 24 indicators across regions and factors that might explain such variation. The 18 regions vary in population size and various measures of socioeconomic status, health-care delivery, and health status. The worst performing health systems generally include Nunavut and the northern regions of Québec, Manitoba and Saskatchewan where indigenous people constitute the overwhelming majority of the population, ranging from 70% to 90%, and where they also fare worst in terms of adverse social determinants. All northern regions perform worse than Canada nationally in hospitalisations for ambulatory care sensitive conditions and potentially avoidable mortality. Population size, socioeconomic status, degree of urbanisation and proportion of Aboriginal people in the population are all associated with performance. The North is far from homogenous. Inter-regional variation demands further investigation. The more intermediate pathways, especially between health system inputs, outputs and outcomes, are largely unexplored. Improvement of health system performance for northern and remote regions will require the engagement of indigenous leadership, communities and patient representatives.
Introduction
Much has been written about health disparities between the Canadian North and the rest of Canada, and within the North, between its indigenous and non-indigenous populations [Citation1,Citation2]. Such discussions have largely been focussed on the three northern territories of Yukon, Northwest Territories [NWT] and Nunavut, as health and other data are more readily available at the provincial/territorial than the sub-provincial level. Moreover, the study of health systems performance has been lagging in Canada’s northern and remote regions.
Objectives
We conducted a study to investigate the availability of health system performance indicator data for the three territories and the northernmost regions of the provinces, and the feasibility of using the performance framework developed by the Canadian Institute for Health Information [Citation3] to compare them. Using the limited data available, we examined variation in different indicators across these regions and factors that might explain such variation. Performance frameworks and related data are needed to inform the management and improvement of health services in northern regions in Canada.
Background
What constitutes the north for health services in Canada?
The three northern territories have often been collectively referred to as the “territorial North”, or “North of 60”, referring to the 60° N latitude that serves as its southern boundary, although it cuts across northern Québec. The “provincial North” encompasses the northernmost regions of British Columbia, Alberta, Saskatchewan, Manitoba, Ontario, Québec, and Newfoundland and Labrador. Indigenous groups also define northern regions according to cultural connections and land claim settlements. For example, the Inuit refers to their traditional homeland as Inuit Nunangat (the place where Inuit live), which spans across two territories and two provinces. Northern health services are provided within the mandate of territorial governments, and within provinces, they are provided primarily by regional health authorities, with some programmes delivered by indigenous governments and also the federal government.
For the purpose of this article, we include both the territorial and provincial north in our definition of North. This vast area shares some context including rapidly changing climates, remote geographies and populations, and significant indigenous populations and lands. Descriptions of health services experiences related to national responses to these northern characteristics have been previously published [Citation4]. Health system responses include adaptations through decentralisation, use of telehealth and other technologies, human resource incentives, and programming that is responsive to indigenous values and priorities. However, to-date little attention has been paid to identifying frameworks and indicators that contribute to the measurements of health system performance in Canada’s northern regions.
How is health system performance assessed?
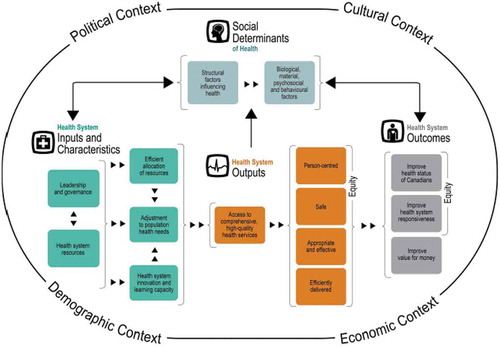
Health systems performance measurement is an important policy competency for improving the performance of health systems and can provide some direction in responding to system challenges. Performance measurement tools also provide a mechanism for establishing health system accountability and improvement. A number of potential tools have been developed to assess health system performance [Citation5–Citation7]. For this paper, we use the performance framework developed by the Canadian Institute for Health Information [Citation3], which was developed to be a unifying pan-Canadian framework and takes into account the health strategies in the provinces and territories [].
The framework operates within a political, cultural, demographic and economic context and comprises four interrelated “quadrants”: (1) social determinants of health; (2) health system inputs and characteristics; (3) health system outputs; and (4) health system outcomes. Within each quadrant are performance dimensions. An assessment of how well the health system achieves its intermediate and ultimate goals must consider all performance dimensions and contextual elements included in the framework [Citation3].
Social (or non-medical) determinants of health represent factors outside the health-care system that influence the health of a population. CIHI subdivides such factors into “structural” ones, referring to socioeconomic conditions, and “intermediary” ones which include biological, material, psychological, and behavioural factors which are individual-based [Citation3].
Health system inputs and characteristics encompass governance and leadership, the availability, equitable distribution and efficient allocation of resources, the ability to adjust and adapt to meet population health needs, and the capacity for innovation and learning [Citation3].
Health system outputs are the immediate results of activities undertaken by the health system. These include providing access to comprehensive, high-quality care that is safe, person-centred, appropriate and effective [Citation3].
Health system outcomes refer to the ultimate goals of the health system to improve the level and distribution of health in the population, be responsive to the needs and demands of the population, and produce value for money. Achieving equity is an important measure of both health system outputs and outcomes [Citation3].
Figure 1. Health system performance measurement framework of the Canadian institute for health information
Methods and data sources
We identified 18 health regions in the three territories and seven provinces as “northern”, based on the 2015 boundaries defined by Statistics Canada [ and ]. Maps and full documentation on these regions are available from Statistics Canada [Citation8,Citation9]. In Ontario, the health regions are public health units; in Québec, they are the régions sociosanitaires. Additional information regarding some of the health regions can be found in the footnotes for .
Figure 2. Map of 18 northern regions in 3 territories and 7 provinces
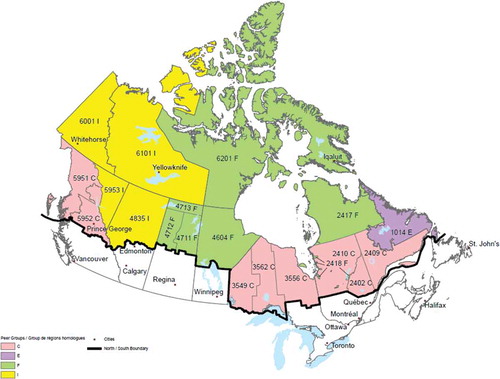
Table 1. List of 18 northern health regions and selected contextual characteristics
We compared health regions based on data included in Statistics Canada’s compendium of health indicators, periodically updated [Citation10]. The indicators are derived from the census, health surveys (particularly the Canadian Community Health Survey, or CCHS), vital statistics, and health-care administrative databases. The last-named data source originates from the Canadian Institute for Health Information, accessible through its health indicators interactive tool [Citation11], while the rest are all from Statistics Canada, available from its socioeconomic database CANSIM. Definitions of the indicators and sources of the data are available from CIHI’s indicatory library [Citation12].
Statistics Canada [Citation9] developed an algorithm to group Canada’s health regions into “peer groups”, identified by letters A through J. They share similar geographical and sociodemographic characteristics and can be considered a summary measure of the social determinants of health. Health outcomes were intentionally not used in the construction of these peer groups. The 18 northern regions fall into four of these peer groups – C, E, F, and I [].
In selecting health indicators for analysis and presentation, we used the following criteria:
Data are available for at least 16 of the 18 northern regions;
Data are available for at least 1 year within the 5-year period of 2010–14; and
Data refer to the health region of residence and not where the services are actually provided.
We excluded indicators based on single diagnoses or surgical procedures but chose those based on broad groupings of disease conditions or reasons for hospitalisations. For hospital use indicators, there is no standard to determine whether the hospitalisation rate for a particular condition is “good” or “bad”, whereas the 30-day readmission rate is more indicative of performance. We also did not consider indicators of mental health and long-term care, as such services across the North is a topic of major concern and requires its own special study.
The three small northern Saskatchewan regional health authorities have been combined into one Mamawetin-Keewatin-Athabasca region (abbreviated as Ma-Ke-At) for reporting purposes by Statistics Canada. However, CIHI presented data for the three regions separately. We calculated weighted means for the combined northern Saskatchewan region based on the population distribution among the three regions.
Descriptive statistical data were summarised and presented in tables and graphs. For each indicator, we provided the mean value for the 5-year period. For census-based indicators, we computed the mean of the 2011 and 2016 censuses to represent the 2010–2014 period. Earlier trend data are not consistently available due to boundary changes over time. No attempts were made to combine two or more indicators into composite indices.
Unless specified, all rates and proportions are crude, i.e. not adjusted or standardised. When age-standardised rates are reported, the 2011 Canadian population was the standard population used. Some rates were risk-adjusted, based on logistic regression modelling performed by CIHI – further information is available from CIHI’s General Methodology Notes [Citation13].
Results
A total of 24 indicators were selected. We organised our results according to the CIHI framework. Not all performance dimensions within the four quadrants have measurable indicators, and not all indicators are available at the level of health regions. lists the health regions and several key contextual variables. presents indicators from each of the four “quadrants”, with the regions grouped according to peer groups. We moved Labrador [peer group E] with regions in peer group I. Statistics Canada considers Labrador more similar to other Atlantic Canada regions, which belong to peer group E, than the North.
Table 2. Comparison of health system performance indicators among 18 health regions based on the CIHI framework
Political, demographic, cultural and economic context
The territorial and provincial “Norths” share many characteristics but also have important differences, the most important of which is their constitutional and fiscal status within the Canadian federation, which affects how public services are organised, financed and delivered. As administrative units originally established by the federal government, the territories lack the constitutional recognition of provinces. In addition, territorial own-source government revenues make up only a small minority of needed government revenues making territorial governments far more reliant on federal government transfers than even the lowest-income provinces when it comes to financing health care and other public services.
The 18 regions vary considerably in terms of population size, ranging from about 430,000 in Alberta’s North Zone to about 13,000 in Québec’s Nunavik region. The great majority of the 18 regions consist of small population centres, with the exception of Saguenay region in Québec and the Thunder Bay District in Ontario where there are census metropolitan areas with population exceeding 100,000. Thirteen of the 18 regions contain no population centres greater than 30,000 inhabitants [].
Indigenous people constitute in aggregate just under 25% of the total population of the 18 regions. They constitute >85% of the population of Baie-James and Nunavik regions in Québec, Nunavut, and northern Saskatchewan; between 50% and 70% in NWT and northern Manitoba; and between 20% and 35% in Yukon, Northwestern Ontario, Northwest BC, and Labrador. Only two regions – Saguenay and Nord-du-Québec – have fewer than 5% of their population indigenous.
Cultural and ethnic diversity other than the indigenous population is low across the 18 regions. In terms of the proportion of immigrants, all are substantially lower than the 20% in Canada nationally.
The strength of the regional economy can be gauged by the gross domestic product [GDP]. However, Statistics Canada computes GDP only for the provinces and territories but not sub-provincial regions. The three territories have a higher per capita GDP than that of Canada as a whole, with Yukon having 1.4 times, NWT 2.0 times and Nunavut 1.2 times that of Canada [Citation14]. This is likely the result of the higher volume and cost of activity associated with transporting goods, services and people in remote areas, high employment in the natural resources extraction industries and the higher proportion of the population working in the government service sector. Northern regions in the provinces with similar economies can be expected to have higher per capita GDP than national average.
Social determinants of health
Data are available for three structural determinants – education, employment and personal income. The five peer group F regions (Nunavik, Baie-James, northern Manitoba, northern Saskatchewan and Nunavut) ranked the lowest in terms of employment rate and the proportion of adults aged 25–54 with postsecondary education. With the exception of Nunavut, four of these regions also report the lowest annual personal income. Income in Nunavut and four other regions – NWT, northern Alberta, Yukon, and Northeast BC – actually exceed that for Canada at a whole. However, we do not have data relating to income distribution or inequality within the regions. Saguenay is an anomaly in that it ranks highest in postsecondary education but is among the lowest quartile in terms of income [].
Data on health behaviours such as smoking, drinking, and physical activity are not available for Nunavik and Baie-James as they do not participate in the CCHS. It should be noted that leisure-time physical activity does not capture the total amount of physical activity as much of northern living, especially in remote villages, is physically demanding.
Health system inputs and characteristics
An important characteristic of northern health regions is the need for residents to obtain some or all of their secondary/tertiary hospital care outside the region. This is captured by the “inflow/outflow” ratio developed by CIHI. The ratio is computed by the number of hospital separations within the region [by residents and non-residents] divided by the separations by residents within and outside the region. For ratios <1, the smaller it is, the larger the outflow; ratios >1 indicate an inflow effect. From it is clear that the two most urbanised regions (Saguenay and Thunder Bay) have ratios close to one, whereas for most other regions outflow exceeds inflow []. Note that CIHI puts this indicator under the “person-centred” dimension within the health system output quadrant, but we consider it a defining characteristics of northern health regions [Citation12]. It is through this lens that all hospital care-based indicators must be interpreted.
The availability of health-care resources, such as workforce, financing, and facilities are not that easily assessed for the northern regions. Headcounts do not reflect true human resources availability, especially in the more remote regions which rely on short-term locums for staffing. The data available for physicians, incomplete as they are, show that peer group C regions all have family physician supply greater than the national average. As expected, more remote regions in peer group I and F have lower density of family physicians, except the two predominantly indigenous regions in northern Québec, which have twice the ratio as in Canada, perhaps a reflection of that province’s physician-based model of primary care services encompassing its northernmost regions.
CIHI’s annual report on national health expenditures provides data for the three territories but not sub-provincial regions. In 2017, the per capita total health expenditures in the Yukon, NWT and Nunavut were 1.8, 3.0 and 2.7 times that of Canada as a whole [Citation15].
Health system outputs
Indicators based on hospital utilisation can be used to assess the performance of both primary care and in-hospital care. For the former we used the hospitalisation rate for ambulatory care sensitive conditions (ACSC) and for the latter, we selected the 30-day readmission rates for medical surgical, obstetric and paediatric patients.
ACSCs are hospital diagnoses that should not occur if there is access to appropriate primary care services in a region, examples include diabetic coma or ketoacidosis, unstable angina, asthma, uncontrolled seizures, etc. [Citation12].
Figure 3. Ranking of age-standardised hospitalisation rates for ambulatory care sensitive conditions among the 18 northern regions
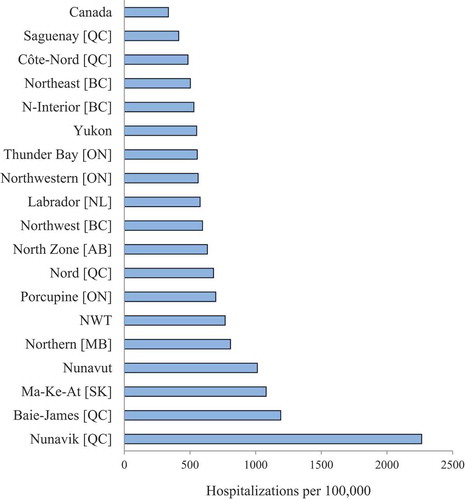
As shows, all 18 northern regions have ACSC rates higher than that of Canada as a whole, with Nunavut reporting the worst rate, about 7 times that of the Canadian average.
The situation is less clear-cut for the readmission rates. Of note is that peer group F regions perform well in obstetrical care but less so in surgical care.
Health system outcomes
Perceived health derived from surveys is often used as an overall measure. NWT, Nunavut and northern Manitoba and Saskatchewan fared the worst. No data were available from Nunavik and Baie-James.
The hospitalisation rates for acute myocardial infarction (AMI) and injuries are used as estimates of the incidence of these conditions rather than their management. Chronic diseases are emerging health problems in the indigenous populations and regions with a high proportion of indigenous people report high rate of AMI hospitalisation.
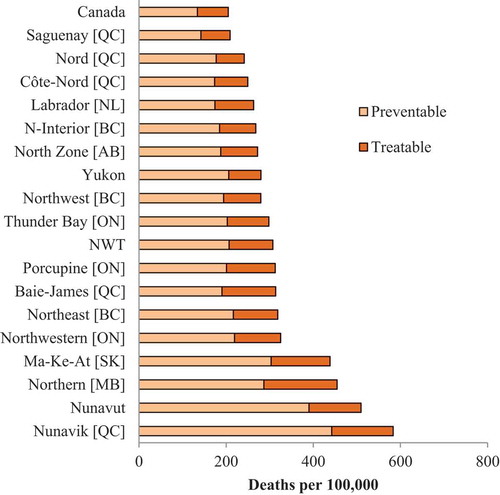
Potentially avoidable mortality rate (PAM) can serve as an overall indicator of health outcome. It captures untimely death before age 75 that should not occur in the presence of timely and effective health care, either through prevention or treatment. The list of avoidable conditions is determined by expert panels. Preventable deaths include those due to vaccine-preventable diseases, sexually transmitted diseases, rheumatic heart disease, nutritional deficiencies, transport accidents, medical errors, etc. Avoidable deaths that are treatable include tuberculosis, meningitis, some cancers, hypertension, respiratory infections, maternal death, poisoning, etc.
As with ACSC, all 18 northern regions fare worse than Canada as a whole, with the poorest performance in Nunavik, Nunavut, and northern Manitoba and Saskatchewan. The three predominantly non-indigenous northern Québec regions of Saguenay, Côte-Nord and Nord-du-Québec perform the best [].
Figure 4. Ranking of age-standardised rates of potentially avoidable deaths from treatable or preventable causes among the 18 northern regions
The two indicators ACSC and PAM are themselves highly correlated (r = 0.84) among the 18 regions.
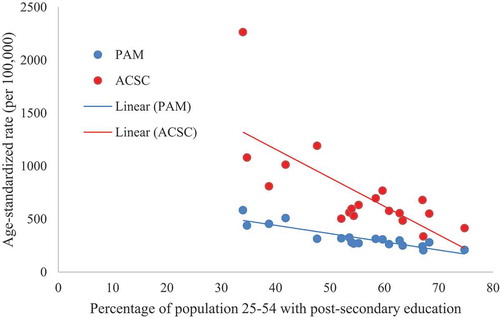
In general, larger regions, especially the more urbanised ones, have better health system outputs and outcomes. The strong influence of socioeconomic conditions is evident from . Regions with higher level of attained education performed better in terms of PAM and ACSC, with correlation coefficients r of 0.89 and 0.73, respectively. Similar relationships were observed between employment and PAM (r = 0.72) and ACSC (r = 0.52). The correlation with income was less strong (r = 0.3 for both PAM and ACSC), the result of the anomaly of Nunavut having a higher than expected average income, and Saguenay among the group with the lowest income.
Figure 5. Correlation of proportion of population with postsecondary education with rates of ambulatory care sensitive conditions (ACSC) and potentially avoidable mortality (PAM)
Discussion
We have made a first attempt to investigate the availability of health system indicators and performance data for the three territories and the northernmost regions of the provinces in Canada, and compare these regions using the CIHI performance framework. These objectives have largely been met. Much work, however, remains to be done. Within the suite of indicators used to measure health systems performance in Canada, data are not consistently available for the northern regions. There is a need to address gaps in indicator availability and support northern and remote regions in performance measurement initiatives.
A large number of health system performance indicators are available from CIHI and Statistics Canada. However, certain quadrants and dimensions in the CIHI framework lack measurable indicators, for example, such health system attributes as leadership, governance, innovation, and efficient allocation of resources. The great majority of indicators fall within the health system outputs quadrant. Health status indicators predominate in the health system outcomes quadrant, but few in terms of responsiveness or value-for-money. Clearly, the framework is not yet fully functional to serve the planning, evaluation and management needs of health system stewards.
From a limited set of available indicators, we were able to demonstrate substantial variation across northern regions. The North is far from homogenous. The worst performing health systems correspond to Statistics Canada’s peer group F of health regions, comprising of Nunavut and the northern regions of Québec, Manitoba and Saskatchewan where indigenous people constitute the overwhelming majority of the population, ranging from 70% to 90%, and where they also fare worst in terms of the prevalence of adverse social determinants.
The differences among regions demand further investigation. This article is primarily descriptive and does not address causal relationships, and future research should investigate such linkages. The impact of social determinants on health outcomes has been firmly established in the literature, but the more intermediate pathways, especially between health system inputs, outputs and outcomes, remain largely unexplored.
Although we avoided statistical modelling to create summary indices for different quadrants and dimensions of the framework, PAM and ASCS hold promise as “overall” health system performance indicators that could isolate the quality and timeliness of health-care interventions. We have also shown them to be strongly correlated with social determinants of health which support the understanding that sectors outside health influence aspects of health systems performance.
Provincial/territorial policymakers and regional health authorities should be reminded that we have deliberately selected indicators based on the regions of residence and not regions of service, a choice that is supported by the significant outflow of patients in many regions. Thus, many users are “exposed” to the performance of health-care facilities and systems outside their own jurisdictions, and thus beyond the control of the “home” ministries or health authorities. If we are interested in improving health and health care for northerners; then, it is not a matter only of improving the health systems within the North, but a pan-Canadian effort is required.
If a health system performance framework is to be developed, and uniquely adapted to northern conditions, it must include the engagement of indigenous leadership and partners, given the significant proportion of indigenous people in many of the regions. There is a need to expand the framework and develop performance indicators that are based on indigenous values [Citation16].
Heterogeneity exists not just across regions, but also within regions, especially those with substantial urban populations. While many communities within the 18 regions are small in size and scattered over a large geographical expanse, there are also medium to large urban centres. There are in reality two models of health-care delivery within these regions, one that is urban-based and not very different from that which exists in much of metropolitan Canada, and the other is more distinctly “northern” and “remote”. The latter system is characterised by the extensive use of non-physician providers (primarily nurses and community health workers) in primary care and a heavy reliance on medical transportation and various systems of audio and visual communications.
Although regions such as Thunder Bay and Northern Interior BC perform well in many indicators, it is quite possible that remote First Nations communities within these regions may collectively be more similar to peer group F regions. As the home addresses of health-care users can be coded to the census subdivision level, it is theoretically possible to separate out data for residents of the large cities within some health regions, thus providing a more accurate picture of the experience of residents of small population centres.
The CIHI framework and indicators suite are valuable tools for regional management and national and international comparisons. The CIHI framework was not designed specifically within a northern Canadian context and needs to be adapted and expanded to incorporate important elements unique to northern regions. These include aspects of health systems design that respond to indigenous values, serve the needs of widely scattered, small remote communities, and recognise the overwhelming impact of social determinants.
Disclosure statement
No potential conflict of interest was reported by the authors.
Additional information
Funding
References
- Young TK, Chatwood S, Marchildon GP. Health care in Canada’s North: are we getting value for money?. Healthcare Policy. 2016;12(1):59–10.
- Young TK, Chatwood S. Delivering more equitable primary health care in northern Canada. Can Med Assoc J. 2017;189:E1377–8.
- Canadian Institute for Health Information. A performance measurement framework for the Canadian health system. Ottawa: CIHI, 2013. cited 2019 Jul 27. Available from: https://secure.cihi.ca/free_products/HSP_Framework_Technical_Report_EN.pdf
- Young TK, Marchildon GP, eds. A comparative review of circumpolar health systems. Int J Circumpolar Health. 2012;71(sup 9):1–116. .
- Braithwaite J, Hibbert P, Blakely B, et al. Health system frameworks and performance indicators in eight countries: A comparative international analysis. SAGE Open Med. 2017;5:1–10.
- Klassen AN, Miller A, Anderson N, et al. Performance measurement and improvement frameworks in health, education and social services systems: A systematic review. Int J Qual Health Care. 2010;22:44–69.
- Arah OA, Klazinga NS, Delnoij DM, et al. Conceptual frameworks for health systems performance: A quest for effectiveness, quality, and improvement. Int J Qual Health Care. 2003;15:377–398.
- Statistics Canada. Health regions: boundaries and correspondence with census geography. [Released 2015-12-16]. Ottawa: Statistics Canada, 2015. cited 2019 Jul 27. Available from: http://www.statcan.gc.ca/pub/82-402-x/82-402-x2015002-eng.htm
- Statistics Canada. Health region (2014) peer groups – working paper. Ottawa: Statistics Canada, 2015. [Modified 2015-12-16]. cited 2019 Jul 27. Available from: http://www.statcan.gc.ca/pub/82-402-x/2015002/wp-dt/wp-dt-eng.htm
- Statistics Canada. Health indicators: data tables and definitions. Ottawa: Statistics Canada, 2018. [Updated 2018-05-31]. cited 2019 Jul 27. Available from: http://www.statcan.gc.ca/pub/82-221-x/2017003/dd-tdd-eng.htm
- Canadian Institute for Health Information. Health indicators interactive tool [Vintage: 2016-02]. Ottawa: CIHI, 2016. cited 2019 Jul 27. Available from: https://yourhealthsystem.cihi.ca/epub/?language=en
- Canadian Institute for Health Information. Health indicator library. Ottawa: CIHI, 2017. cited 2019 Jul 27. Available from: http://indicatorlibrary.cihi.ca/display/HSPIL/Indicator+Library
- Canadian Institute for Health Information. Indicator library: general methodological notes – clinical indicators. Ottawa: CIHI, 2018.
- Statistics Canada. Table 36- 10-0222-01:gross domestic product, expenditure-based, provincial and territorial, annual (x 1,000,000). Ottawa: Statistics Canada, 2019. [Modified 2019-07-27]. cited 2019 Jul 27. Available from: https://www150.statcan.gc.ca/t1/tbl1/en/tv.action?pid=3610022201
- Canadian Institute for Health Information. National health expenditure trends, 1975-2017. Health spending data tables. Table F.1.1.2 Ottawa: CIHI, 2017. cited 2019 Jul 27. Available from: https://www.cihi.ca/en/national-health-expenditure-trends#data-tables
- Chatwood S, Paulette F, Baker GR, et al. Indigenous values and health system stewardship in circumpolar countries. Int J Environ Res Public Health. 2017;14:1462.