
ABSTRACT
Biomonitoring for heavy metals is important to assess health risks, especially in Arctic communities where rural residents rely on locally harvested foods. However, laboratory testing for blood contaminants is expensive and might not be sustainable for long-term monitoring. We assessed whether pooled specimen biomonitoring could be a part of a plan for blood contaminant surveillance among pregnant women in rural Alaska using existing blood mercury level data from three cross sectional studies of pregnant women. We applied a hypothetical pooled specimen template stratified into 8 demographic groups based on age, coastal or inland residence, and pre-pregnancy weight. The hypothetical geometric mean blood mercury levels were similar to the individual-level geometric means. However, the 95% confidence intervals were much wider for the hypothetical geometric means compared to the true geometric means. Although the variability that resulted from pooling specimens using a small sample made it difficult to compare demographic groups to each other, pooled specimen results could be an accurate reflection of the population burden of mercury contamination in the Arctic in the context of large numbers of biomonitoring samples.
KEYWORDS:
Introduction
The wellbeing of rural residents of the Arctic depends on a healthy environment and access to nutritious, safe, traditional foods. However, as cultural and environmental changes influence Arctic communities, contaminants such as heavy metals represent a threat to food safety and health. Heavy metals have been identified in various ecosystems, as well as in subsistence foods including whale, seal, and salmon [Citation1–Citation3]. Accumulation of these contaminants could result in compromised food supply.
Heavy metal exposure is associated with immediate and long-term health risks across the lifespan [Citation4–Citation8]. Acute exposure to methylmercury through fish consumption can result in symptoms consistent with neurological and psychiatric impairment [Citation9]. Prior work in Alaska and other Arctic settings showed positive correlations between environmental contaminants in umbilical cord and maternal blood samples, suggesting transplacental transfer of these compounds [Citation10,Citation11]. Foetuses are particularly vulnerable to contaminant exposure due to the disruption of developmental processes [Citation12–Citation14]. Mercury exposure can induce fetotoxic effects, such as spontaneous abortion, stillbirth, and low birth weight [Citation15]. Furthermore, exposure to mercury during pregnancy can result in damage to a developing foetal brain at lower doses than those toxic to the mother; chronic, low-level prenatal mercury exposures have been associated with developmental delays [Citation4]. Although monitoring exposure to these contaminants is important to protect the population against health risks, laboratory tests for these analytes are expensive and continuous monitoring may not be sustainable.
Recently, pooled specimen monitoring, a technique which can cost as little as one tenth the cost of standard epidemiologic methods, has become common in biomonitoring programmes [Citation16–Citation20]. Pooled specimen monitoring entails combining blood specimens into a single sample, which can overcome two primary obstacles in long-term biomonitoring programs [Citation16]. First, pooling specimens can overcome issues with low specimen volume in individual specimens [Citation21]. Second, the analyte value of the pooled sample reflects the average analyte value of the individuals included in the pool. Thus, pooling of samples can minimise laboratory testing costs while providing representative population-based estimates [Citation16]. National pooled specimen biomonitoring programs have been initiated in the USA, Canada, Spain, Belgium, Australia, Germany, South Africa, Guinea-Bissau, and New Zealand [Citation16,Citation19,Citation20,Citation22–Citation25]. However, it is not clear whether pooled specimen biomonitoring would be an appropriate approach for monitoring contaminants in Arctic settings.
In Alaska, three individual-level, cross-sectional biomonitoring studies of blood contaminants were conducted among pregnant women in the Yukon-Kuskokwim (YK) Delta between 2000 and 2012 as part of the Maternal Organics Monitoring Study (MOMS). To determine whether pooled specimen monitoring could be an appropriate method to reduce costs in Arctic settings, we analysed existing mercury data from these studies according to a pooled specimen template and compared the results with traditional, individual-level analysis. We compared the geometric mean estimates, demographic group comparisons, and trends over time that resulted from each method. The goal was to assess whether pooled specimen biomonitoring could be a part of a long-term sustainable surveillance plan for blood contaminants among pregnant women in rural Alaska.
Methods
Maternal organics monitoring study (MOMS) methods
From 1998–2014, the Alaska Native Tribal Health Consortium, funded by the USA Environmental Protection Agency, enrolled three cohorts of the MOMS contaminant evaluation study [Citation26]. MOMS was designed to observe the levels and effects of heavy metals, Persistent Organic Pollutants, and other anthropogenic pollutants in mothers and their infants residing in the YK Delta. Pregnant Alaska Native women from the YK Delta were recruited from the YK Delta Regional Hospital (YKDRH) in Bethel, Alaska, during their first prenatal visit between 1999 and 2003 (n = 106; Cohort 1), 2004 and 2006 (n = 206; Cohort 2) and 2009 and 2012 (n = 156; Cohort 3). Because YKDRH serves as a hub healthcare facility, women recruited for this study represented many rural communities in the YK delta. Only pregnant women were included due to the potential effects of pollutants on foetal development. Women interested in participating in the study signed consent forms prior to enrolment, including consent to participate, and to collect, store, and analyse blood. The original study and the current analysis were both approved by the Alaska Area Institutional Review Board.
Although the MOM study collected laboratory results for several blood contaminants, we used blood mercury levels for the current analysis. We chose mercury because it is a contaminant of concern in the Arctic, results were available for all three cohorts, and the data followed an approximately log-normal distribution.
Pooled specimen analysis methods
We first pre-specified a template to reflect how specimens might be pooled according to demographic factors associated with blood mercury. For each of the three cohorts, we created 8 demographic groups (strata) according to maternal age, maternal pre-pregnancy weight, and maternal location of residence. Residence was defined as coastal if the participant lived within 25 miles of the coast, and inland if the participant lived 25 miles or further from the coast. These residences were divided because of differing levels of marine diet in coastal and inland communities [Citation27]. Maternal age and pre-pregnancy weight were divided into two categories based on the median age of participants (25 years) and median weight of participants (66 kilograms).
outlines the pre-specified pooling template. Ideally, at least 8 participants would have been recruited into each pool and at least 2 pools created per stratum [Citation16]. We applied the pre-specified template to the existing MOMS data to create hypothetical pools of results for blood mercury levels. Participants were only included if they had laboratory result values for the analyte and all demographic features (age, pre-pregnancy weight, and residence). The actual sample sizes available in the pre-existing data did not allow each pool to include exactly 8 participants, or each stratum to include more than two pools. If there were < 16 participants in a stratum, participants were randomly assigned to one of two pools. If there were ≥ 16 participants in a stratum, participants were randomly assigned to one of three pools. Thus, pool numbers and sizes varied based on the random allocation and how many participants were available in each stratum.
To represent a hypothetical laboratory result from a physically pooled specimen test, we calculated the arithmetic mean of blood mercury within pools within each stratum. We then calculated the mean for each stratum using the mean of the two or three pool means within the stratum. However, the appropriate measure of centrality for these log-normal data is the geometric mean, so we adjusted the arithmetic mean to represent the geometric mean. Using formulae developed by Caudill et al, we back-calculated the estimated stratum variance and geometric mean based on an adjustment of the arithmetic mean, weighted by the number of specimens in each pool [Citation16]. We calculated the stratum variance by first calculating the standard deviation of the strata using the range of weighted arithmetic mean values between pools [Citation28]. We then used weighted least squares to predict values of the standard deviation by regressing the natural log of the calculated standard deviation on the natural log of the weighted mean of each stratum. These predicted standard deviation values were used to calculate the stratum variance, which was used in the adjustment of the arithmetic mean.
For comparison to a traditional, individual-level biomonitoring programmes, we used standard calculations to obtain the arithmetic mean, geometric mean, and variability of individual-level data for each stratum (which we called the “true” geometric mean). We conducted a log-linear regression to determine individual-level associations between demographic factors and time (as marked by Cohort) and blood mercury levels. Regression was not conducted for hypothetical results. We compared the true results to the hypothetical results across geometric mean, trends over time, and the ability to compare demographic group means to each other using ANOVA and the Tukey range test to identify significantly different means.
Results
A total of 405 participants had sufficient data to be included in the analysis (97 from Cohort 1, 164 from Cohort 2, and 144 from Cohort 3). Strata included an average of 17 participants, ranging from 8 to 30 participants. Each stratum included either 2 or 3 pools. Sample sizes within pools ranged from 1 to 11, with the mean pool size of 5 participants in Cohort 1, 7 participants in Cohort 2, and 7 participants in Cohort 3. Although ideally each pool would have included 8 participants, 8 strata had under 6 participants per pool.
True geometric mean estimates
The true geometric mean blood mercury level ranged from 1.44 ug/l among younger, inland residents with higher pre-pregnancy weight, to 7.76ug/l among older coastal residents with lower pre-pregnancy weight (). Comparing demographic groups to each other, an ANOVA provided an F-value of 2.01 with a p-value of 0.0041. Using the Tukey range test, geometric means of older, lower pre-pregnancy weight women living on the coast during the first cohort were significantly different from younger, inland women of either weight group during the third cohort (p = 0.0123 and p = 0.0120, respectively). Using log-linear regression on individual-level data, blood mercury levels were higher with increasing age, coastal residence, and earlier cohort (year).
Table 1. Individual-level geometric means and hypothetically pooled estimated geometric means of blood mercury levels in ug/l, Maternal Organic Monitoring Study data, Alaska 2000–2010
Hypothetical geometric mean estimates
The hypothetical geometric mean blood mercury levels were very similar to the true geometric mean. The hypothetical geometric mean ranged from 1.36 ug/l among younger, inland residents with higher pre-pregnancy weight, to 7.26 ug/l among older coastal residents with lower pre-pregnancy weight (). The 95% confidence intervals were wider for the hypothetical geometric means than for the true geometric means. The ANOVA for these groups provided an F-value of 1.65 and a p-value of 0.0318. However, using these hypothetical geometric means, none of the individual strata were significantly different from each other using the Tukey range test.
Trends over time
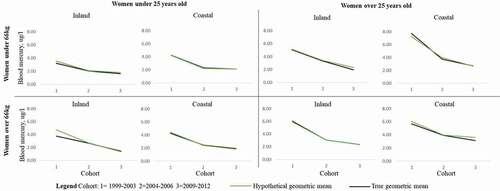
According to the true geometric mean, all groups showed a significant decline in blood mercury levels over time between Cohorts 1, 2, and 3 according to linear regression. The hypothetical geometric means showed close alignment with the true geometric mean and also suggested a trend towards decreasing blood mercury levels over time ().
Figure 1. Trends in blood mercury levels over time comparing individual and pooled geometric means, by demographic group, Maternal Organic Monitoring Study data, Alaska 2000–2010
Discussion
To determine whether a pooled specimen biomonitoring program would be appropriate in Alaska or other Arctic settings, we analysed existing data from three individual-level, cross-sectional biomonitoring studies of blood mercury. We found that we were unable to conduct the analysis using the ideal sample sizes per pool due to the overall sample sizes of the cohorts. Despite this, the geometric means from the hypothetical pooled template were similar to those derived from individual-level analysis. The standard deviation was larger in the hypothetical pooled analysis, and comparisons between demographic groups were not as robust as in the individual level analysis. This disparity likely resulted from the small sample sizes available. Despite these limitations, pooled specimen monitoring is a possible means to create sustainable biomonitoring programs in the Arctic.
The Food and Drug Administration recommends that pregnant women limit the amount of high-mercury fish consumed, which may have led to the decreases in geometric mean mercury observed over time in this study [Citation29]. The current reference dose of blood mercury level used by the US Environmental Protection Agency is 5.8ug/L [Citation30]. However, recently a lower benchmark level of 3.5 ug/L blood mercury has been proposed [Citation31]. According to an analysis of the National Health and Nutrition Examination Survey between 1999 and 2010 in the USA, women of child-bearing age living in coastal areas were estimated to have a geometric mean mercury level of 1.12 ug/L, while those living in inland areas had a geometric mean of 0.74 ug/L [Citation32]. Regardless of whether we used pooled-specimen analysis or individual-level analysis, the values estimated here were higher than the estimates from women throughout the rest of the USA and, in the earlier cohorts, many were above the reference levels. This is likely related to differences in exposure patterns, notably through marine food consumption in Alaskan populations. Using this broad view, pooled specimen testing could provide meaningful monitoring data to inform public health action.
Using the pre-specified template that we proposed in this analysis would have decreased the number of lab tests to run in the MOM study from 405 to 24, creating marked reductions in testing cost. Furthermore, the hypothetical geometric means aligned well with the true geometric means and showed the true decreasing trend over time. However, this analysis highlighted one primary issue with pooled specimen monitoring in the context of small sample sizes: it was difficult to accurately estimate the variance of the pooled specimen geometric means. This was because pooling specimens inherently decreases the number of specimens available from which to precisely calculate the geometric mean. Pooled specimen variance is estimated based on repeated pools within demographic groups, of which there were only 2 or 3 in each of our demographic strata. Because of small sample sizes in the original cohort, we were not able to create enough pools to precisely estimate variance, leading to confidence intervals which are difficult to interpret. Either a higher overall sample size or smaller numbers of demographic stratifications would have led to higher sample sizes within each stratum, which could improve the estimate of variance.
The difficulty in estimating variance led to one primary outcome: the confidence intervals for the hypothetical geometric means were wide. Therefore, the differences between demographic groups were not as easily parsed with the pooled specimen template as with the individual analysis. These effects on precision could influence targeting of public health programs for particular groups and locations by masking areas of high burden. However, broader public health action might not be hindered given the overall similarity of the geometric means to the individual-level analysis estimates.
This analysis is subject to a few limitations. First, there were many potential analytes that we could have assessed from the MOM study. We chose mercury to evaluate in this analysis because it was approximately log-normally distributed, results were available from all three cohorts, and it is a contaminant of concern in the Arctic. Although we believe that the results could be generalisable to other analytes that are monitored through blood testing, some analytes have statistical distributions that could lead to larger or smaller disparities between the true and estimated geometric means. Second, we were limited to using existing data, which prevented us from implementing the analysis with the ideal pooled specimen template. Potentially, future studies that use pooled specimen monitoring would not be subject to the same sample size limitations if they prospectively collect specimens according to their template. However, we believe that this shows the application of the template in a realistic Arctic setting. Similarly, this analysis shows how a pooled specimen template would be applied to serial, cross sectional data collection and might not be representative of other study designs.
Ultimately, pooled specimen biomonitoring is an option to decrease laboratory testing costs in the context of large numbers of biomonitoring samples. Overall, the estimates from the individual-level and the pooled specimen described here were similar enough to inform public health action. However, the precision of the estimates was influenced by the sample size of participants. Achieving high sample sizes may prove difficult to accomplish in the Arctic, where population sizes are small, communities are geographically isolated, and travel is expensive. Therefore, the decision to pursue pooled specimen monitoring will depend on the context of each jurisdiction. If specimens are readily available and individual level testing costs are high, public health practitioners working with Arctic communities could consider the possibility of pooled specimen biomonitoring to create sustainable, long term monitoring systems.
Disclaimer
The findings and conclusions in this report are those of the authors and do not necessarily represent the official position of the Centers for Disease Control and Prevention/the Agency for Toxic Substances and Disease Registry. Use of trade names is for identification only and does not imply endorsement by the Public Health Service or by the U.S. Department of Health and Human Services.
Disclosure statement
No potential conflict of interest was reported by the authors.
References
- Baker MR, Schindler DE, Holtgrieve GW, et al. Bioaccumulation and transport of contaminants: migrating sockeye salmon as vectors of mercury. Environ Sci Technol. 2009;43(23):8840–7.
- Hoguet J, Keller JM, Reiner JL, et al. Spatial and temporal trends of persistent organic pollutants and mercury in beluga whales (Delphinapterus leucas) from Alaska. Sci Total Environ. 2013;449:285–294.
- Correa L, Castellini JM, Quakenbush LT, et al. Mercury and selenium concentrations in skeletal muscle, liver, and regions of the heart and kidney in bearded seals from Alaska, USA. Environ Toxicol Chem. 2015;34(10):2403–2408.
- Taber KH, Hurley RA. Mercury exposure: effects across the lifespan. J Neuropsychiatry Clin Neurosci. 2008;20(4):iv–389.
- Hu XF, Laird BD, Chan HM. Mercury diminishes the cardiovascular protective effect of omega-3 polyunsaturated fatty acids in the modern diet of Inuit in Canada. Environ Res. 2017;152:470–477.
- Irwinda R, Wibowo N, Putri AS. The concentration of micronutrients and heavy metals in maternal serum, placenta, and cord blood: a cross-sectional study in preterm birth. J Pregnancy. 2019;2019:5062365.
- Jeppesen C, Valera B, Nielsen NO, et al. Association between whole blood mercury and glucose intolerance among adult Inuit in Greenland. Environ Res. 2015;143(Pt A):192–197.
- Van Hoomissen S, Gulland FM, Greig DJ, et al. Blood and hair mercury concentrations in the Pacific harbor seal (Phoca vitulina richardii) pup: associations with neurodevelopmental outcomes. EcoHealth. 2015;12(3):490–500.
- Ekino S, Susa M, Ninomiya T, et al. Minamata disease revisited: an update on the acute and chronic manifestations of methyl mercury poisoning. J Neurol Sci. 2007;262(1–2):131–144.
- Kostik M. Persistent organic pollutants, heavy metals and micronutrients in mothers and infants in rural Alaska: distributions and relationships. University of Alaska Anchorage, Alaska; 2014.
- Donaldson SG, Van Oostdam J, Tikhonov C, et al. Environmental contaminants and human health in the Canadian Arctic. Sci Total Environ. 2010;408(22):5165–5234.
- Ballester F, Iniguez C, Murcia M, et al. Prenatal exposure to mercury and longitudinally assessed fetal growth: relation and effect modifiers. Environ Res. 2018;160:97–106.
- Freire C, Amaya E, Gil F, et al. Placental metal concentrations and birth outcomes: the environment and childhood (INMA) project. Int J Hyg Environ Health. 2019;222:468–478.
- Jacobson JL, Muckle G, Ayotte P, et al. Relation of prenatal methylmercury exposure from environmental sources to childhood IQ. Environ Health Perspect. 2015;123(8):827–833.
- Rice KM, Walker EM Jr., Wu M, et al. Environmental mercury and its toxic effects. J Prev Med Public Health . 2014;47(2):74–83.
- Caudill SP. Characterizing populations of individuals using pooled samples. J Expo Sci Environ Epidemiol. 2010;20(1):29–37.
- Cerna M, Krskova A, Smid J, et al. Exposure and risk assessment of the Czech population to chlorinated pesticides and polychlorinated biphenyls using archived serum samples from the period 1970 to 1990. Int J Hyg Environ Health. 2016;219(4–5):443–453.
- Iszatt N, Stigum H, Verner MA, et al. Prenatal and postnatal exposure to persistent organic pollutants and infant growth: a pooled analysis of seven european birth cohorts. Environ Health Perspect. 2015;123(7):730–736.
- Koppen G, Covaci A, Van Cleuvenbergen R, et al. Persistent organochlorine pollutants in human serum of 50–65 years old women in the Flanders Environmental and Health Study (FLEHS). Part 1: concentrations and regional differences. Chemosphere. 2002;48(8):811–825.
- Pieters R, Focant JF. Dioxin, furan and PCB serum levels in a South African Tswana population: comparing the polluting effects of using different cooking and heating fuels. Environ Int. 2014;66:71–78.
- Caudill SP. Use of pooled samples from the National Health and Nutrition Examination Survey. Stat Med. 2012;31(27):3269–3277.
- Aylward LL, Green E, Porta M, et al. Population variation in biomonitoring data for persistent organic pollutants (POPs): an examination of multiple population-based datasets for application to Australian pooled biomonitoring data. Environ Int. 2014;68:127–138.
- De Felip E, Bianchi F, Bove C, et al. Priority persistent contaminants in people dwelling in critical areas of Campania Region, Italy (SEBIOREC biomonitoring study). Sci Total Environ. 2014;487:420–435.
- Bates MN, Buckland SJ, Garrett N, et al. Methodological aspects of a national population-based study of persistent organochlorine compounds in serum. Chemosphere. 2005;58(7):943–951.
- Linderholm L, Biague A, Mansson F, et al. Human exposure to persistent organic pollutants in West Africa–a temporal trend study from Guinea-Bissau. Environ Int. 2010;36(7):675–682.
- Anwar M, Ridpath A, Berner J, et al. Medical toxicology and public health-update on research and activities at the centers for disease control and prevention and the agency for toxic substances and disease registry: environmental exposures among Arctic populations: the maternal organics monitoring study in Alaska. J Med Toxicol. 2016;12(3):315–317.
- Ray L, Brown C, Russell A, et al. Local knowledge and harvest monitoring of nonsalmon fishes in the lower Kuskokwim River Region, Alaska, 2005–2009 Alaska Department of Fish and Game, Anchorage, Alaska. 2010.
- Beyer, WH editor. Handbook of tables for probability and statistics. 2nd. Boca Raton, Florida: CRC Press; 1974.
- FDA. Advice about eating fish for women who are or might become pregnant, breastfeeding mothers, and young children. [cited Sept 24]. Available from: https://www.fda.gov/food/consumers/advice-about-eating-fish
- EPA. U. Reference dose for methylmercury (External review draft, 2000). Washington, DC.: US Environmental Proteciton Agency; 2000.
- Mahaffey KR, Clickner RP, Jeffries RA. Adult women’s blood mercury concentrations vary regionally in the USA: association with patterns of fish consumption (NHANES 1999–2004). Environ Health Perspect. 2009;117(1):47–53.
- Cusack LK, Smit E, Kile ML, et al. Regional and temporal trends in blood mercury concentrations and fish consumption in women of child bearing Age in the USA using NHANES data from 1999–2010. Environ Health. 2017;16(1):10.
Appendix 1.
Pre-specified ideal specimen pooling template