
 ?Mathematical formulae have been encoded as MathML and are displayed in this HTML version using MathJax in order to improve their display. Uncheck the box to turn MathJax off. This feature requires Javascript. Click on a formula to zoom.
ABSTRACT
Indoor concentrations of black carbon (BC) were measured when wood was burned for traditional cultural activities in a study in a Cree community located in subarctic Canada. The study also included an intervention using a propane-fuelled heater to mitigate in situ BC. Mass concentrations of BC were measured in a game-smoking tent for 39 days and in hunting cabins on the west coast of James Bay, Canada, for 8 days. Five-minute averaged BC mass concentration (N = 12,319) data were recorded and assessed using optimised noise-reduction averaging. Mean BC mass concentrations were lower in hunting cabins (mean = 8.25 micrograms per cubic metre (µg m−3)) and higher in the game-smoking tent (mean = 15.46 µg m−3). However, excessive BC peaks were recorded in the game-smoking tent (maximum = 3076.71 µg m−3) when the fire was stoked or loaded. The intervention with the propane heater in a hunting cabin yielded a 90% reduction in measured BC mass concentrations. We do not presume that exposure to BC is of concern in hunting cabins with appropriate wood-burning appliances that are well-sealed and vent outside. In game-smoking tents, we advise that persons take intermittent breaks outside of the tent for fresh air.
Introduction
Burning wood indoors is part of the traditional cultural practices of Indigenous Peoples in North America [Citation1,Citation2]. Typically, wood is burned inside store-bought or homemade stoves for heating and or cooking in homes and cabins. Hunted and prepared wild game is smoked over an open fire pit that burns wood to produce smoke as a means of food flavouring and preservation [Citation2]. However, indoor wood burning potentially exposes occupants to myriad pollutants from the combustion of the wood itself. Over the last few decades, studies have demonstrated evidence of adverse health impacts from wood smoke due to indoor wood burning [Citation3–Citation5].
The health impacts from wood smoke are from exposure to a combination of different inorganic (e.g. carbon monoxide (CO), nitrogen oxides (NOx)), and organic compounds (e.g. acetic acid, polycyclic aromatic hydrocarbons) formed when the wood is combusted [Citation6]. Additionally, the combustion of solid fuel sources, such as wood, results in particulate matter. Particulate matter (PM) that is less than 2.5 micrometres (μm) in diameter (PM2.5) poses a risk to health as it may deposit in the gas exchange region in the lungs [Citation7]. PM2.5 readily generates when wood-smoke concentrations are high, and wood smoke generates particle sizes less than or equal to 1 μm on average [Citation8].
Black carbon (BC) is a significant component of wood-smoke PM − a light-absorbing carbon aerosol highly correlated to elemental carbon − and can make up a large part of PM2.5 mass concentrations [Citation9–Citation11]. Production of BC occurs during the incomplete combustion of wood when burning temperatures are below 500°C [Citation12]. Following exposure to BC from 100 to over 350 µg m−3, participants in studies [Citation13–Citation15] displayed increased adverse cardiovascular effects (e.g. arrhythmias, blood pressure), bronchial irritation, and an increase in inflammatory markers resulting from inflammation within the lung. Importantly, mortality due to BC from wood smoke yields higher mortality than that from PM when compared to a 1 µg m−3 increase in mass concentration [Citation16]. Studies examining the relationship between BC exposure due to wood smoke and the incidence of lung cancer are present in the literature; however, the results in support of the causality are mixed [Citation17–Citation20]. Nonetheless, there is evidence that exposure to high concentrations of BC may impact human health.
There is a knowledge gap for the assessment of BC exposure in Indigenous communities in North America. Further, concern about wood-smoke concentrations was brought forward by the community, and our research team worked with hunters and trappers to assess exposure in a co-designed study approved by community leadership. Therefore, this paper’s objective was to examine the BC mass concentrations generated during traditional cultural activities (TCA) in Fort Albany, a western James Bay Cree subarctic community in Canada. These TCA included a game-smoking tent and hunting cabins where wood was burned for food flavouring, preservation, cooking, and heating. The BC mass concentrations from an intervention using propane-fuelled heaters instead of burning wood as sources of heat in hunting cabins were also examined.
Methods
Study region
The Fort Albany First Nation (FAFN) community in Ontario, Canada (), is low-lying muskeg (grassy bog), remote fly-in community with winter-road access. It is home to approximately 850 Mushkegowuk Cree residents who primarily speak Cree and English [Citation21,Citation22]. As a subarctic subsistence-based community, members largely depend on the land to hunt big game, small upland game, and fish. This James Bay community (Köppen Climate classification Dfc) has an annual mean daily temperature of −2°C and an annual mean precipitation rate of 569 mm [Citation23,Citation24].
Figure 1. Fort Albany First Nation, James Bay, Ontario, Canada.
The burning of wood in the study region
Hardwood is burned for heating in homes and hunting cabins in and around this region. Softwood is also burned slowly at low heat to produce smoke for flavouring and preserving game and fish, in game-smoking tents – the burning of softwood typically yields higher BC concentrations than hardwood [Citation25]. Background concentrations of BC from wood smoke are assumed to be relatively low in this community because of the low population, lack of nearby industrial emission, and the widespread use of electric heating in housing. Firewood is a limited resource and sometimes requires long-distance travelling to obtain. Vehicular and diesel engine BC emission levels are negligible in this community because of the low volume of vehicles.
Black carbon aerosol concentration data collection
BC mass concentrations from the combustion of wood during TCA were collected in a multi-site and multi-participant study over 2 years, from October 2014 to April 2016 in sites in the James Bay region (). Participants (n = 22) who enrolled in the study were provided with a full informed consent that followed a study protocol approved by the Institutional Review Board for Human Subjects Research at the University of Massachusetts (USA), University of Toronto (Canada), and Ryerson University (Canada). Our collection of BC mass concentration data was grouped into two phases based on sites: a single site game-smoking tent (TCA1) and three hunting cabins on a single site (TCA2). The latter, TCA2, included a propane-fuelled heater intervention (TCA2i).
Instrumentation
The fixed site, online (real-time) monitoring to measure BC mass concentrations were carried out in both phases of this study at each site location using portable aethalometers (model AE51, AethLabs, USA). Due to the concurrent nature of the data collection at different sites, only one aethalometer was available for monitoring at each site at a given time. All aethalometers were calibrated before the collection of data. Each aethalometer was set at a flow rate of 50 millilitres per minute (mL min−1) and set to measure BC mass concentration – in nanograms per cubic metre (ng m−3) – deposited on filters and optically measured (see section 2.3) at five-minute intervals. Left to run continuously, they were connected to portable solar power sources (Yeti 400 or 1250, GoalZero, USA) or external battery sources (Astro Series P820, Anker, USA) to ensure the internal aethalometer battery remained charged continuously. Filters were changed at regular time intervals, depending on the perceived extent of the wood-smoke levels at each site by one of the investigators (i.e. filters were changed more frequently in the smoking tent than hunting cabins) or when the aethalometer indicated the filter was saturated. Participants in hunting cabins were trained on how to change the filters when an on-site investigator was not present; investigators changed all filters in the game-smoking tent. Lee [Citation26] presents a detailed overview of the functionality and performance of the aethalometers used in our study. Other instrumentation was also used at our study sites to record temperature and relative humidity.
Data collection in a game smoking tent (TCA1)
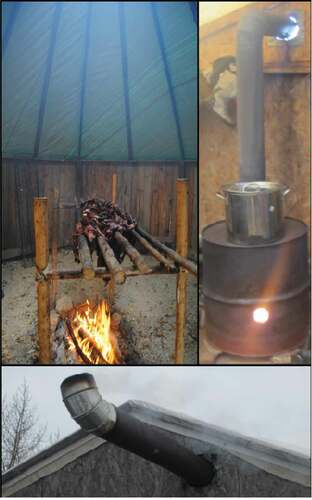
Samples of BC mass concentrations from the combustion of wood for food preservation in a game-smoking tent were collected from a single tent located within the study region. The sample collection occurred over 39 non-consecutive days in fall (October 2014), winter (March 2015), spring (April 2015) and summer (August 2015) (). Our participants in this study smoked Canada geese (Branta canadensis) and Snow geese (Chen caerulescens) during our data collection periods. The tent itself had a permanent 6 metre (m) wooden frame octagonal structure, tarped canvas walls and ceiling, and a fully functioning door, but was not wholly insulated from the outdoor elements. An approximate 1 m opening at the top centre of the tent acted as a vent for excess smoke. A blow torch was used to ignite a fire with a dried source of wood (e.g. birch (Betula papyrifera) and once the fire was past its initial burning phase, a wetter type of wood (e.g. cedar (Thuja occidentalis)) was applied to the fire and allowed to smoulder and produce smoke. The geese’s carcases were hung over the smoke at approximately 1 m above the fire on a wooden structure ()) for several hours. The sampling equipment was set up against the wall inside the game-smoking tent and allowed to run for 24-h cycles with periodic interventions from investigators to change filters. Sample collection of BC mass concentrations was done during all phases of fire ignition, smoking and die down. No intervention to reduce the amount of wood smoke present in the smoking tent was carried out due to logistical constraints. Data for outdoor temperature, relative humidity and wind speed – factors that influence BC concentrations [Citation27,Citation28] – were recorded on a nearby weather station (HOBO weather station, Hoskins Scientific, Boston, USA).
Table 1. Summary of black carbon mass concentration data collection.
Figure 2. Clockwise from top left: Figure 2(a). Geese being smoked over a fire in a traditional game-smoking tent. Smoke is clearly visible towards the top of the photo. Figure 2(b). A wood burning wood stove made of a steel 45-gallon drum in a hunting cabin. Figure 2(c). A chimney flue exiting a hunting cabin. Photo permissions: R. Moriarity (2a) and M.Wilton (2b and c).
Data collection in hunting cabins (TCA2)
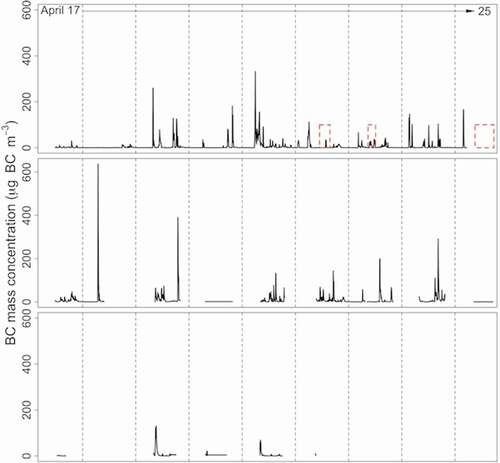
The collection of BC mass concentrations from the combustion of wood as a heating source in three hunting cabins (sites I to III) took place over approximately 8 days from April 17 to April 25, 2016, on the west coast of James Bay (). The cabins’ design was similar to traditional prospector tents constructed of a wooden frame with plywood-covered floors and walls, raised off the ground by a small platform and with canvas and or tarp roofs; the cabins were relatively well enclosed. The heat was generated from burning spruce (Picea glauca), dried wood, or cedar in wood stoves made from old 45-gallon fuel drums. These drums were previously cleaned and then fashioned into heating and cooking stoves with fully operating top-loading doors and flued chimneys ()). Two out of the three cabins at this site had well-sealed top-loading wood openings into the stove, while one site’s stove only had a thin frying pan as a cover. The chimney flue stack exited all the cabins with an elbow and ended approximately 1 m from the cabin structure itself ()). An on-site investigator, well known among the participants, was available during the entire data collection period and was able to facilitate filter changes, equipment troubleshooting, and manage other logistical issues.
Additionally, in site I, an intervention period (TCA2i) to gather data for BC mass concentrations when using a propane-fuelled source of heat instead of burning wood was carried out by the on-site investigator. The intervention period used a propane-fuelled heater (Big Buddy Portable Heater, Model: MH18B, Mr. Heater, USA) connected to a standard 20-pound propane tank and was carried out for three non-consecutive days, April 22, 23 and 25, 2016 (t ≈ 23 hours). During this intervention phase, a portable propane-fuelled cookstove (Triton Propane Stove, Coleman, USA) was used to avoid overlap of BC mass concentration measures from two different fuel sources. A portable weather station (Kestrel 4500 Weather Metre, Kestrel, USA) to collect outdoor temperature, relative humidity and wind speed was also used.
Data treatment
The aethalometers used in this study only have one reference signal wavelength (λ = 880 nanometres (nm)) and are reliable when measuring online BC mass concentrations. However, noise generated from substantial periodic changes in levels of BC, electronic or optical fluctuations can result in negative BC or light attenuation measures that are erroneous [Citation26,Citation29]. Therefore, a post-processing method for cleaning the data was necessary. This method requires an overview of how the aethalometer detects changes in BC mass concentrations, specifically through light attenuation (ATN).
Black carbon light attenuation
The aethalometer measures BC mass concentrations and simultaneously records changes in light intensity through a process modelled on the Beer–Lambert law [Citation30]. This measurement is generated through two sensors: a reference signal sensor and a sensing photodetector measuring the BC aerosol drawn in by a pump and deposited on a filter [Citation31]. In plain terms, the aethalometer calculates the logarithmic ratio between the reference signals detected intensity of the wavelength (I0) and the photodetector’s detected intensity of the wavelength (I) transmitted through the BC deposited on the filter at time t. Then, at the next set time interval (t + Δt) – every 5 min in our study – the measurement repeats and produces a difference between t and t + Δt as shown in the following eqaution EquationEquation (1)(1)
(1) [Citation26,Citation29,Citation30]:
where . This difference (ΔATN) of light attenuation is then used with Optimised Noise-reduction Averaging (ONA) software to treat the data as to reduce noise and smooth the overall time series of the dataset [Citation29].
Optimised noise-reduction averaging
The ONA algorithm used as a post-processing method to treat our data, following download from the aethalometer, used software developed by the USA Environmental Protection Agency [EPA] (US EPA, version 0.0). This software is available for free online but is no longer updated or supported [Citation32]. By treating the data using this software, most negative values of BC were removed using a time-averaged difference of the light attenuation (ΔATN) across several neighbouring BC mass concentration measurements, thus creating a new positive ONA BC mass concentration that maintained similar trends of the original data. For example, a single negative value was averaged with the two nearest positive values, and a single new positive ONA BC mass concentration measure was created for all three measures. The resulting output of the ONA software contained the original BC mass concentrations, the ONA BC mass concentrations, the initial light attenuation level and the number of original BC measurements used to average the newly created measure. For a complete overview of the ONA methodology, please refer to Hagler et al. [Citation29]. Following this post-processing method, any remaining negative ONA BC values were removed as they resulted from unresolved error outside of our control [Citation33].
Statistical analysis
All statistical tests were carried out in R version 3.5.2 (R Core Team, Vienna, Austria, 2018) with statistical significance set at p < 0.05 using the positive ONA BC mass concentrations. The Shapiro–Wilk test was used to assess the normality of the data. Following this, Mann-Whitney-Wilcoxon tests were used to assess the difference of median BC mass concentrations for the seasons in the game-smoking tent and across the hunting cabin sites. The same test was also used to identify differences between BC mass concentrations when burning wood for heat and when using propane-fuelled heaters as a source of heat.
Results
presents the descriptive statistics of the BC mass concentrations data for all seasons in the game-smoking tent (TCA1) and hunting cabin sites (TCA2) analysed for this study − including measures from the TCA2i propane intervention. summarises the range of the BC mass concentrations for the game-smoking tent and hunting cabins. All results are presented in µg m−3.
Table 2. Black carbon mass concentrations in game-smoking tents and hunting cabins.
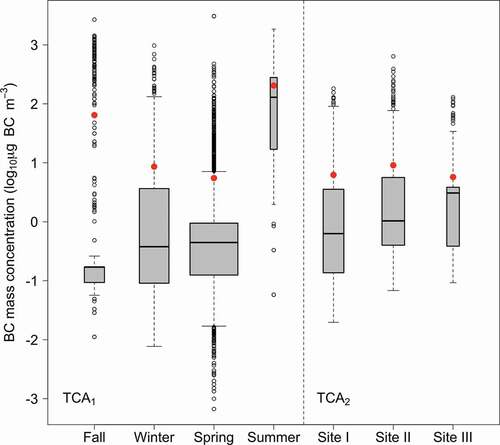
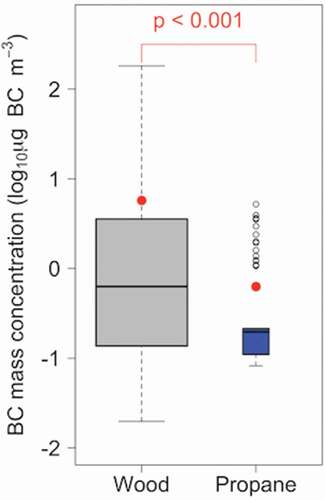
Figure 3. Wood smoke BC mass concentration boxplots. Mass concentrations of BC (log10 µg m−3) of the game-smoking tent (TCA1) and the hunting cabins (TCA2) with seasonal or site means (red circle). The width of the boxes varies by sample size, where a larger box represents a larger sample size and vice versa.
Black carbon mass concentrations in a game-smoking tent (TCA1)
BC mass concentrations from the game-smoking tents (N = 9459) are presented by season in . The maximum measured peak concentration of BC mass concentrations of all the measurement periods was measured during the spring – when increased smoking of game meat coincided with the spring hunt – at 3076.71 µg m−3. The highest mean and median BC mass concentrations were measured in summer at 204.08 µg m−3 and 129.13 µg m−3. Similarly, high peaks of BC mass concentrations were also observed during this seasonal period. The next nearest seasonal high mass concentration of BC was measured in fall with peak concentrations exceeding 2600 µg m−3. The median BC mass concentrations measured in fall, winter, and spring were generally the same, with a significant difference (p < 0.001) between those seasonal median concentrations compared to the median BC mass concentration measured in the summer. The descriptive statistics demonstrated similarity across the winter and spring seasons for the mean, median and measured BC mass concentrations up to the 75th-percentile. There was a divergence at the 95th-percentile where the BC mass concentrations more than doubled in the winter (). The fall and summer season’s BC mass concentrations in game-smoking tents showed little similarity as the concentrations measured in the summer increased exponentially faster than the measured fall season concentrations before or around the 25th percentile.
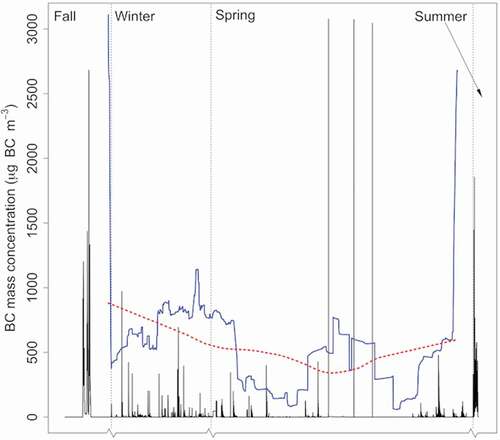
Figure 4. Wood smoke BC mass concentrations during TCA1. Non-consecutive time-series plot of mass concentrations of BC over the seasonal data collection periods in the game-smoking tent. The change in season is noted by the break in the axis. The seasonally adjusted data (blue line) and moving average (dashed red line) are included to indicate the trend of the data.
Black carbon mass concentrations in the hunting cabins (TCA2)
The BC mass concentrations measured (N = 2860) in hunting cabins over the same period and relative location are considerably lower than the game-smoking tent. The lower BC mass concentrations are not surprising because wood-smoke emissions within hunting cabins resulted from space heating and cooking fugitive emissions, not the intentional release of wood smoke for food preservation purposes. The maximum peak measured in the hunting cabins was 637.57 µg m−3 () for site II. The descriptive statistics of the BC mass concentrations up to the 95th-percentile are less variable in the hunting cabins than the game-smoking tent, with the mean of sites I and III, and medians of sites I and II being relatively similar. The median BC mass concentrations from all sites have higher median concentrations than the closest comparable game-smoking tent season – winter. shows a time series of the measured BC mass concentrations throughout the data collection period. For site I, data collection stopped midday on April 21 due to equipment failure. For sites II and III, the breaks in the time series resulted from the participants shutting off the machines because of noise annoyance during the night-time hours or other reasons – unknown to the researchers – when participants decided they no longer wanted the equipment running in their hunting cabin.
Figure 5. Wood smoke BC mass concentrations during TCA2. Time-series plot of mass concentrations of BC over the period from April 17 to 25, 2016 at site I (top plot), site II (middle plot) and site III (bottom plot). The propane interventions at site I are noted by the red dashed-line boxes.
Propane intervention (TCA2i)
The BC mass concentrations measured during the propane-intervention period provided data that demonstrated a considerable and statistically significant reduction (p < 0.001) in measured BC mass concentrations (). The mean BC mass concentration was 0.63 µg m−3. The maximum recorded BC mass concentration was 5.21 µg m−3 during the intervention period and is comparable to the 75th-percentile measured concentrations of sites I to III when burning wood. Conversely, measured BC mass concentrations were minimal during the April 25 data collection period and did not exceed the aethalometer’s minimum detection limit (0.05 µg m−3); therefore, no useable data were generated during this period approximately 510 minutes (8.50 hours). The instrument appeared to operate correctly during this period, and, therefore, we assume the BC aerosol concentrations were negligible at this location.
Figure 6. Wood smoke BC mass concentrations boxplots before and during propane intervention (TCA2i). Mass concentrations of BC (log10 µg m−3) in hunting cabin site I while burning wood for heat (grey box) and when the propane-fuelled heater was introduced (blue box). The mean BC mass concentrations are indicated by a red circle. Sample size varies by width of box.
Discussion
BC emissions from the burning of wood in an indoor space for food preparation or preservation and heating may have a health impact on those exposed [Citation3,Citation5,Citation6,Citation16,Citation34–Citation39]. Our study is the first to investigate BC mass concentrations from wood-smoke emissions during Indigenous TCA in subarctic Canada.
Black carbon mass concentrations compared across phases
Our results are comparable with studies investigating the indoor burning of wood for cooking and heating, in which woodstoves and open pits that burn wood for heating and food preparation were studied [Citation20,Citation40]. BC mass concentrations are always higher in unvented, indoor open-pit style burning; this style of wood burning is comparable to the game-smoking tent in our study. However, the difference between the maximum peak concentrations among the game-smoking tent and the hunting cabins was considerable, as was the significant difference between the measured BC mass concentrations during the propane intervention period. The maximum peak BC mass concentration of all the hunting cabin sites was 79% lower than the maximum peak level in a game-smoking tent in spring. The spikes in measured BC mass concentrations typically appeared when starting a fire before smoking-game in the tent, and first thing in the morning in the hunting cabins or when the propane heater failed to provide adequate heat ( and ). Other spikes in measured BC mass concentrations occurred when stoking the fire, adding wood, cooking, or other reasons for additional heat.
Interestingly, the median BC mass concentrations are higher in the hunting cabins than in the game-smoking tent, except for summer, but with far less variation in the range of concentrations. We suspect that this has to do with the hunting cabins’ insulation as they are better insulated than the game-smoking tent, and they may trap more BC aerosol inside. However, because they are insulated – and the woodstoves vented properly – the measured BC mass concentrations are much lower than the game-smoking tent overall, and the better insulation in the hunting cabins results in more efficient heating and less wood being burned [Citation41,Citation42].
Propane intervention
Our intervention using a propane-fuelled heater in a hunting cabin produced limited but positive results. However, the findings demonstrated significantly reduced BC mass concentrations in the hunting cabins, and this is a significant improvement compared to burning wood for heating. The results during the intervention phase of our study align with the few existing rural-intervention studies that used propane-fuelled heaters to mitigate the high mass concentrations of BC from burning wood indoors for heat via a vented wood-burning appliance. As rural studies are the closest representation of our study design, they will provide a comparative basis. Noonan et al. [Citation43] found an approximately 30% reduction in particulate matter (PM2.5), a proxy for BC [Citation10,Citation44], when they used propane-fuelled heaters among other types of non-combustible heating during a multi-year intervention study replacing wood-burning stoves in rural Montana, USA.
Additionally, a review by the World Health Organisation (WHO) found that PM2.5 concentrations were reduced by up to 80% when using clean fuelled heaters, including propane, as a heating source instead of burning wood [Citation39]. The mean black-carbon-aerosol concentration we measured during the propane-intervention phase of our study was 90% lower than the measured BC mass concentrations when burning wood in the same cabin (). However, even though we discovered promising results, the intervention was not suitable in practice.
Participants who were keen to adopt – and who had agreed to – the propane-fuelled heater intervention found they were unsure about the equipment once installed at their camps. They were new adopters and were unable to receive input from experienced peers as this was not a traditional cultural method of heating a cabin. Consequently, the on-site researcher had permission to test the propane intervention equipment in a cabin to assess any change in BC mass concentrations and determine if it was practical. For this reason, we were only able to use one cabin site for the propane intervention. While the BC mass concentrations were significantly lower, the intervention was impractical for a cabin in the remote subarctic. Although the propane-fuelled heater was rated sufficiently for the cabin’s square footage, it was inadequate in dealing with the extremely cold and windy conditions during the intervention period. The wood stove is not only for heating but has multiple purposes that a propane-heater could not replace (e.g. use of the fire to prepare hunted game by burning off feathers and melt snow for a non-potable water supply for cleaning). Thus, the intervention could have hindered other traditional activities associated with well-being [Citation45,Citation46]. Nonetheless, the propane-heater may be of practical use during the fall harvesting of wild game when weather is not as extreme, as in the winter and spring seasons, and mobility of campsites is important.
Potential exposure to black carbon
There is no consensus in the literature about exposure-dose-response relationships of BC [Citation34]; thus, our approach to assessing exposure is descriptive. We suspect that typical exposure to BC is limited in-cabin. During the day, people spend most of their time away from the cabin to hunt, forage, and for physical activity, and therefore, wood is reserved for inclement weather, cooking and overnight use (). The potential exposure to BC during the propane intervention is assumed to be negligible, but the potential exposure in game-smoking tents is considerably different.
Even though the median BC mass concentrations are lower in the game-smoking tents than the hunting cabins, there are 23 high peak concentrations at or exceeding 1000 µg m−3 recorded over the study duration. This result does not mean that high concentrations are sustained for an extended period; however, even a few minutes of exposure to BC mass concentrations at or above this level could negatively impact health [Citation20,Citation34,Citation39]. Furthermore, this exposure does not consider the cumulative exposure already received or received when spending time inside the game-smoking tent, nor does it account for effects attributed to other co-exposures, such as participant use of tobacco, underlying health impairments, or genetic predisposition to a disease. Participants in our study spent on average between four to six hours inside the tent preparing geese for smoking, leaving for bathroom breaks, or getting needed equipment or food. Given their cumulative exposure to ambient and peak periodic concentrations in the tent − especially in the fall, spring and summer – participants’ exposure to BC could be high. Generally, the exposure is an inequity faced by women predominantly as a result of food preparation or preservation using wood smoke [Citation38,Citation39]. However, responsibilities during TCA are currently shared among men and women in the present-day Mushkegowuk Cree culture; therefore, the potential exposure to BC is likely more even across genders than in different Indigenous cultures globally or as it was in the past.
On some days where a peak BC mass concentration was measured, and an excessive 24-h average concentration was observed: on October 14, 2014, the peak measured concentration was 2682.83 µg m−3 with a 24-h average of 154.58 µg m−3; on August 13, 2015, the peak measured concentration was 1853.60 µg m−3 and the 24-h average was 217.43 µg m−3. Riddervold et al. [Citation15] found that exposure to wood-smoke levels for 3 h in an indoor environment significantly increased airway irritation and or inflammation after exposure to wood-smoke concentrations of approximately 200 µg m−3 and higher. However, the maximum recorded peak measurement, 3076.71 µg m−3, occurred on April 20, 2015, but the 24-hour average was only 7.26 µg m−3. We believe this resulted from windy conditions on April 20, where the mean wind speed was approximately 5.97 metres per second (m s−1) with average gusts of 10.21 m s−1. The wind speeds and gusts on the other two dates were about half, with limited peak gusts of 6.22 m s−1 on August 13, during a thunderstorm.
Given that the game-smoking tent is not wholly insulated to the elements, we suspect that wind played a role in reducing BC inside the tent. A recent study [Citation28] looking at BC mass concentrations from diesel emissions substantiates our reasoning about wind, where pollutant concentrations, including BC, reduced four-fold with increasing wind speed from 1.11 m s−1 to 11.11 m s−1. Finally, we note that while intense short-term exposure to BC can have an impact on health, peak periodic mass concentrations are unique, and forthcoming risk assessments must assess the overall pattern of emissions to avoid erroneous conclusions skewed by these extremes; a point highlighted by Ezzati, Saleh and Kammen [Citation4].
Limits of a multi-phase cross-cultural study
We encountered some limitations in our study. First, we had logistical issues with equipment (e.g. equipment stranded at sites); therefore, we could only run one aethalometer at one time per cabin site. Two aethalometers at each site would have been ideal; however, this is unnecessary for data collection. Two aethalometers at each site would have provided a quality assurance technique with a backup should one fail. Aethalometer background noise may also intensify when connected to an external power source [Citation26]. However, this was unknown when we carried out our study as the Lee [Citation26] paper was published after we collected data. Our original study design had seven cabin sites, but four of the seven sites quickly became inaccessible due to atypical weather in April 2016 – the muskeg thawed and made travel by snow machine impossible. The ground was also too soft to use an all-terrain vehicle. Therefore, we were limited to using a helicopter; flight time was limited due to availability, weather and budgetary constraints. The climate was an anticipated problem, but the weather during our study was atypical, with little transition between the seasons. This limitation left our participants to manage an array of equipment to collect data and troubleshoot any problems. Although we trained our participants to use the equipment, an on-site investigator was ideal – as their main priority was gathering data and would not have hunting and camping responsibilities. Given what we learned with these encountered issues, we will be able to proceed with future studies with a more substantial knowledge base for quantitative investigations in the subarctic. Nonetheless, we believe that our current research has provided new insight and noteworthy areas to investigate for indoor BC emissions from TCA.
Conclusion
This descriptive study communicates a novel investigation of BC mass concentrations in a Cree First Nations community in subarctic Canada. It aims to guide further investigations and risk assessments that help improve Indigenous peoples’ health and well-being who use hunting cabins and game-smoking tents as part of their cultural practices. Mass concentrations of BC in hunting cabins, where wood was burned for heat, were generally low and likely reflected a smaller health risk than BC exposure attributed to other TCA. In game-smoking tents, at given times when wood is burned to produce smoke for food flavouring and preservation, it is advisable to avoid prolonged time spent inside the tent without a break for more pristine air. While we cannot provide a specific, ad-hoc recommendation towards risk reduction interventions, we note that exposure to pollutants is cumulative. We recommend that Indigenous community members who participate in similar TCA take a proactive approach to reduce these exposures as much as possible, considering that one must balance participation in an activity that poses a known health risk, but has cultural significance for a community. Future studies must emphasise how to mitigate potential exposure to BC emissions in a game-smoking tent and include sustainable and culturally acceptable intervention strategies.
Authors’ contributions
RJM was responsible for the data analysis and visualization, and drafted the original manuscript as well. ENL and REP were responsible for study conception and design, and RJM, MJW and ENL were responsible for the field work. RJM, MJW, ENL, LJST and REP contributed to the interpretation of results and drafted the final manuscript. All authors provided editorial feedback and approved the final manuscript.
Acknowledgments
We would like to thank the participants in Fort Albany First Nation for their involvement and commitment to our study and Roger Davey, who was instrumental in participant recruitment and day-to-day location logistics. We also thank Pallavi Pant and other collaborators at the University of Massachusetts, Amherst. This work was developed under Assistance Agreement No. R835605 awarded by the U.S. Environmental Protection Agency to R.E. Peltier. The EPA has not formally reviewed it. The views expressed in this document are solely those of the authors and do not necessarily reflect those of the Agency. EPA does not endorse any products or commercial services mentioned in this publication. We also thank the Canadian Institutes of Health Research for additional funding support (FRN 155890 and 156396).
Disclosure statement
The authors report no conflict of interest.
Data availability
The data that support the findings of this study are retained with the corresponding author, Robert J. Moriarity. The data are not publicly available because it contains information that could compromise the privacy of research participants.
Additional information
Funding
References
- Champion WM, Charley PH, Klein B, et al. Perception, culture, and science: a framework to identify in-home heating options to improve indoor air quality in the Navajo Nation. Sci Total Environ. 2017;580:297–13.
- Pal S, Haman F, Robidoux MA. The costs of local food procurement in two Northern Indigenous communities in Canada. Food Foodways. 2013;21:132–152.
- Martin WJ, Hollingsworth JW, Ramanathan V. Household air pollution from cookstoves: impacts on health and climate. In: Pinkerton KE, Rom WN, editors. Global climate change and public health [Internet]. New York: Springer New York; 2014. 237–255. [cited 2019 Dec 9]. Available from: https://doi.org/http://doi.org/10.1007/978-1-4614-8417-2_13
- Ezzati M, Saleh H, Kammen DM. The contributions of emissions and spatial microenvironments to exposure to indoor air pollution from biomass combustion in Kenya. Environ Health Perspect. 2000;108:833–839.
- Balmes JR. Indoor biomass burning and health consequences. In: Nadadur SS, Hollingsworth JW, editors. Air pollut health eff [Internet]. London: Springer London; 2015. 381–402. [cited 2019 Dec 9]. Available from: https://doi.org/http://doi.org/10.1007/978-1-4471-6669-6_14
- Larson TV, Koenig JQ. Wood smoke: emissions and noncancer respiratory effects. Annu Rev Public Health. 1994;15:133–156.
- Pierson WE, Koenig JQ, Bardana EJ Jr. Potential adverse health effects of wood smoke. West J Med. 1989;151:339.
- Ammann H Health implications of wood smoke. Int Congr Resid Wood Energy. WSU WWREC; 1986. p. 331–348.
- Singh A, Rajput P, Sharma D, et al. Black carbon and elemental carbon from postharvest agricultural-waste burning emissions in the indo-gangetic plain. Adv Meteorol. 2014;2014:1–10.
- Götschi T, Oglesby L, Mathys P, et al. Comparison of black smoke and PM2. 5 levels in indoor and outdoor environments of four European cities. Environ Sci Technol. 2002;36:1191–1197.
- Wallace L. Real-time measurements of black carbon indoors and outdoors: a comparison of the photoelectric aerosol sensor and the aethalometer. Aerosol Sci Technol. 2005;39:1015–1025.
- Bølling AK, Pagels J, Yttri KE, et al. Health effects of residential wood smoke particles: the importance of combustion conditions and physicochemical particle properties. Part Fibre Toxicol. 2009;6:29.
- Barregard L, Sällsten G, Gustafson P, et al. Experimental exposure to wood-smoke particles in healthy humans: effects on markers of inflammation, coagulation, and lipid peroxidation. Inhal Toxicol. 2006;18:845–853.
- Danielsen PH, Bräuner EV, Barregard L, et al. Oxidatively damaged DNA and its repair after experimental exposure to wood smoke in healthy humans. Mutat Res Mol Mech Mutagen. 2008;642:37–42.
- Riddervold I, Bønløkke J, Olin A-C, et al. Effects of wood smoke particles from wood-burning stoves on the respiratory health of atopic humans. Part Fibre Toxicol. 2012;9:12.
- Janssen NAH, Hoek G, Simic-Lawson M, et al. Black carbon as an additional indicator of the adverse health effects of airborne particles compared with PM 10 and PM 2.5. Environ Health Perspect. 2011;119:1691–1699.
- Kurmi OP, Arya PH, Lam K-BH, et al. Lung cancer risk and solid fuel smoke exposure: a systematic review and meta-analysis. Eur Respir J. 2012;40:1228–1237.
- LIM W-Y, Seow A. Biomass fuels and lung cancer. Respirology. 2012;17:20–31.
- Delgado J, Martinez LM, Sánchez TT, et al. Lung cancer pathogenesis associated with wood smoke exposure. Chest. 2005;128:124–131.
- Hu W, Downward GS, Reiss B, et al. Personal and indoor PM 2.5 exposure from burning solid fuels in vented and unvented stoves in a rural region of China with a high incidence of lung cancer. Environ Sci Technol. 2014;48:8456–8464.
- Barbeau C, Oelbermann M, Karagatzides J, et al. Sustainable agriculture and climate change: producing potatoes (Solanum tuberosum L.) and bush beans (Phaseolus vulgaris L.) for improved food security and resilience in a Canadian subarctic first nations community. Sustainability. 2015;7:5664–5681.
- Statistics Canada. Fort Albany (Part) 67, IRI [Census subdivision], Ontario and Ontario [Province] (table). Census profile. 2016 Census. Statistics Canada catalogue no. 98-316-X2016001 [Internet]. 2016. Available from: https://www12.statcan.gc.ca/census-recensement/2016/dp-pd/prof/index.cfm?Lang=E
- Kottek M, Grieser J, Beck C, et al. World map of the Köppen-Geiger climate classification updated. Meteorol Z. 2006;15:259–263.
- Weatherbase. Fort Albany, Ontario weather [Internet]. 2019. Available from: http://www.weatherbase.com/weather/weather-summary.php3?s=718361&cityname=Albany%2C+Ontario%2C+Canada&units=
- Meyer NK. Particulate, black carbon and organic emissions from small-scale residential wood combustion appliances in Switzerland. Biomass Bioenergy. 2012;36:31–42.
- Lee J. Performance test of microaeth® AE51 at concentrations lower than 2 μg/m3 in indoor laboratory. Appl Sci. 2019;9:2766.
- LaRosa LE, Buckley TJ, Wallace LA. Real-time indoor and Outdoor measurements of black carbon in an occupied house: an examination of sources. J Air Waste Manag Assoc. 2002;52:41–49.
- Evans G, Audette C, Badali K, et al. Near-road air pollution pilot study final report [Internet]. Southern Ontario Centre for Atmospheric Aerosol Research, University of Toronto; 2019. p. 139. Available from: http://hdl.handle.net/1807/96917
- Hagler GS, Yelverton TL, Vedantham R, et al. Post-processing method to reduce noise while preserving high time resolution in aethalometer real-time black carbon data. Aerosol Air Qual Res. 2011;11:539–546.
- Swinehart DF. The beer-lambert law. J Chem Educ. 1962;39:333.
- Hansen ADA, Rosen H, Novakov T. The aethalometer—an instrument for the real-time measurement of optical absorption by aerosol particles. Sci Total Environ. 1984;36:191–196.
- Hagler G Optimized Noise-Reduction Algorithm (ONA) program improves black carbon particle measurements using aethalometers [Internet]. 2011. Available from: https://www.epa.gov/air-research/optimized-noise-reduction-algorithm-ona-program-improves-black-carbon-particle
- Backman J, Schmeisser L, Virkkula A, et al. On aethalometer measurement uncertainties and an instrument correction factor for the Arctic. Atmos Meas Tech. 2017;10: 5039–5062.
- Janssen N, Gerlofs-Nijlland M, Lamki T, et al. Health effects of black carbon [Internet]. Copenhagen: World Health Organization Regional Office for Europe; 2012. Available from: http://www.euro.who.int/en/publications/abstracts/health-effects-of-black-carbon-2012
- Ezzati M, Kammen DM. The health impacts of exposure to indoor air pollution from solid fuels in developing countries: knowledge, gaps, and data needs. Environ Health Perspect. 2002;110:1057–1068.
- Smith KR, Frumkin H, Balakrishnan K, et al. Energy and human health. Annu Rev Public Health. 2013;34:159–188.
- Balmes JR. Household air pollution from domestic combustion of solid fuels and health. J Allergy Clin Immunol. 2019;143:1979–1987.
- Ellegård A. Cooking fuel smoke and respiratory symptoms among women in low-income areas in Maputo. Environ Health Perspect. 1996;104:980–985.
- WHO guidelines for indoor air quality: household fuel combustion [Internet]. Geneva, Switzerland: World Health Organization; 2014. Available from: https://www.who.int/airpollution/guidelines/household-fuel-combustion/IAQ_HHFC_guidelines.pdf
- Balakrishnan K, Ghosh S, Ganguli B, et al. State and national household concentrations of PM2.5 from solid cookfuel use: results from measurements and modeling in India for estimation of the global burden of disease. Environ Health. 2013;12:77.
- Piccardo MT, Cipolla M, Stella A, et al. Indoor pollution and burning practices in wood stove management. J Air Waste Manag Assoc. 2014;64:1309–1316.
- Robinson DL. Australian wood heaters currently increase global warming and health costs. Atmos Pollut Res. 2011;2:267–274.
- Noonan CW, Ward TJ, Navidi W, et al. A rural community intervention targeting biomass combustion sources: effects on air quality and reporting of children’s respiratory outcomes. Occup Environ Med. 2012;69:354–360.
- Van Vliet EDS, Asante K, Jack DW, et al. Personal exposures to fine particulate matter and black carbon in households cooking with biomass fuels in rural Ghana. Environ Res. 2013;127:40–48.
- Cunsolo Willox A, Harper SL, Ford JD, et al. “From this place and of this place:” Climate change, sense of place, and health in Nunatsiavut, Canada. Soc Sci Med. 2012;75:538–547.
- Scannell L, Gifford R. Defining place attachment: A tripartite organizing framework. J Environ Psychol. 2010;30:1–10.
