
ABSTRACT
Since February 2020 the COVID-19 pandemic has been unfolding in the Arctic, placing many communities at risk due to remoteness, limited healthcare options, underlying health issues and other compounding factors. Preliminary analysis of available COVID-19 data in the Arctic at the regional (subnational) level suggests that COVID-19 infections and mortality were highly variable, but generally remained below respective national levels. Based on the trends and magnitude of the pandemic through July, we classify Arctic regions into four groups: Iceland, Faroe Islands, Northern Norway, and Northern Finland with elevated early incidence rates, but where strict quarantines and other measures promptly curtailed the pandemic; Northern Sweden and Alaska, where the initial wave of infections persisted amid weak (Sweden) or variable (Alaska) quarantine measures; Northern Russia characterised by the late start and subsequent steep growth of COVID-19 cases and fatalities and multiple outbreaks; and Northern Canada and Greenland with no significant proliferation of the pandemic. Despite limitations in available data, further efforts to track and analyse the pandemic at the pan-Arctic, regional and local scales are crucial. This includes understanding of the COVID-19 patterns, mortality and morbidity, the relationships with public-health conditions, socioeconomic characteristics, policies, and experiences of the Indigenous Peoples.
Data used in this paper are available at https://arctic.uni.edu/arctic-covid-19.
Introduction
The Arctic is home to more than seven million residents, including the Indigenous Peoples [Citation1–3]. Most remote settlements in the Arctic have access to only limited health care facilities or other infrastructure to implement COVID-19 preventive or mitigation measures [Citation4]. Consequently, Arctic regions are particularly vulnerable to the effects of the COVID-19 pandemic. COVID-19 (SARS-CoV-2) has, since December 2019, spread to all of the world’s 198 countries, including all Arctic states. In fact, SARS-CoV-2 is the fifth pandemic to affect the world since the 1918 flu outbreak, known as Spanish flu. Although pandemic morbidities have declined over the last 100 years, intense globalisation has accelerated the spread of these pandemics.
COVID-19 is highly infectious (basic reproduction number, R0, varying between 1.9 and 6.5 but typically between 2 and 3 [Citation5]), exhibits a relatively long but infectious asymptomatic period [Citation6], and is environmentally persistent [Citation7]. SARS-CoV-2 has left hundreds of thousands dead, many permanently compromised, while many others have barely noticed their infection [Citation8,Citation9]. Research suggests that morbidity from SARS-CoV-2 is elevated among those individuals suffering from hypertension, diabetes, heart disease, cancer, dementia, or with a medical record of strokes [Citation10,Citation11].
All of these issues do not bode well for Arctic communities. Arctic populations often demonstrate higher rates of hypertension, diabetes, heart disease, tuberculosis, hepatitis and other conditions [Citation12–15]. Thus, it is imperative to alert Arctic communities to both the infectious and lethal nature of SARS-CoV-2 and to direct resources to counter the threat that COVID-19 presents to these communities.
Pandemics, including smallpox, measles and influenza, have proven disastrous in the Arctic in the past [Citation16]. For example, remote, particularly Indigenous communities, were tragically and disproportionately affected by the Spanish Flu that inflicted very high population losses and is still remembered with fear [Citation17–19]. In past pandemics, the Indigenous Peoples leveraged their traditional knowledge, and isolated themselves on the land, thus effectively establishing quarantine measures [Citation20]. Previous experiences and disease-fighting knowledge gained over generations become especially relevant today, when bridging Indigenous and “western” scientific knowledge may be a source of solutions for the COVID-19 crisis [Citation12,Citation21]. While Indigenous communities are highly susceptible to pandemic pathogens and have suffered high disease mortality in prior pandemics, Indigenous knowledge has provided significant support in some communities through initiating their own preventive measures. Indigenous knowledge might also be a powerful tool for post-COVID-19 rehabilitation in the remote Arctic communities that offer a diversified, place-based approach [Citation12].
Arctic states are among the global leaders in COVID-19 cases and deaths. This includes the USA and Russia. Although Arctic regions are often quite different from the rest of the mainland, being part of these nations is a significant risk factor. The experience of the past pandemics in the Arctic communities [Citation19] clearly indicates that COVID-19 is not just an immediate danger. The negative effects will likely be lasting due to exacerbation of tenuous economic conditions, limited healthcare resources, food insecurity, existing co-morbidities, long-term physical, emotional and spiritual health implications for survivors [Citation4, Citation22, Citation23; Citation24, Citation25]. COVID-19 survivors will need expensive and lengthy rehabilitation. In addition, remote Arctic villages are poised to experience economic losses, reduction of transportation accessibility, and most importantly may also face the loss of elders – key knowledge holders – and thus of generational wisdom, culture, heritage and tradition.
In order to understand the COVID-19 pandemic and its consequences in the Arctic, we need to bring together Western, Indigenous, traditional, and local knowledge systems and foster community-based pandemic planning. However, the first necessity is to ensure that available COVID-19 data are promptly gathered and analysed with sufficient temporal and spatial detail to inform the medical services, policymakers and local communities. The goal of this paper is to assemble, present and conduct a preliminary analysis of available COVID-19 data in the Arctic at the regional (subnational) level. In particular, we seek to answer the following questions: (1) What was the spatial and temporal dynamic of COVID-19 spread in the Arctic regions early in the pandemic (February–July 2020)? (2) What were the emerging regional differences and other spatial patterns of the COVID-19 pandemic in the Arctic? (3) What are the key gaps in data and knowledge that need to be filled to understand the spatiotemporal dimensions of the COVID-19 pandemic in the Arctic? In order to answer these questions, we collected and analysed existing data on COVID-19 cases and deaths from the beginning of the pandemic through 1 July 2020 for 52 subnational political units aggregated to 10 Arctic “national” regions: Alaska, Faroe Islands, Iceland, Greenland, Northern Canada, Northern Norway, Northern Russia, and Northern Sweden.
Methods
Spatial coverage
A variety of COVID-19 related spatial and temporal data have been assembled at the subnational (regional, county) level for northern parts of the Arctic states (): Canada, Kingdom of Denmark (Greenland and Faroe Islands), Finland, Iceland, Norway, Sweden, Russia and the USA. We generally used the Arctic boundaries established by the Arctic Human Development Report [Citation26], although in some cases we extended the boundary to include larger or additional political units based on data availability [Citation2].
Figure 1. Study area
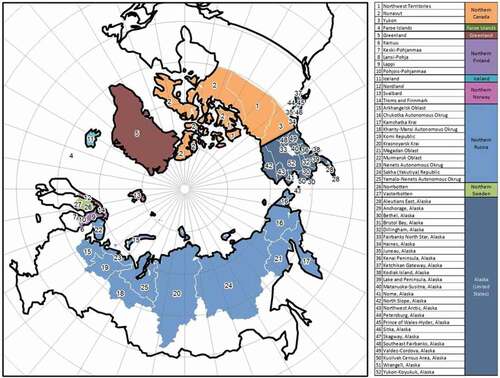
The regional data on diagnosed cases and deaths were collected daily at 17:00 GMT from the John Hopkins University Systems Science and Engineering for Canada, Greenland, Faroe Islands, Iceland, and the USA (https://coronavirus.jhu.edu/map.html), the Public Health Agency of Sweden (https://www.folkhalsomyndigheten.se/), the National Institute for Health and Welfare of Finland (https://thl.fi), the Government of the Russian Federation (https://стопкоронавирус.рф), and Verdens Gang (Norway) – https://vg.no. We gathered and analysed data between 21 February 2020 (the first documented case in the Arctic) and 1 July 2020. Automated harvesting processes were used for daily retrieval of data and publication of aggregated information in the form of the Arctic COVID-19 dashboard (https://arctic.uni.edu/arctic-covid-19). Finland aggregates fatalities by hospital districts, which differ from regions used for reporting cases. We collected COVID-19 deaths data for the Oulu hospital district, but had to limit the analysis.
Variables and definitions
We analysed a number of key variables typically used to characterise epidemics [Citation27]. Confirmed cases is the number of medically confirmed cases (based on the jurisdiction-specific standards) of COVID-19. Daily increase is the number of additional cases confirmed within 24 hours after the previous reporting. Incidence rate represents a cumulative number of confirmed cases per 100,000 residents in a given period of time. Confirmed deaths is the number of medically confirmed deaths attributable to the COVID-19 infection (based on the jurisdiction-specific standards). Mortality rate is the number of confirmed deaths attributable to COVID-19 infection per 100,000 residents in a given period of time. Case Fatality Ratio, or CFR, is the total number of deaths divided by the total number of confirmed cases at a given point in time.
Results
Confirmed cases
The first COVID-19 case in the Arctic was registered on 21 February 2020 in Troms and Finnmark County, Norway. By 1 March, new cases were confirmed in Iceland and Finland. Within weeks, confirmed cases appeared across the Arctic: on 12 March in Alaska, on 16 March COVID-19 spread to Greenland, and by 26 March it was detected in the Russian Arctic. There has been rapid growth since: on 1 April the cumulative number of confirmed cases in the entire Arctic was 2,045, by 1 May cases had increased to 8,393, on 1 June grew to 24,218 and by 1 July had skyrocketed to 53,056 () with the upward trends continuing past that date.
The cumulative trend in confirmed cases in the Arctic is depicted in . illustrates the daily increase in cases per 100,000 for the Arctic and its regions. While the pattern for the entire Arctic is similar, there were noticeable spikes and dips, as well as well-pronounced differences among countries. The spikes are especially interesting as they likely represent outbreaks, such as those at the extractive industry sites in Russia (e.g., in May almost 3,500 cases were confirmed at the Chayanda oil field and just under 1,200 were recorded at the Olympiadinskaya gold mineFootnote1). The number of cases per 100,000 in the Arctic climbed from less than 110 on 15 May to 433 by 1 July. However, the incidence rates in the northern parts of Arctic counties, with the exception of Russia, were lower than in the south ().
Table 1. COVID-19 Pandemic in the Arctic regions on 1 July 2020
There are striking regional differences in the distribution of COVID-19 cases as demonstrated by the reported daily increases () and cumulative cases. The overall dynamic of confirmed cases has been largely controlled by Northern Russia, where most cases have occurred. Early in the pandemic, cases rapidly grew in Iceland, Faroe Islands and Norway, but then quickly plateaued, while daily reports diminished to near zero. Iceland led in the case numbers and cases per 100,000 for some time, but the wave of pandemic there was virtually extinguished by the end of April, as it was in Faroe Islands (). Northern Norway and Finland followed a generally similar pattern. By late April, Northern Russia became the dominant source of new confirmed cases (). Daily increases in Russia continued to swell, and the number of confirmed cases per 100,000 eclipsed 500 by 1 July.
Figure 2. Cumulative cases of COVID-19 in the Arctic, February-July 2020
Deaths and fatality
The number of confirmed deaths has been steadily growing since the first COVID-19 fatality was recorded on 17 March in Iceland (). Deaths increased to 106 by 1 May to 231 by 1 June, and to 548 by 1 July. The COVID-19 mortality rate has been trending up and reached 4.5 per 100,000 by July. Northern Sweden has been demonstrating the highest COVID-19 cumulative death rate (23.6 per 100,000 on 1 July). Northern Russia, Iceland and Alaska were the other leaders. However, with respect to the dynamic of reported deaths, Iceland quickly passed the peak and returned to zero, while northern Russia, Sweden and Alaska continued to record fatalities. In other jurisdictions, deaths were sporadic and in the Canadian Territories, Faroe Islands and Greenland no deaths were registered as of 1 July.
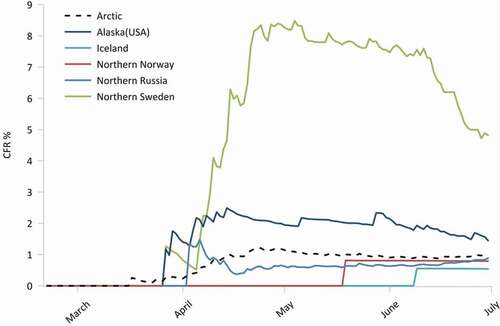
The CFR in the Arctic has fluctuated around 1%, with the highest values observed in the last part of March and early May (). However, Northern Sweden posted a CFR five to eight times higher than the rest of the Arctic. Notably, its neighbour Norway trended below the Arctic average. Another case of elevated mortality was Alaska with CFR reaching nearly 1.4. Although Iceland had a relatively substantial COVID-19 cumulative death rate, it did not exhibit high CFR. Greenland and Faroe Islands did not record any deaths. Finland’s COVID-19 deaths data are special case since the reporting area for fatalities is not the same as for cases, so no conclusive analysis was possible.
Figure 3. Reported confirmed cases (solid lines) and deaths (dashed lines) per 100,000 by region (seven day average). Greenland, Faroe Islands and Northern Canada had no fatalities. Finland reports fatalities using different spatial units than cases, so they are not illustrated
Figure 4. Dynamics of COVID-19 CFR by region
Regional dynamics and emerging typology
Arctic regions within each national jurisdiction were compared using COVID-19 incidents and deaths, per capita distribution and trends (, ). We can distinguish four groups of regions:
Early shockwave. This group includes regions that experienced an early onset of the pandemics, but quickly peaked and subsequently declined in both volume and rate of infections and deaths. The group consists of Iceland, Faroe Islands, Northern Norway, and Northern Finland. A characteristic feature of these jurisdictions is the implementation of early and relatively strict quarantines and other prevention measures, as well as effective mitigation strategies. For example, Iceland instituted sweeping restrictions as early as 6 March, Norway followed on 12 March, and Finland on 16 March [Citation28]. Most likely due to prompt and forceful action, these jurisdictions were largely able to overcome the “first wave” of the COVID-19 pandemic by 1 May 2020. They also demonstrated low mortality rate and CFR, partially because their health systems have not become overextended.
Prolonged first wave. Northern Sweden and Alaska constitute a second group of regions. Although the two are quite different in respect to the scale of the COVID-19 pandemics, both have undergone a protracted “first wave” with an unsteady, but continued growth in incidents and deaths. Sweden took an entirely different approach to battling the COVID-19 pandemic, especially compared to its Nordic neighbours by opting to rely on personal responsibility of its residents as opposed to strict closures and quarantines [Citation29]. As a result, the absolute and relative indicators of COVID-19 incidence in northern Sweden were noticeably higher than elsewhere in the Arctic ( and ). The initial wave of the pandemic continued strongly through July, when it started to show signs of “flattening.” The case of northern Sweden vis-a-vis its immediate Arctic neighbours, Norway and Finland, is particularly interesting as it provides a potential for showcasing the impact of different mitigation regimes in sparsely populated regions.
In Alaska, while prevention and mitigation measures were undertaken relatively early, they varied considerably across the state. Some communities, especially in rural areas and remote locations were nearly completely isolated from the outside world by travel bans. Other settlements had variable levels of restrictions with major urban communities gradually shutting down by the end of March. However, the state was largely reopened by late May [Citation30].
Tidal wave: Northern Russia generally followed the national patterns of the COVID-19 pandemic. The onset of confirmed cases started relatively late, but since has maintained growth through July. A peculiar feature of the COVID-19 incidence dynamics in northern Russia is the presence of spikes, which likely correspond to the outbreaks at industrial facilities. However, northern Russian regions demonstrated a relatively low mortality rate and CFR. A cautionary remark needed here is that Russian northern regions differ considerably in respect to population and settlement characteristics, while also being highly heterogeneous internally. Throughout spring, the Russian regions instituted closures and other quarantine measures, but they were highly variable with respect to timing, severity and enforcement. Most restrictions have been terminated while cases continued to increase.
Isolated splashes group brings together regions of Northern Canada and Greenland. These areas had no significant proliferation of the pandemic, registered only isolated cases, and posted few or no deaths. These remote territories implemented strict quarantines that included outright travel bans, self-isolation and closures. Perhaps, these regions could be considered “pre-pandemic.” However, the areas belonging to this group are highly vulnerable to the COVID-19 pandemic given their remoteness, lack of healthcare infrastructure, and underlying socioeconomic and health issues prevalent in local communities, so they remain of particular concern as the pandemic continues.
Preliminary insights from mobility data
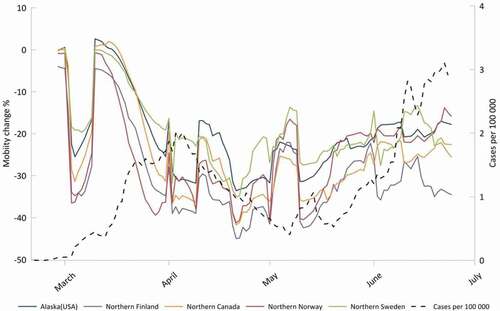
Mobility metrics may help to explain the geographic spread of COVID-19 [Citation31]. Google and Apple are providing summarised mobility data for various regions of the world. Initial evidence from Google Mobility Reports [Citation32] demonstrates variable mobility patterns spatially and temporally in the Arctic (). In this preliminary analysis, only workplace mobility was examined. The mobility metrics represent the departure from a baseline for a given day of the week. Google established this baseline from the five week period 3 January–6 February 2020 with the median value for the given day of the week from that period representing the baseline value. Thus, for any given day of week and for a given region, the workplace mobility metric represents a positive or negative percentage departure for the number of trips to mobile phone owner’s workplaces. A clear temporal pattern can be seen with all regions having a significant drop in workplace mobility from the middle of March with a subsequent stabilisation or rise from mid-April through June. Northern Sweden, however, exhibited lower reductions compared to its neighbours, likely reflecting its different approach to anti-epidemic measures, as discussed above. Less pronounced drops in workplace mobility were also observed in Alaska. Data for Russian regions were not available. Overall a significant drop in incidence rate in the Arctic is seen approximately 3 weeks after a sharp drop in workplace mobility was seen, an observation consistent with other regions [Citation33].
Figure 5. Workplace mobility change and COVID-19 incidence rate by region and overall cases per 100,000 in the Arctic
Discussion and conclusions
This study gathered available data and provided a preliminary analysis of the spatiotemporal dynamics of the COVID-19 pandemic in the Arctic between February and July of 2020. The quality and availability of usable data are still a concern, given that the scope, definitions and accuracy of reporting vary between countries and regions. Although we urge caution in interpreting the data and initial findings, there is enough evidence to give key insights into the ongoing pandemic. Still, more data and further studies are needed to elucidate the picture of COVID-19 spread and impacts in the Arctic, a task we intend to accomplish in follow-up contributions.
Since late February 2020, the COVID-19 pandemic has been ongoing in the Arctic with the exception of a few regions. However, we found considerable geographical differentiation in the dynamics of the pandemic. Greenland, Faroe Islands and northern Canada remained relatively COVID-19 free, likely due to their isolation, strong public-health directives and strictly implemented quarantine measures. Elsewhere, COVID-19 infections and mortality generally remained below national (non-Arctic) levels: the spatially dispersed and isolated nature of most Arctic communities is probably the reason for this. Early pandemic trends point to the success that Norway and Iceland demonstrated in rapidly suppressing COVID-19 after an initial rapid expansion of the pathogen. In contrast, Russia, Sweden and Alaska are experiencing increasing infections and mortality, although mortality in Sweden seems to have peaked in the last week of April and first week of May.
The outlook for the Russian Arctic and Alaska communities is less than rosy. In Sweden, the situation is also precarious because of the deliberate choice to use alternative anti-pandemic strategies [Citation29]. In northern Russia and Alaska, prevalence of extractive industries with the large fly in/fly out labour force, limited healthcare infrastructure, highly variable or inconsistently implemented public health directives at the state and national levels place northern regions, and especially Indigenous communities, in both countries at high risk [Citation34] Significant COVID-19 hot-spots centred on extractive facilities threaten many areas within the Arctic. What is more, both the USA and Russia remain in the top three COVID-19-infected countries, and with largely lifted anti-pandemic measures, Arctic communities in Russia and Alaska, remain at elevated risk levels for COVID-19 because of their spatial economic connectivity to the global economy.
At the same time, Arctic regions that are more embedded within the global economy are also experiencing higher COVID-19 infections and higher mortalities. These are communities that have suffered from Early Shockwave, Prolonged First Wave and Tidal Wave of COVID-19. Although some of these regions are wealthier and have better access to medical care, many communities there are ill-prepared for the pandemic and thus may face disastrous consequences in the months to come. In contrast, those more spatially and economically isolated, such as in Greenland and the Canadian Territories were less affected by COVID-19. This mirrors the patterns observed in the Medieval Black Death in Europe where villages located away from the pilgrimage and trade routes suffered fewer plague fatalities [Citation35]. Isolation from the traders appeared to be key during the Black Death and helped Indigenous communities to overcome measles and Spanish Flu [Citation20]. That is why bridging Indigenous and “western” scientific knowledge may be a source of place-based for the COVID-19 based on place-specific, locally embedded and knowledge-driven decisions and measures.
Knowledge gaps and future directions
Examining COVID-19 pandemic in the Arctic has a plethora of limitations. In addition to already mentioned data issues (coverage, varying definitions, retroactive revisions, aggregation, mismatching spatial units, asynchronous reporting, etc.), small Arctic populations create a “small numbers” problem resulting in high volatility, abrupt changes and uncertainties in interpretations of reported figures. In addition, a relatively short time has elapsed since the commencement of the pandemic. As new data become available, more efforts are required to track and analyse the pandemic at the pan-Arctic, regional and local levels. We need to better grasp the patterns of COVID-19 spread, mortality and morbidity, and ascertain the relationships with underlying public-health conditions and healthcare resources, socioeconomic characteristics, prevention and mitigation policies, and experiences of the Indigenous Peoples. Particular attention needs to be paid to collecting and analysing disaggregated data (regional and local), illuminating the differences between urban and rural, Indigenous and non-Indigenous communities, differences based on gender and age, understanding hot spots, outbreaks, and clusters versus COVID-19-free places, systematically assessing the impacts of anti-pandemic policies, changes in mobility, organisation of response and Indigenous knowledge.
Acknowledgments
The authors are grateful to Jonathan Voss, Petr Grin and Varvara Korkina for their help with this article. The research is supported by NSF PLR # 2034886.
Disclosure statement
No potential conflict of interest was reported by the authors.
Additional information
Funding
Notes
References
- Heleniak T. The future of the Arctic populations. Polar Geogr. 2020;1–9. DOI: https://doi.org/10.1080/1088937X.2019.1707316.
- Jungsberg L, Turunen E, Heleniak T, et al. Atlas of population, society and economy in the Arctic. 2019. Nordregio Working Paper:3. Nordregio, Stockholm.
- Young TK, Bjerregaard P. Towards estimating the indigenous population in circumpolar regions. Int J Circumpolar Health. 2019;78(1):1653749.
- Huot S, Ho H, Ko A, et al. Identifying barriers to healthcare delivery and access in the Circumpolar North: important insights for health professionals. Int J Circumpolar Health. 2019;78(1):1571385.
- Shim E, Tariq A, Choi W, et al. Transmission potential and severity of COVID-19 in South Korea. Inter J Infect Dis. 2020;93:339–344.
- Hu Z, Song C, Xu C, et al. Clinical characteristics of 24 asymptomatic infections with COVID-19 screened among close contacts in Nanjing, China. Sci China Life Sci. 2020;63(5):706–711.
- Yamagishi T, Ohnishi M, Matsunaga N, et al. Environmental sampling for severe acute respiratory syndrome coronavirus 2 during a COVID-19 outbreak on the diamond princess cruise ship. J Infect Dis. 2020;222(7):1098–1102.
- JHU. 2020. John Hopkins university and medicine coronavirus resource center (JHU CSSE COVID-19). https://coronavirus.jhu.edu/map.html
- Liu YC, Kuo RL, Shih SR. COVID-19: the first documented coronavirus pandemic in history. Biomed J. 2020. DOI:https://doi.org/10.1016/j.bj.2020.04.007
- Deiana G, Azara A, Dettori M, et al. Deaths in SARS-Cov-2 positive patients in Italy: the influence of underlying health conditions on lethality. Int J Environ Res Public Health. 2020;17(12):4450.
- Singh AK, Gupta R, Misra A. Comorbidities in COVID-19: outcomes in hypertensive cohort and controversies with renin angiotensin system blockers. Diabetes Metab Syndr. 2020;14(4):283–287.
- Arctic Council (2020). COVID-19 in the Arctic: briefing document for senior arctic officials. Arctic Council. [cited 2020 Sept 1]. Available from: https://oaarchive.arctic-council.org/handle/11374/2473
- Erber E, Beck L, De Roose E, et al. Prevalence and risk factors for self‐reported chronic disease amongst Inuvialuit populations. J Hum Nutr Diet. 2010;23:43–50.
- Murphy NJ, Schraer CD, Theile MC, et al. Hypertension in Alaska Natives: association with overweight, glucose intolerance, diet and mechanized activity. Ethn Health. 1997;2(4):267–275.
- Young TK, Broderstad AR, Sumarokov YA, et al. Disparities amidst plenty: a health portrait of Indigenous peoples in circumpolar regions. Int J Circumpolar Health. 2020;79(1):1805254.
- Parkinson A, Koch A, Evengård B. Infectious disease in the Arctic: a panorama in transition. In: The new Arctic, Evengård, B., Larsen, J. N., & Paasche, Ø. (Eds.). Cham: Springer; 2015. p. 239–257.
- Budgell A. We all expected to die: spanish Influenza in Labrador, 1918-1919. St. John’s. Newfoundland and Labrador: ISER Books; 2018.
- Doxey M, Chrzaszcz L, Dominguez A, et al. A forgotten danger: burden of influenza mortality among American Indians and Alaska Natives, 1999-2016. J Public Health Manage Pract. 2019;25:S7–S10.
- Napoleon H. Yuuyaraq: the way of the human being. Publications Centre, Centre for Cross-Cultural Studies, College of Rural Alaska, University of Alaska Fairbanks, Fairbanks, AK; 1991.
- Sköld P. Escape from catastrophe: the Saami’s experience with smallpox in eighteenth-and early-nineteenth-century Sweden. Social Sci Hist. 1997;21(1):1–25.
- Lakhani N May 14, 2020. South Dakota governor threatens to sue over Sioux’s coronavirus roadblocks: two Native American tribes are restricting entry to their territory to prevent a major outbreak but Republican Kristi Noem objects. The Guardian. Available from: https://www.theguardian.com/us-news/2020/may/14/sioux-coronavirus-roadblocks-south-dakota-governor
- Becker SR. A changing sense of place: climate and native well-being. In: Lovecraft AL, Hajo E, editors. North by 2020 perspectives on alaska’s changing social-ecological systems. Fairbanks: U of Alaska; 2011. p. 79–94.
- Driscoll DL, Dotterrer B, Brown RA II. Assessing the social and physical determinants of circumpolar population health. Int J Circumpolar Health. 2013;72(1):21400.
- Larsen JN, Fondahl G, Eds.. Arctic human development report: regional processes and global linkages. Nordic Council of Ministers, Copenhagen; 2015.
- Revich BA. Determinants of public health in Arctic and Subarctic territories of Russia. Stud Russ Econ Dev. 2017;28(1):39–47.
- Einarsson E, Larsen JN, Nilsson A, et al. Arctic human development report 2004. Akureyri, Iceland: Stefansson Arctic Institute; 2004. p. 242.
- Dicker RC, Coronado F, Koo D, et al. Principles of epidemiology in public health practice; an introduction to applied epidemiology and biostatistics. Atlanta, GA: Centers for Disease Control and Prevention; 2006.
- Polarconnection. 2020. Coronavirus observatory: tracking the pandemic in the arctic and the antarctic. [cited 2020 Jul 30]. Available from: http://polarconnection.org/coronavirus-and-the-polar-regions/
- Kamerlin SC, Kasson PM. Managing COVID-19 spread with voluntary public-health measures: sweden as a case study for pandemic control. Clinl Infect Dis. 2020. DOI:https://doi.org/10.1093/cid/ciaa864
- Office of Governor. 2020. Governor announces phase three of reopen Alaska responsibly plan. Available from: https://gov.alaska.gov/newsroom/2020/05/19/governor-announces-phase-three-of-reopen-alaska-responsibly-plan/
- Oliver N, Lepri B, Sterly H, et al. Mobile phone data for informing public health actions across the COVID-19 pandemic life cycle. Sci Adv. 2020;6(23):eabc0764.
- Google. 2020. Google mobility reports. [cited 2020 Jul 30]. Available from: https://www.google.com/covid19/mobility/
- Badr HS, Du H, Marshall M, et al. Association between mobility patterns and COVID-19 transmission in the USA: a mathematical modelling study. Lancet. 2020. DOI:https://doi.org/10.1016/S1473-3099(20)30553-3
- Indigenous Russia. 2020. The COVID 19 impact on indigenous peoples of the Russian Arctic, Siberia, and the Far East. Available from: https://indigenous-russia.com/archives/6552
- Welford MR. Geographies of plague pandemics: the spatial-temporal behavior of plague to the modern day. London-New York: Routledge; 2018.