
ABSTRACT
Aviation operations in Alaska often occur in remote locations and during inclement weather. Limited infrastructure and staff in some locations often requires aviation workers to perform tasks outside of their specific job descriptions. Researchers identified workers’ compensation claims as a valuable data source to characterise nonfatal injuries among Alaskan aviation workers. Keyword searches of injury claim narrative fields and industry codes were used to identify potentially aviation-related workers’ compensation claims during 2014–2015. These claims were manually reviewed to verify whether aviation related and manually coded according to the US Bureau of Labour Statistics’ Occupational Injury and Illness Classification System. There were 875 aviation-related injury claims accepted during 2014–2015. Ramp/baggage/cargo agents incurred the most injuries (35%), followed by mechanics/maintenance workers (15%). Among all workers, Overexertion and Bodily Reaction (40%) was most often cited as the injury event, followed by Contact with Objects and Equipment (28%), and Falls, Slips, Trips (22%). Sprains, strains, tears were the most frequent nature of injury (55%). Cargo/freight/luggage was the most frequent source of injury (24%). The 3 most frequently identified injury event types were responsible for over 90% of all injuries, which indicates that preventive interventions should be directed towards tasks rather than occupational groups.
Introduction
Over 80% of Alaska’s communities are not connected to the road system, making aviation, often described as the lifeblood of Alaska, critical to the state’s economy and livelihood [Citation1]. Commuter and air taxi operators serve as the main link to much of Alaska, transporting people, food, cargo, and mail to the more than 250 communities located off of the road system [Citation2]. Alaska has 728 public and private civilian airports, heliports, and seaplane bases registered with the Federal Aviation Administration (FAA), 4 of which are international airports in Anchorage, Fairbanks, Juneau, and Ketchikan [Citation3]. Ted Stevens Anchorage International Airport is the 2nd busiest cargo airport in the United States (US) and the 5th busiest in the world [Citation4,Citation5]. The Alaska aviation industry generates 3.5 USD billion annually and accounts for 10% of the jobs in Alaska with more than 47,000 workers employed [Citation2]. Alaska’s varied and unique operating environments mean that aviation work takes place at urban international airports, rural hub airports, and remote gravel airstrips.
Multiple studies describing aircraft crashes and related occupational fatalities in Alaska have been published [Citation6–14]. During 2000–2015, more than 1/3 of all commuter and air taxi crashes in the US took place in Alaska. These crashes occurred in small aircraft (9 passenger seats or fewer) typically used in commercial aviation operations in Alaska [Citation15]. The occupational fatality rate for pilots in Alaska during this time was 183 per 100,000 pilots per year, almost 50 times the mortality rate for all US workers during that period. However, pilots only comprise a small percentage of the aviation workforce. There are approximately 20 workers involved in the preparation of an average 37-seat regional flight in Alaska, with only 3 being crewmembers onboard the aircraft during flight [Citation16]. Examples of other workers involved directly in servicing the aircraft are ramp/baggage/cargo agents, fuellers, and mechanics/maintenance workers. Additionally, there are airport support staff providing janitorial services, food services, and emergency response. According to the US Bureau of Labour Statistics (BLS), workers in the air transportation industry in Alaska experienced 6.0 occupational injuries per 100 full-time equivalent workers (FTEs) in 2017, higher than the injury rates for all US air transportation workers (5.6 per 100 FTEs) and all US workers (2.9 injuries per 100 FTEs) [Citation17].
The purpose of this study was to characterise nonfatal injuries among aviation-related workers in Alaska to prioritise injury prevention efforts and guide intervention research. Understanding these injuries and the circumstances in which they occur is particularly complex because of the unique ways in which the aviation industry operates in Alaska. For example, some workers may perform tasks that are considered outside of their specific job descriptions. For instance, a pilot may be required to load and unload cargo and luggage at a village airstrip.
Our study builds upon previous research which used trauma registry data to characterise work-related hospitalised nonfatal injuries in Alaska’s aviation industry [Citation16]. The use of workers’ compensation (WC) data allows us to identify and characterise a comprehensive range of work-related nonfatal injuries including less severe injuries that do not result in hospitalisation and were therefore not captured in the previous study [Citation16,Citation18]. Although WC data is primarily collected for administrative purposes, it has also been used effectively for occupational injury surveillance [Citation19,Citation20]. The majority of workers in Alaska are covered by WC and claims can be filed for any injury related to working conditions [Citation21].
Methods
Data sharing agreement
A memorandum of understanding was signed between the State of Alaska Department of Labour and Workforce Development, Division of Workers’ Compensation and the National Institute for Occupational Safety and Health (NIOSH) to share WC data for the years 2014–2015. The claims data provided is maintained at the NIOSH Centre for Workers’ Compensation Studies (CWCS) in Cincinnati, Ohio.
Alaska Workers’ Compensation System
The Alaska Workers’ Compensation Act is administered by the Division of Workers’ Compensation and provides injured workers with benefits for work-related injuries and illnesses. Under this act, employees are required to notify their employer within 30 days of injury or onset of illness. Subsequently, the employer must electronically submit a claim to the Alaska Division of Workers’ Compensation within 10 days of being notified of the injury or illness. While primarily covering workers residing in Alaska, some employees working outside of the state may be eligible for Alaska WC benefits [Citation18].
Injury claims information
Injury claims included information regarding the employer, employee, and the injury. Variables used in the analysis included the 6-digit North American Industrial Classification System (NAICS) code of the employer’s industry, and the 2-digit Workers Compensation Insurance Organisations (WCIO) coded injury characteristics, including body part injured (e.g., 35 = “hand,” 42 = “lower back area”), nature of injury (e.g., 28 = “fracture,” 52 = “strain or tear”), and cause of injury (e.g., 56 = “lifting,” 69 = “stepping on sharp object”) [Citation22]. Additional information included claim acceptance status, employee demographics, the date of injury, the city in which the injury occurred, and a free-text injury narrative.
Case definition and identification
For inclusion in this study, claims had to meet the following criteria: accepted for compensation; represent a nonfatal traumatic injury; the employee worked for an airline, at or for an airport, or in support of the aviation industry; and was performing work-related duties when injured. This aligned with workers’ compensation policy in Alaska allowing compensation “only for injuries which arise out of and occur during the course of and scope of your employment” [Citation21]. An example of an accepted claim included in this study would be if an on-duty flight attendant who slipped, fell, and was injured while walking in the airport parking lot. An example of an accepted claim that was not included in this study would be a flight attendant slipping, falling, and being injured at a hotel during a stopover, as this individual would not have been performing work-related duties. Potential aviation-related claims were identified using keyword searches of the narrative field, aviation-specific NAICS codes (e.g., NAICS code 481*, 611,512), and NAICS codes of industries likely to occur in an aviation setting (Appendix A) [Citation23]. NAICS codes and keywords from the previously published Alaska Trauma Registry study were used as these NAICS codes and keywords were determined to be sufficiently broad to identify as many relevant claims as possible [Citation16]. Potential claims were then manually reviewed independently by 2 reviewers to determine if aviation-related. A third reviewer adjudicated all claims where there was disagreement.
Coding and data analysis
The claims dataset provided information on employees’ occupations in the form of open-entry text fields, which were reviewed by 2 researchers and manually coded into 10 occupational groups (pilot; mechanics/maintenance worker; flight attendant; ramp/baggage/cargo agent; customer service agent/administrative flight support worker; fueller; medical, police, or fire personnel; management staff; airport food service worker; and other/unknown). Using the injury narrative and WCIO injury codes, the injuries were independently coded by 2 researchers according to the BLS Occupational Injury and Illness Classification System (OIICS) [Citation24]. The variables coded using OIICS were: Nature of Injury (e.g., 1232 = “sprains”), Part of Body Affected (e.g., 322 = “thoracic region”), Source (e.g., 2153 = “suitcases, baggage, luggage”), and Event or Exposure (e.g., 7111 = “overexertion in lifting – single episode”). Each claim was assigned only 1 code for each OIICS variable except for Source of Injury. While most claims had only 1 Source of Injury code, up to 2 Source of Injury codes were assigned to each injury claim. Source of Injury statistics are reported as a percentage of claims with at least 1 Source of Injury code, not as a percentage of the total number of Sources of Injury. Results were reported from the OIICS Division (1-digit) to the code (most detailed, up to 4-digit). Age at time of injury was calculated by subtracting the claimant’s date of birth from the date of injury. All data analyses were performed using Stata IC 14.2 [Citation25].
Results
During 2014–2015, a total of 38,111 claims were submitted to the Alaska Division of Workers’ Compensation, 875 of which we identified as accepted aviation-related nonfatal injury claims. By industry, the majority of these aviation-related claims were in Air Transportation (607; 69%: NAICS 481*) and Support Activities for Aviation (182; 21%: NAICS 488*). By occupational group, the highest number of aviation-related claims were among ramp/baggage/cargo agents (291; 35%), followed by mechanics/maintenance workers (125; 15%), customer service/administrative flight support workers (101; 12%), and pilots (81; 10%). There were 46 workers of unknown occupation and these claims were not included when comparing across occupational groups.
The median age of injured workers was 42.5 years (16–78 years). Males made up the majority of claimants (605; 69%). However, there were some occupational groups with more claims among females than males. For flight attendants, 88% of claims were among females (68 of 77), for customer service/administrative flight support workers, 88% of claims were among females (89 of 101), and for food service workers, 56% of claims were among females (24 of 43). Most injuries occurred in Anchorage (598; 69%), followed by Juneau (48; 6%), Fairbanks (43; 5%), and Ketchikan (37; 4%). Five injuries occurred outside of the state with claims filed and accepted in Alaska in accordance with the Alaska Workers’ Compensation Act.
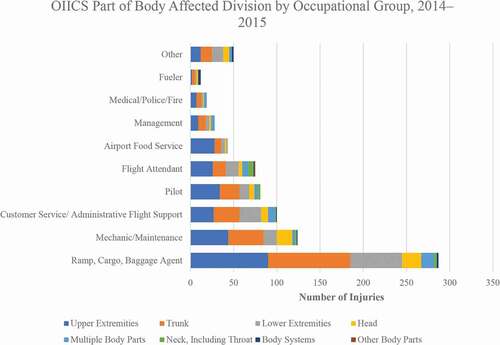
OIICS classifications were generally similar across occupational groups. The most frequent injury Event or Exposure type was Overexertion and Bodily Reaction (318; 40%), followed by Contact with Objects and Equipment (219; 28%), and Falls, Slips, Trips (176; 22%) (). These 3 injury Event or Exposure types were the top 3 for all occupational groups except flight attendants and fuellers. Sprains, strains, tears was the most common Nature of Injury, both overall (448; 55%) and for each of the occupational groups. The percentage of injuries that were Sprains, strains, tears ranged from 35% for airport food service workers to 71% for flight attendants (). The Upper Extremities (were the most frequently injured body parts (279; 34%), followed by the Trunk (244; 28%), and the Lower Extremities (150; 18%) (). Percentages across occupational groups were generally similar, although, fuellers had a high percentage of injuries to Body Systems (3; 25%). The most frequent Source of Injury overall was cargo/freight/luggage (170; 24%), which was a Source of Injury among all occupational groups except for fuellers (). Aircraft was the most frequent source of injury among flight attendants (26; 38%).
Table 1. Frequency and percentage of occupational injury and illness classification source and secondary source by occupational group
Figure 1. Frequency of occupational injury and illness classification system event or exposure division by occupational group. OIICS event or exposure division: overexertion and bodily reaction: 7; Contact with objects and equipment: 6; Falls, slips, trips: 4; Transportation incidents: 2; Exposure to harmful substances or environments: 5; Violence and other injuries by persons or animals: 1; Fires and explosions: 3
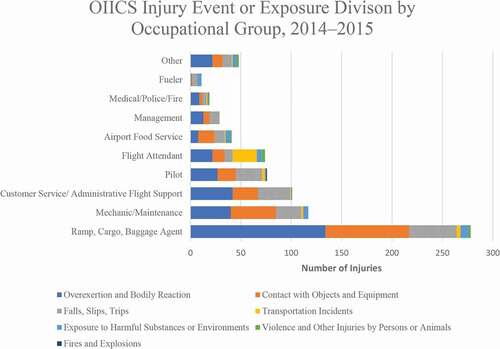
Figure 2. Frequency of occupational injury and illness classification system nature of injury by occupational group. OIICS nature of injury codes: sprains, strains, tears: 123*; Bruises, contusions: 143; Pain, inflammation, and irritation: 1972, 1973, 1974, 1978, 1979; Cuts, lacerations and Puncture wounds, except gunshot wounds: 132, 133; Fractures: 111, 183*; All other codes
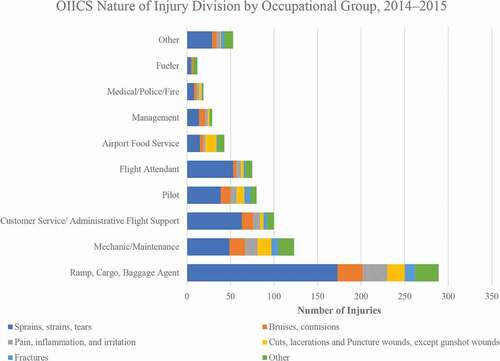
Figure 3. Frequency of occupation injury and illness classification system part of body affected division by occupational group. OIICS part of body affected division: upper extremities: 4; Trunk: 3; Lower extremities: 5; Head: 1; Multiple body parts: 8; Neck, including throat: 2; Body systems: 6; Other body parts: 9
Overexertion and Bodily Reaction injury events most frequently resulted in Sprains, strains, tears (292; 88%). The body parts most frequently injured in Overexertion and Bodily Reaction injuries were Trunk (168; 51%), Upper Extremities (101; 31%), and Lower Extremities (43; 13%). The top sources of injury among Overexertion and Bodily Reaction injuries were cargo/freight/luggage (132; 46%) and Bodily motion or position (67; 24%). This was the case for 6 of the 10 occupational groups, including ramp/baggage/cargo agents and customer service/administrative flight support workers.
Contact with Objects and Equipment most often led to Cuts, lacerations, and Puncture wounds, except gunshot wounds (73; 30%); Bruises, contusions (65; 27%); Sprains, strains, tears (36; 15%), and Pain, inflammation, and irritation (20; 8%). Contact with Objects and Equipment also resulted in 16 Fractures (7%). Body parts most frequently injured as a result of Contact with Objects and Equipment event types were the Upper Extremities (124; 52%), Head (51; 21%), and Lower Extremities (51; 21%). Of the injuries to the Upper Extremities, most were to the Hand(s) (101; 81%). The most common sources of injury among Contact with Objects and Equipment injuries were cargo/freight/luggage (38; 19%), “other” (30; 15%), vehicle parts (26; 13%), non-powered hand tools (21; 11%), and aircraft (19; 10%).
Most Falls, Slips, Trips were Falls on the same level (99; 54%), followed by Falls to a lower level (36; 20%), Slip or trip without fall (36; 20%), and a Fall, slip, trip, unspecified (12; 7%). The most frequent natures of injury among Falls, Slips, Trips were Sprains, strains, tears (93; 52%); bruises, contusions (31; 17%); pain, inflammation, and irritation (29, 16%); and Fractures (17; 9%). The most frequently injured body parts as a result of Falls, Slips, Trips were the Lower Extremities (53; 29%), Trunk (45; 25%), and Upper Extremities (41; 23%). The most frequent sources of injury were floor/stairs/ground (102; 59%), ice/sleet/snow (52; 30%), Bodily motion or Position (37; 21%), and aircraft (21; 12%).
Though the injury patterns across occupational groups were generally similar, there are some differences. The most frequent injury event type among flight attendants was Transportation Incidents (24; 32%), with 13 of these injuries caused by turbulence while in flight (). Flight attendants also experienced the highest percentage of injuries due to Sprains, strains, tears (53; 71%), primarily due to Overexertion and Bodily Reaction (22; 42%) and Transportation Incidents (19; 37%). Although Falls, Slips, Trips was the 3rd most frequent injury event overall, it was the most frequent among fuellers (5; 45%). The 2nd most frequent injury event among fuellers was Exposure to Harmful Substances or Environments (4; 36%), 3 of which were exposures to aviation fuel that affected Body Systems.
Discussion
This study identified 3 injury event types responsible for over 90% of injuries in aviation-related workers in Alaska. These injury event types were Overexertion and Bodily Reaction, Contact with Objects and Equipment, and Falls, Slips, Trips. Injury patterns were generally similar across occupational groups. These 3 injury event types were also identified as the top hospitalised injury events by Case et al. [Citation16], but in that previous research falls were the most frequent, followed by struck by/caught between and overexertion injuries [Citation16]. The different order of frequency is likely explained by the different inclusion criteria for each study, with the Alaska Trauma Registry requiring hospitalisation for inclusion as a case. The similarities between studies indicate that industry focus on reducing these 3 injury events could result in a significant reduction of injuries among aviation-related workers.
Overexertion and bodily reaction
Overexertion and Bodily Reaction was the most frequent injury event observed in our study. These injuries were typically Overexertion involving outside sources. Overexertion and Bodily Reaction injuries most often resulted in Sprains, strains, tears to the Trunk and Upper Extremities. In our study, cargo/freight/luggage was the most frequent source of Overexertion and Bodily Reaction injuries and was a source of injury among all occupational groups except fuellers. Previous research has identified cargo/freight/luggage and bodily position as sources of overexertion injuries, but only among ramp/baggage/cargo agents [Citation26–29]. Potential interventions to address Overexertion and Bodily Reaction Injuries include both administrative and engineering controls [Citation26,Citation28]. Potential administrative controls include implementation of strict baggage weight standards and visibly tagging all items that exceed a weight threshold [Citation28]. Engineering controls could include the introduction of lift-assistance devices where feasible in the cargo/freight/luggage handling chain [Citation26]. These devices, such as vacuum-assisted lifting devices and automatic baggage moving systems, have been shown to decrease spinal load imposed on workers who lift heavy objects [Citation27,Citation30–33]. Based on the results in this study, cargo/freight/luggage is a source of injury across many occupations. Therefore, all occupational groups that interact with cargo/freight/luggage in any capacity should be provided with appropriate preventive interventions. Bodily motion or position was the 2nd most frequent source of Overexertion and Bodily Reaction injuries and was a source of injury among all but 2 occupational groups. Typical Bodily Motion or Position injury narratives cited bending over or being placed in an awkward position to complete a task.
Contact with objects and equipment
The 2nd most frequently observed injury event observed in our study was Injuries resulting from Contact with Objects and Equipment. All occupational groups experienced at least 1, with the most occurring among ramp/baggage/cargo agents, mechanics/maintenance workers, and customer service/administrative flight support workers. An example of a typical injury narrative was, “stabbed in hand by sharp object in a duffle bag while pushing duffle bag into cargo hold on aircraft.” Similar to the Overexertion and Bodily Reaction Injuries, the most common source of injury for Contact with Objects and Equipment was cargo/freight/luggage. However, injuries resulting from Contact with Objects and Equipment were more evenly distributed across a number of sources, highlighting the need for the development and implementation of a range of interventions. There is limited information on preventing injuries due to Contact with Objects and Equipment in the aviation industry, however, some prevention strategies implemented in construction are applicable. These often include wear of proper personal protective equipment (PPE), guarding of machines and equipment, and ensuring materials are secured during maintenance and operations [Citation34]. Evaluation of work tasks is needed to identify the appropriate interventions. The most frequently injured body part was the Hand(s) with injury narratives typically referencing cuts and pinches, indicating hand protection may be a necessary component of an appropriate intervention.
Falls, slips, trips
Falls, Slips, Trips were the 3rd most frequent injury event. All occupational groups experienced at least 1 injury due to Falls, Slips, Trips. They most frequently led to Sprains, strains, tears but were also the most frequent cause of fractures. Case et al.’s [Citation16] study of the Alaska Trauma Registry found that Falls, Slips, Trips were the most common injury event among aviation workers hospitalised for work-related injuries, with most resulting in fractures [Citation16]. Both studies indicate that Falls, Slips, Trips frequently result in serious injury and warrant special attention when developing interventions. Companies should evaluate potential fall hazards for employees in specific work environments, such as falls from height when working on an aircraft or ice/sleet/snow on walkways for workers on the ground.
Unique circumstances
This research identified 2 occupational groups with unique injuries: flight attendants and fuellers. Not surprisingly, injuries due to turbulence occur much more frequently among flight attendants than in other occupational groups. We identified 13 injuries from turbulence among flight attendants in this study. It is estimated that flight attendants are 12 times more likely to be injured during turbulence than passengers [Citation35]. Reasons for this include unexpected turbulence during cabin service and moving throughout the cabin during turbulence to ensure passengers’ compliance with seatbelt announcements [Citation36]. A 1982 study found 30% of turbulence-related injuries to flight attendants occurred while they were in the aisle, and 21% of their turbulence-related injuries were serious injuries [Citation37]. A 2001 study found 46% of turbulence-related injuries among flight attendants resulted in serious injury [Citation38]. Research efforts to better forecast turbulence are ongoing [Citation39–41]. Enhanced communication and coordination with flight crew and staying seated with seatbelts fastened are effective measures to limit injuries to flight attendants during encounters with turbulence [Citation42,Citation43].
Only 12 injuries to fuellers were identified in this study, but aviation fuel exposure accounted for a quarter of those. Injuries to fuellers have been documented in the past, though the circumstances of these injuries were not reported [Citation16,Citation29]. Fuellers can be exposed to aviation fuel through 3 routes: dermal, oral, and inhalation [Citation44]. There have been few reliable studies on exposures to aviation fuel, but potential health effects are dermatitis, liver damage, difficulty breathing, and nausea, among others [Citation45]. Appropriate personal protective equipment not permeable to aviation fuel is a potential way to reduce fuellers’ exposure [Citation44].
Limitations
Use of WC claims data for occupational safety research is subject to a number of limitations. It is well documented that WC data likely undercounts the true number of injuries due to underreporting [Citation46–49]. Employees may not file claims for a variety of reasons, including lack of knowledge of WC coverage, misunderstanding the filing process, or fear of retribution [Citation19,Citation20,Citation46–49]. In this study specifically, data quality and completeness varied greatly from claim to claim, resulting in missing information for some variables, and potential misclassification of some injuries. A lack of detail in injury narratives may have led to some relevant claims not being included in this analysis. Performing searches using both aviation-related NAICS codes and a broad range of keywords should have captured the majority of aviation-related claims. However, any claims reported using non-aviation-related NAICS codes, such as temporary employment agencies (NAICS 5613), would not have been captured if it could not be determined from the available information that the work was being performed in support of the aviation industry. The occupation categories in our study did not directly align with those defined in the Alaska Department of Labour and Workforce Development’s Occupational Database, which would serve as denominator data for rate calculations [Citation50]. We were therefore unable to calculate injury rates, which prevented analysis of injury risk among occupational groups. Alignment of occupational categories with denominator data will be a priority in future studies to allow for the calculation of injury rates among occupations. Finally, while we categorised the employee’s occupation based on the occupation and injury narrative fields, given the nature of the aviation industry in Alaska, these discrete occupational categories may not be truly representative of all the tasks these workers perform.
Conclusions
The case definition and methodology used in this study provided for an in-depth description of the range of injuries occurring in aviation-related settings in Alaska. Use of WC data allowed us to expand upon the Case et al. study of work-related hospitalised nonfatal injuries in Alaska’s aviation industry to include less severe work-related injuries [Citation16]. Not all aviation-related workers in Alaska are employed at companies with aviation-related NAICS codes. Therefore, using both NAICS codes and keywords allowed us to expand the scope of this study to include workers such as airport food service workers and first responders. Where sufficient data is available, a similar methodology could be applied to other aviation populations outside of Alaska.
These findings will guide future research activities that will characterise the work environment and provide additional information on injuries occurring in the aviation industry in Alaska. One such research activity already underway is the development of a survey instrument to be administered to employees at aviation companies that will be used to better understand reporting of injuries to the WC system, the circumstances surrounding injuries experienced at work, and tasks workers are expected to perform. This will provide greater context for work tasks, the work environment, and the hazards faced by workers.
Disclosure statement
No potential conflict of interest was reported by the authors.
Additional information
Funding
References
- Alaska Department of Transportation and Public Facilities. Statewide aviation [ Internet]. Juneau, AK: Alaska Department of Transportation & Public Facilities; n.d. [cited 2019 June 28]. Available from: http://dot.alaska.gov/stwdav/index.shtml
- Alaska Department of Transportation and Public Facilities. Alaska airports and aviation 2017 annual report [ Internet]. Juneau, AK: Alaska Department of Transportation & Public Facilities; 2017 [cited 2019 June 28]. Available from: http://dot.alaska.gov/documents/aviation/2017Annual_Report.pdf
- Federal Aviation Administration. Airport data and contact information [ Internet]. US Department of Transportation, Federal Aviation Administration; 2018 [cited 2019 June 28]. Available from: https://www.faa.gov/airports/airport_safety/airportdata_5010/
- Federal Aviation Administration. CY 2017 final all-cargo landed weights, rank order [ Internet]. Washington (DC): US Department of Transportation, Federal Aviation Administration; 2018 [cited 2019 June 28]. Available from: https://www.faa.gov/airports/planning_capacity/passenger_allcargo_stats/passenger/media/cy17-cargo-airports.pdf
- Alaska Department of Transportation and Public Facilities. Alaska international airports system: connecting nations one stop at a time to improve the bottom line [ Internet]. Juneau (AK): Alaska Department of Transportation and Public Facilities; n.d. [cited 2019 June 28]. Available from: http://dot.alaska.gov/aias/assets/ANC_FAI_Facts_Information.pdf
- Garrett LC, Conway GA, Manwaring JC. Epidemiology of work-related aviation fatalities in Alaska, 1990–94. Aviat Space Environ Med. 1998 Dec;69(12):1131–10.
- Lincoln JM, O’Connor MB, Retzer KD, et al. Occupational fatalities in Alaska: two decades of progress, 1990–1999 and 2000–2009. J Safety Res. 2013 Feb;44:105–110.
- O’Connor MB, Lincoln JM, Conway GA. Occupational aviation fatalities—Alaska, 2000–2010. MMWR Morb Mortal Wkly Rep. 2011;60(25):837–840.
- Middaugh J. Epidemiology of injuries in northern areas. Arctic Med Res. 1992;51:5–14.
- Schnitzer PG, Bender TR. Surveillance of traumatic occupational fatalities in Alaska—implications for prevention. 433021. 1992 Jan;107(1):70.
- Centers for Disease Control and Prevention. Risk for traumatic injuries from helicopter crashes during logging operations–southeastern Alaska, January 1992–June 1993. MMWR Morb Mortal Wkly Rep. 1994 July;43(26):472.
- Centers for Disease Control and Prevention. Work-related aviation fatalities—Alaska, 1990–1994. MMWR Morb Mortal Wkly Rep. 1997 June;46(22):496.
- Centers for Disease Control and Prevention. Factors associated with pilot fatalities in work-related aircraft crashes—Alaska, 1990–1999. MMWR Morb Mortal Wkly Rep. 2002 Apr;51(16):347.
- McLaughlin J. Fatal aviation crashes in Alaska—a need for renewed caution and diligence [ Internet]. Anchorage (AK): Alaska Department of Health and Social Services, Division of Public Health; Sep 2010 [cited 2019 June 28]. Available from: http://www.epi.alaska.gov/bulletins/docs/b2010_30.pdf
- National Institute for Occupational Safety and Health. Aviation safety research program [ Internet]. Washington (DC): US Department of Health and Human Services, Centers for Disease Control and Prevention, National Institute for Occupational Safety and Health; 2018 [cited 2019 June 28]. Available from: https://www.cdc.gov/niosh/topics/aviation/default.html
- Case SL, Moller KM, Nix NA, et al. Work-related nonfatal injuries in Alaska’s aviation industry, 2000–2013. Saf Sci. 2018 Apr;104:239–245.
- Bureau of Labor Statistics. Incidence rates per 100 full-time workers for total nonfatal occupational injuries and illnesses by sector, Alaska and all USA. Washington (DC): US Department of Labor, Bureau of Labor Statistics; 2018 [cited 2019 June 28].
- Omnibus workers ‘compensation of 2018 [ statute on the Internet]. 2018c. Available from: http://www.akleg.gov/basis/Bill/Detail/30?Root=HB%20%2079
- Utterback DF, Meyers AR, Wurzelbacher SJ. Workers’ compensation insurance: a primer for public health. 2014.
- Utterback DF, Schnorr TM. Use of workers’ compensation data for occupational injury & illness prevention. Washington (DC): Department of Health and Human Services, Centers for Disease Control and Prevention, National Institute for Occupational Safety and Health; 2010 May.
- Alaska Department of Labor and Workforce Development. Workers’ compensation and you: information for injured workers [ Internet]. Juneau (AK): Alaska Department of Labor and Workforce Development; 2013 [cited 2019 June 28]. Available from: http://labor.alaska.gov/wc/wc-and-you.htm
- Workers Compensation Insurance Organizations. Injury description table—part/nature/cause. Philadelphia (PA): Workers Compensation Insurance Organization; 2010.
- Department of Commerce. North American industry classification system. Washington (DC): US Department of Commerce; 2012.
- Bureau of Labor Statistics. Occupational injury and illness classification system, version 2.01. Washington (DC): US Department of Labor, US Bureau of Labor Statistics; 2014.
- StataCorp. Stata statistical software: release 14. College Station (TX): StataCorp LP; 2015.
- Dell G. Airline baggage handler back injuries: a survey of baggage handler opinion on causes and prevention. Saf Sci Monit. 1998;2(2):1–12.
- Korkmaz SV, Hoyle JA, Knapik GG, et al. Baggage handling in an airplane cargo hold: an ergonomic intervention study. Int J Ind Ergon. 2006 Apr;36(4):301–312.
- Tapley S, Riley D. Baggage handling in narrow-bodied aircraft: identification and assessment of musculoskeletal injury risk factors. In: East and South East Specialist Group, editor. Health and safety executive, Bootle, England. 2005 Jan, Pages 5-7 & 23. .
- Grabowski JG, Baker SP, Li G. Ground crew injuries and fatalities in US commercial aviation, 1983–2004. Aviat Space Environ Med. 2005 Nov;76(11):1007–1011.
- National Institute for Occupational Safety and Health. Reducing musculoskeletal disorders among airport baggage screeners and handlers. By Lu M, Afanuh S, Dick R, Werren D, Waters T. Cincinnati (OH): US Department of Health and Human Services, Centers for Disease Control and Prevention, National Institute for Occupational Safety and Health; 2015.
- Owen BD. Preventing injuries using an ergonomic approach. AORN J. 2000 Dec;72(6):1031–1036.
- Tafazzol A, Aref S, Mardani M, et al. Epidemiological and biomechanical evaluation of airline baggage handling. Int J Occup Saf Ergon. 2016 Apr;22(2):218–227.
- Lu ML, Dufour JS, Weston EB, et al. Effectiveness of a vacuum lifting system in reducing spinal load during airline baggage handling. Appl Ergon. 2018 Jul;70:247–252.
- Occupational Safety and Health Administration. Struck-by construction eTool [ Internet]. Washington (DC): US Department of Labor, Occupational Safety and Health Administration; [cited 2019 Sep 12]. Available from: https://www.osha.gov/SLTC/etools/construction/struckby/mainpage.html
- Agampodi SB, Dharmaratne SD, Agampodi TC. Incidence and predictors of onboard injuries among Sri Lankan flight attendants. BMC Public Health. 2009 Dec;9(1):227.
- Griffiths RF, Powell D. The occupational health and safety of flight attendants. Aviat Space Environ Med. 2012 May;83(5):514–521.
- Pollard DW, Folk ED, Chandler RF. Flight attendant injuries: 1971–1976. Washington (DC): US Department of Transportation, Federal Aviation Administration, Office of Aviation Medicine; 1982 Jan.
- Tvaryanas AP. Epidemiology of turbulence-related injuries in airline cabin crew, 1992–2001. Aviat Space Environ Med. 2003 Sep;74(9):970–976.
- Chun HY, Kim JH, Lee DB, et al. Research collaborations for better predictions of aviation weather hazards. Bull Am Meteorol Soc. 2017 May;98(5):ES103–7.
- Sharman RD, Pearson JM. Prediction of energy dissipation rates for aviation turbulence. Part I: forecasting nonconvective turbulence. J Appl Meteorol Climatol. 2017 Feb;56(2):317–337.
- Golding WL. Turbulence and its impact on commercial aviation. J Aviat/Aerosp Educ Res. 2000;11(2):8.
- Federal Aviation Administration. Advisory Circular: preventing injuries caused by turbulence [ Internet]. Washington (DC): US Department of Transportation, Federal Aviation Administration; 2007 Nov [cited 2019 June 28]. Available from: https://www.faa.gov/documentLibrary/media/Advisory_Circular/AC_120-88A_CHG_1.pdf
- Mokadam D. Flight attendants injured at four times overall U.S. industry rate. New York (NY): Air Safety Week; 2003 Feb.
- National Research Council. Toxicologic assessment of jet-propulsion fuel 8. Washington (DC): National Academies Press; 2003 Feb.
- Risher J, Faroon O, Llados F, et al. Toxicological profile for JP-5, JP-8, and Jet A fuels. Atlanta: US Department of Health and Human Services, Public Health Service, Agency for Toxic Substances and Disease Registry; 2017 Mar.
- Azaroff LS, Levenstein C, Wegman DH. Occupational injury and illness surveillance: conceptual filters explain underreporting. Am J Public Health. 2002 Sep;92(9):1421–1429.
- Fan ZJ, Bonauto DK, Foley MP, et al. Underreporting of work-related injury or illness to workers’ compensation: individual and industry factors. J Occup Environ Med. 2006 Sep;48(9):914–922.
- Qin J, Kurowski A, Gore R, et al. The impact of workplace factors on filing of workers’ compensation claims among nursing home workers. BMC Musculoskelet Disord. 2014 Dec;15(1):29.
- Shannon HS, Lowe GS. How many injured workers do not file claims for workers’ compensation benefits? Am J Ind Med. 2002 Dec;42:467–473.
- Alaska Research and Analysis. Alaska occupational database, worker counts [ Internet]. Juneau (AK): Alaska Department of Labor and Workforce Development; 2017 Aug [cited 2019 Sep 12]. Available from: http://live.laborstats.alaska.gov/odb/odb.cfm
Appendix A.
NAICS codes searched
115*, 23*, 32621*, 3332*, 3334*, 3339*, 3345*, 3361*, 3362*, 3363*, 336411, 336412, 336413, 336414, 336415, 336419, 4247*, 4412*, 481*, 487*, 488*, 531*, 5324*, 533*, 5413*, 5615*, 5617*, 6114*, 6115*, 722*, 8114*, 926*, 927*
Note: Any code with * indicates that all codes beginning with those digits were included in the search.
Keywords searched
Agent, Air*, Attendant, Aviation, Bag, Cabin, Cargo, Carrier, Cockpit, Flight, Fly, Fuel, Gate, Ground, Handler, Hangar, Heli*, Helo, Jet, Luggage, Maintenance, Mechanic, Pilot, Plane, Ramp, Stewardess
Note: Any keyword with * indicates that all words beginning with those letters were included in the search.
Table A1. Frequency and percentage of OIICS injury event type by occupational group