
ABSTRACT
We evaluated the survival of a subarctic population and the significance of traditional risk factors for mortality, causes of death and their seasonal variation from the period of 1984–2014. By the end of 2014 (follow-up), 644 (34.4% from 1,869) participants had died (42.1% of cardiovascular causes, 22.4% of neoplastic diseases). The average age at death±SD was 74.6±11.4 years for women (n=284) and 70.2±12.0 years for men (n=360). After adjusting for baseline age, the major risk factors predicting death were male sex (hazard ratio [HR] 1.80; 95% confidence interval [CI] 1.54–2.10), current smoking (HR 1.85; 95% CI 1.58–2.17), obesity (HR 1.75; 95% CI 1.45–2.12), high blood pressure (HR 1.46; 95% CI 1.24–1.72), cardiovascular disease (HR 1.62; 95% CI 1.36–1.93) and depression (HR 1.61; 95% CI 1.21–2.14) at baseline.
The most common causes of death and the main risk factors predicting death in this population were the same as reported globally. Lifestyle factors had an important impact in predicting survival. The most common causes of death were the same for men and women. There was no significant difference in overall mortality rate between winter and summer, but cerebrovascular and pulmonary causes of death were more common during winter.
Introduction
In 2016, as many as 54% of the 56.9 million deaths worldwide were due to the top 10 causes with the top 2 (ischaemic heart disease and stroke) together accounting for 15.2 million deaths [Citation1,Citation2]. Among non-communicable diseases, the next most common causes of death were chronic obstructive pulmonary disease, lung cancer, diabetes and dementia. Deaths due to diabetes and dementia markedly increased from the year 2000 to 2016 [Citation1].
In Finland, the most common causes of death in 2017 were cardiovascular diseases, followed by neoplastic disorders, dementia, injuries and respiratory diseases [Citation3]. However, little is known about the factors resulting in death in a rural, subarctic district.
We evaluated the survival rate of a subarctic (Muonio–Enontekiö, Finland) population and the significance of traditional cardiovascular, including social and lifestyle-related, risk factors for all-cause mortality, causes of death and their seasonal variation, (the follow-up time was 31 years). This population differs in many respects from the main Finnish population living in the Southern Finland. Number of people in the Muonio–Enontekiö district in 1984 earned their living by physical labour, such as by agriculture, forestry, reindeer herding and hunting. There are also cultural and genetic differences compared to the main population in Finland. The ethnic Sámi people comprised about 9% of the study population [Citation3]. The education level of the population is low and the geographic area (150–400 km above the Arctic Circle) is large (10,431 km2) and sparsely populated (4,145 inhabitants: 0.4–0.5 inhabitants/km2). Distances from remote villages to health stations can be over 100 km, and no public transportation is available.
The Muonio–Enontekiö District is located between the Norwegian and Swedish borders. The climate is harsh: The mean annual average temperature is as low as −2°C [Citation4]. During summer the sun does not set for weeks, while in winter, it does not rise for about the same period. The environment is the cleanest in the world based on the World Health Organization Follow-up Report 2008–2014 [Citation5].
Materials and methods
Study design and participants
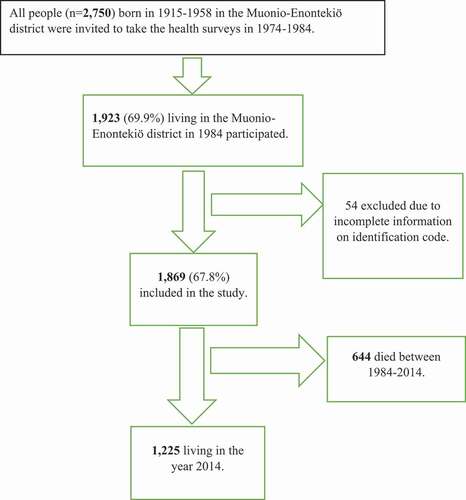
The study cohort (see ) consisted of the population born between 1915 and 1958 living in the Muonio–Enontekiö district of Northern Finland and participating in health surveys between 1974 and 1984. Of the 2,750 individuals invited to health survey 1,923 (69.9%) agreed. Due to incomplete information on identification code, 54 participants were excluded from the analysis thus leaving 1,869 participants who were included in this study. The baseline characteristics of the study population were collected between 1974 and 1984.
Figure 1. Flow chart of the Muonio–Enontekiö district study population
Health survey
Health check-ups and blood samplings for laboratory analyses were conducted by trained primary healthcare nurses at Muonio–Enontekiö Health Centre between 1974 and 1984. The nurses also provided information on lifestyle interventions to the study participants and sent them for a general practitioner consultation if needed.
The surveys included a self-administered questionnaire, a clinical examination, and blood sampling. The questionnaire asked about marital status, education level, chronic diseases, medications, smoking habits, physical activity and consumption of alcohol, coffee and fish.
In the clinical examinations, each participant´s weight (without shoes and with light underwear) was measured in kilograms using a personal scale (SECA, Espoo, Finland), and height was measured in centimetres using a wall scale. Body mass index (BMI) was calculated based on the measured height and weight (in kg/m2). Participants with a BMI of at least 30 kg/m2 were classified by the WHO definition as obese [Citation6]. Blood pressure was measured with a mercury manometer (Erka, Germany) and classified as normal (systolic blood pressure <140 mmHg and diastolic <90 mmHg) or high (systolic at least 140 mmHg and/or diastolic at least 90 mmHg) [Citation6].
Blood samples for laboratory analyses were taken after an overnight fast. Serum total cholesterol was analysed in the laboratory of Muonio Health Centre by photometer and classified into quartiles. Haemoglobin was also analysed locally by photometry (following the health centre’s regular procedures) and classified based on the current Finnish normal upper and lower limits for haemoglobin (men: 134–167 g/l and women: 117–155 g/l) [Citation7].
Smoking status was categorised as either smoker (daily smoking) or non-smoker. Consumption of alcohol was assessed by responses to the question: “Do you drink alcohol more often than once a week?” Fish eating was evaluated by asking, “Do you eat plenty of fish weekly?” Coffee drinking was determined by answers to the question: “How many cups of coffee do you drink daily?” The extent and variety of leisure time physical activities was determined. Based on weekly frequency, type of physical activity and time used for the corresponding activity, the weekly energy used for leisure time physical activities was calculated and categorised according to published Finnish data [Citation8]: physically inactive, <1000 kcal and active, at least 1000 kcal per week. Education was classified as primary school or less (≤7 years) or more than primary school (>8 years). Marital status was categorised as married or single (including unmarried, divorced and widower).
Mortality data
The total mortality data of the study cohort were gathered from 1 January 1984 up to 31 December 2014 for those participants who were alive on 1 January 1984. Data were retrieved from the Central Population Register, which keeps a record of all Finnish citizens. The causes of death were obtained from the national Cause of Death Register, maintained by Statistics Finland [Citation3].
Seasonal variation of causes of death was calculated comparing causes of death during winter (November–April) to summer (May–October). This was based on the long-term average monthly temperatures under 0ºC from the period of 1981–2010 [Citation4].
Statistical analyses
Variables are presented as means and standard deviations for continuous variables and as frequencies and proportions for categorical variables. The statistical differences in group proportions of categorised variables were analysed by Chi-squared test and differences in group means of continuous variables by t-test. Mortality rates before specific age-related cut-off points are presented in cases in which the baseline age after that cut-off point is censored. Left- and right-truncated proportional hazard Cox models were used to study the association of baseline factors with mortality. The hazard ratios (HRs) are presented as one-by-one baseline-adjusted and as a saturated model in which the HRs were adjusted for all other exposures in the model. HRs and confidence intervals (CIs) are illustrated as forest plots. The HR can be interpreted as a follow-up time risk ratio of mortality of cases having a specific exposure compared to those that do not. The risk factor specific mortality was calculated using the Kaplan–Meier method, and the log-rank test was used to estimate the significance of differences between the groups. Statistical analyses were performed using SAS 9.4 statistical package (Cary, NC) considering p<0.05 as significant.
Results
Baseline characteristics of the study population
Of the 1,869 subjects, 863 (46.2%) were men and 1,006 (53.8%) women (). The prevalence of cardiovascular disease diagnosis or medication was 17.7% (men: 18.7% and women: 16.7%), self-reported depression 8.6% (men: 7.9% and women: 9.3%), and high blood pressure 40.7% (men: 46.6% and women: 35.7%).
Table 1. Baseline anthropometric, laboratory measurements and self-reported sociodemographic and lifestyle characteristics in the Muonio–Enontekiö study population
Among the study participants who had answered the question about smoking (n=1,784), 37.6% were smokers (49.2% of men and 27.0% of women). Study participants drank an average six cups of coffee daily.
Mortality
During the 31-year follow-up (from 1984 to 2014), 644 of the participants died. Of them 55.9% (n=360) were men and 44.1% (284) were women. The mean age at death for men and women was 70.2 (SD: 12.0) and 74.6 (SD: 11.4) years, respectively. The most common cause-of-death was cardiovascular diseases in 42.1% of all deaths (men: 44.4%, women: 40.1%), followed by neoplastic diseases 22.4% (men: 22.2%, women: 20.8%), dementias 7.0% (men: 6.4%, women: 8.5%), injuries and accidents 5.3% (men: 5.8%, women: 4.2%) and respiratory diseases 4.5% (men: 2.8%, women: 5.6%).
Those participants who died had significantly higher mean total cholesterol at baseline than those who stayed alive during the follow-up (in men 7.2 (SD 1.5) mmol/l vs. 7.0 (1.4) mmol/l, p=0.049; in women 7.3 (1.6) mmol/l vs. 6.6 (1.4) mmol/l, p<0.001.
At baseline, weekly consumption of fish was significantly less common among those who died during follow-up (in men 36.8% vs. 63.2%, p=0.034, in women 23.4% vs. 76.6%, p=0.010).
Mortality among all participants before 60, 70, 80 and 90 years of age according to baseline factors is presented in . The mortality of men was higher in every ten-year age range window, i.e. before 60, 70, 80, and 90 years of age compared to the mortality of women. The mortality rates in smokers before the ages of 60, 70, 80, and 90 years were significantly greater than those in non- smokers. Obesity decreased survival before the ages of 60, 70 and 80 years. High blood pressure significantly shortened survival before 60 years of age.
Table 2. Mortality at 60, 70, 80, and 90 years of age
Those participants not living in a relationship had increased risk for mortality at the age period before 70 years. Cardiovascular disease diagnosis or medication increased mortality among the participants before 60 and 70 years of age, and self-reported depression increased mortality before 70 and 80 years of age. Use of alcohol more than once a week shortened survival in the participants before 70 and 80 years of age. The mortality of participants with high haemoglobin was significantly increased before 80 years of age. Coffee drinking had no significant effect upon survival.
Survival curves
Kaplan–Meier curves () indicate significant shortening of survival with the following risk factors: smoking, high blood pressure, male gender, obesity, cardiovascular disease or medication, and high haemoglobin.
Figure 2. Kaplan–Meier survival curves according to smoking, sex, body mass index (BMI), cardiovascular disease (CVD) or medication, haemoglobin (HB) and blood pressure (RR)
and show the left- and right-censored Cox regression model HRs for each variable adjusted one-by-one for baseline age. The following risk factors were found to significantly negatively impact on mortality risk: male sex, high blood pressure, smoking, obesity, cardiovascular disease or medication, depression, at least weekly use of alcohol for all participants, low education for all participants, leisure time physical inactivity for all participants and women, for all participants and men not living in a relationship.
Table 3a. Left- and right-censored COX-model with each variable adjusted for baseline age one by one
Figure 3. (a) Baseline age-adjusted hazard ratios (HRs) and their 95% confidence intervals (CIs) for mortality. Baseline age = Age in health service. (b) Mortality HRs and their 95% CIs adjusted for baseline age and other variables. Variables marital status, fish-eating and depression not included due to the small number of the available observations. Baseline age = Age in the health survey
HRs adjusted for baseline age and other variables based on the left- and right-censored Cox regression model are shown in and . Due to the small data subsets concerning marital status, fish consumption and depression, statistical analyses were not feasible in this model for these variables. Significant adjusted HRs were found for male sex, smoking, obesity, cardiovascular disease or medication and high blood pressure for all participants and for women and in addition for low education.
Table 3b. Cox model adjusted for baseline age and other variables in model
Seasonal proportions of death and total mortality
We found no significant seasonal difference of total mortality rate between winter and summer months. A total of 333 participants died during winter and 311 during summer. We noted 44 cerebrovascular deaths during winter (November–April) and 19 in summer (May–October) (p=0.003); correspondingly, deaths from respiratory diseases were 15 and 5 (p=0.037). Deaths from alcohol diseases and accidental injuries were more common during summer (n=10) than winter (n=3, p=0.034).
Discussion
The most common causes of death in the subarctic Muonio–Enontekiö District were the same as among the main Finnish population, namely cardiovascular and neoplastic diseases. Data from the whole of Finland in 2009 found that 40% of all deaths were from cardiovascular diseases, 23% from neoplastic diseases, 10% from dementia and 6% from injuries [Citation3]. Factors predicting all-cause mortality in our study population were male sex, smoking, obesity, high blood pressure, cardiovascular disease and/or medication, depression, not living in a relationship, low education, alcohol use, physical non-activity and high haemoglobin level.
Cardiovascular diseases have been the main cause of mortality in Finland for decades. In 2014, when follow-up of the present study ended, Finland had a population of 5,471,753 inhabitants, and the cardiovascular mortality was 19,555 people with a mortality 3–4 times higher in men than in women [Citation3]. In our study, difference of cardiovascular causes of death was not significant between men and women.
In our study, individuals with high blood pressure had increased risk for all-cause mortality compared to normotensive individuals. This finding is in line with many previous studies, e.g. the study by Strandberg et al. [Citation9].
In the present study, baseline current smoking increased the HR for mortality up to 1.85-fold. The age-adjusted mortality of smokers has also been shown to be twofold compared to non-smokers [Citation10]. In addition, smoking nearly doubled the risk of dying in middle age (35–69 years) from 24% to 42% [Citation10]. Our results are in line with previous studies from the same period.
We also showed that obesity, when adjusted for other risk factors including smoking, increased the risk of mortality, a finding in line with the study by Stokes and Preston [Citation11], who found that, among never-smokers, mortality risks were significantly higher in the overweight/obesity group.
Surprisingly, participants in the highest cholesterol quartile (≥7.8 mmol/l) did not have a significant independently increased risk of all-cause mortality. On the other hand, in a Japanese study, hypercholesterolaemia was positively associated with all-cause mortality. Moreover, a positive association was reported between total cholesterol and risk of all-cause mortality in the highest (>6.71 mmol/l) total cholesterol groups [Citation12]. The highest total cholesterol quartile in our study (≥7.8 mmol/l) was higher than that of the Japanese study. The total cholesterol levels were exceptionally high in our study, both in men and women. Based on our clinical knowledge, we can say that inhabitants of the Muonio–Enontekiö district used to eat plenty of fatty meat- and milk-products in the 1970s and 1980s, which may be at least part of the reason for their high total cholesterol.
In this present study, high haemoglobin shortened survival, with the baseline age-adjusted HR increasing 1.40-fold. We speculate that this increased mortality risk is mediated, at least in part, by metabolic syndrome. Previous studies have shown that mean haemoglobin is significantly higher in patients with metabolic syndrome [Citation13]. In addition, both cardiovascular and all-cause mortality is increased in patients with metabolic syndrome [Citation14].
Men had almost twofold higher mortality than women, which is in line with the previous meta-analyses [Citation15,Citation16]. Also in line with previous studies [Citation17], we found that low education reduced survival. Most participants had only primary school level of education. In the Muonio–Enontekiö district, there were no higher educational levels available before the year 1970.
Our finding that leisure time physical inactivity (<1000 kcal weekly energy expenditure) decreased survival is in line with the systematic review and meta-analysis from 2008 showing that physical activity reduced all-cause mortality by 33% [Citation18]. In previous decades, people in northernmost Finland did not have a habit of exercising during their leisure time. Many of the inhabitants in 1984 were living in a rural economy (agriculture, forestry, herding reindeers, hunting, fishing and gathering berries), whereas tourism has gradually increased during the 31-years follow-up.
No seasonal variation in mortality rate was found in our survey. We suppose that rather low temperatures also in summer are the cause of no seasonal difference in mortality. In the Muonio–Enontekiö district mean summer (May–October) temperature from the period of 1981–2010 was +6.1℃ and winter (November–April) −9.8℃ [Citation4]. Causes of death from cerebrovascular and pulmonary diseases were more common in winter than in summer. Ikäheimo et al. [Citation19] demonstrated that low temperatures increase deaths from cardiovascular and respiratory diseases, causing excess annual deaths in Finland. A previous study also showed that risk of sudden cardiac death was associated with cold temperatures [Citation20]. Usually, cardiovascular deaths increase during the cold season of the year [Citation21] and the same phenomenon could also be seen in our study population. The effect of cold on cardiovascular diseases have been addressed mostly in terms of short-term temporal effects, i.e. days or weeks [Citation21]. We have little knowledge of the association of long-term exposition and survival [Citation21].
In the middle of the follow-up time of our study, in 2000, the mean lifetime of Finnish men and women was 69.6 and 78.8 years, respectively [Citation3]. Life expectancy in the Arctic region overall was 74.7 years in 2012–2016 with intraregional variation: In Quebec (82.2 years) (Canada), Faroe Islands (82.1 years), as well as in Troms and Nordland (Norway), Norbotten (Sweden) and Lapland (Finland), the life expectancy was the longest. The shortest life expectancy was in Chukotka (62.8 years) (Russia) [Citation22]. Life expectancy (2016–2018) in Lapland was 80.45 years and in the whole of Finland 81.46 years [Citation3].
The strengths of the study
The main strengths of the present study are the long follow-up (31 years) and good participation rate. Our study cohort included 69.9% of the people born between 1915 and 1958 and living in the Muonio–Enontekiö district, and they had long-term exposure to cold. In 1984, there were 5,300 inhabitants (0.5 inhabitants/km2) living in the area [Citation3,Citation23].
Study limitations
The main limitation of the present study is that nearly every diagnosis concerning cause of death was based on clinical examinations at Muonio–Enontekiö Health Centre. According to contemporary clinical practice, only a few autopsies were conducted at Lapland Central Hospital or University Hospital of Oulu. Regarding cholesterol panel investigations, it is worth saying that, in 1984, it was possible to analyse only serum total cholesterol levels. Finally, we had to exclude 54 subjects because we could not identify them, and the total variable information was not available from all participants.
Conclusion
One in 10 of the target population of this study were ethnically and culturally different from the main Finnish population. They lived in the subarctic area with many unique features. Despite those differences, their most common causes of death, and the main risk factors predicting death were the same as those of the main Finnish population. Cardiovascular diseases were the leading cause of death also in the Muonio–Enontekiö district. Not only diseases but also lifestyle factors related to mortality, including social status, were similar as those of the main Finnish population. The most common causes of death did not differ between men and women, but men were more likely than women to die from cardiovascular causes, injuries and accidents. Dementia and respiratory diseases were more often diagnosed among women than men. Cerebrovascular and pulmonary deaths were more common during winter than summer. Our study confirms the seasonal variation, possibly a cold effect in cerebrovascular and pulmonary reasons of death. Our results did not differ from the national data on causes of death, in spite of the uniqueness of our study population. That finding can encourage those in subarctic regions to apply the results of clinical and epidemiological studies carried out elsewhere, and practice evidence-based medicine.
Ethical approval
The Ethics Committee of the Northern Ostrobothnia Hospital District approved the research protocol on 21 January 2013.
Acknowledgments
We would like to thank the field study team and study nurses who performed all of the clinical examinations and helped in the data collection.
Disclosure statement
No potential conflict of interest was reported by the authors.
Additional information
Funding
References
- The top 10 causes of death. World Health Organization 24 May 2018.
- Global, regional and national age-sex-specific mortality for 282 causes of death in 195 countries and territories 1980-2017: a systematic analysis for the Global Burden of Disease Study 2016. Lancet 2017 Sept 16; DOI: https://doi.org/10.1016/S0140-6736(17)32152-9.
- Statistics Finland (SVT): Mortal diagnosis: years 2000-2019. Helsinki: statistics Centre of Finland. Web:http://www.stat.fi/til/ksyyt/ksyyt/index.html. Finnish Meteorological Institute. Annual Statistics 1981-2010.
- Finnish Meteorological Institute. Annual Statistics 1981-2014.
- World Health Organization. Follow-up Report 2008-2014.
- Finnish Current Care Guidelines 2020.
- Nousiainen T. Anemiapotilaan tutkiminen. Kirjassa. In: Porkka K, Lassila R, Remes K, et al., editors. Veritaudit. Kustannus Oy Duodecim. 2015. p. 162–10.
- Fogelholm M, Vuori I, Taimela S, et al. Assessment of physical activity and exercise. Medicine of Physical Activity. 3 ed. ed. Helsinki:: Duodecim; 2005. p. 77–91.
- Strandberg TE, Salomaa VV, Vanhanen HT, et al. Blood pressure and mortality during an up to 32-year follow-up. J Hypertens. 2001;19((1)):35–39.
- Carter BD, Abnet CC, Feskanich D, et al. Smoking and Mortality – beyond Established Causes. N Engl J Med. 2015 Feb 12;372(7):631–640.
- Stokes A, Preston S Smoking and reverse causation create an obesity paradox on cardiovascular disease. Obesity (Silver Spring). 2015 Dec; 231:2485–2490. Published online 2015 Sep 30. .
- Okamura T, Tanaka H, Miyamatsu N, et al. for the NIPPON DA80 research group. The relationship between serum total cholesterol and all-cause or cause-specific mortality in a 17.3-year study of Japanese cohort. Atherosclerosis. 2007 Jan;190(1):216–223. Issue.
- Hämäläinen P, Saltevo J, Kautiainen H, et al. Erythropoietin, ferritin, haptoglobin, haemoglobin and transferrin receptor in metabolic syndrome: a case control study. Cardiovasc Diabetol. 2012 Sep 27;11(1):116.
- Lakka H-M, Laaksonen DE, Lakka T, et al. The metabolic syndrome and total and cardiovascular disease mortality in middle-aged men. JAMA. 2002;288((21)):2709–2716.
- Crimmins EM, Shim H. Zhang YS and Kim JK. Differences between Men and Women in Mortality and the Health Dimensions of the Morbidity Process. Clin Chem. 2019 Jan;65((1)):135–145.
- Manzoli L, Villari PM, Pirone G, et al. Marital status and mortality in the elderly: a systematic review and meta-analysis.Soc Sci Med. 1982 [2006 Sep 29];64((1)):77–94.
- Byhoff E, Hamati MC, Power R, et al. Increasing educational attainment and mortality reduction: a systematic review and taxonomy. BMC Public Health. 2017;17(719). https://doi.org/10.1186/s12889-017-4754-1
- Nocon M, Hiemann T, Myller-Riemenschneider F, et al. Association of physical activity with all-cause and cardiovascular mortality: a systemic review and meta-analysis. European Journal of Preventive Cardiology 1 June 2008 2047-4873. Online 2047-4881. 15 3 239–246
- Ikäheimo TM, Jaakkola JJ. The effects of environmental temperature on health preparedness. 2019;135((22)):2159–2166. Finnish Duodecim.
- Ryti NR, Mäkikyrö EM, Antikainen H, et al. Risk of sudden cardiac death in relation to season-specific cold spells: a case-crossover study in Finland. BMJ. 2017. DOI:https://doi.org/10.11.36/bmjopen-2017-017398
- Näyhä S. Cold and the risk of cardiovascular diseases: a review. Int J Circumpolar Health. 2002;61(4):373–380.
- Life expectancy in the Arctic: Nordregio at www.nordregio.org, 19 March 2019.
- Report of the Regional Council of Lapland: the development of the municipal population in Lapland 1970-2008. http://www.lappi.fi/lapinliitto/c/document_library/get_file?forderld=52584&name=DLFE-3123.pdf