
ABSTRACT
Greenlandic traditional nutrition was unique in the arctic environment because it was an almost exclusive meat dietary pattern. Høygaard et al. left Copenhagen in August 1936, and stayed in East Greenland until August 1937. The four members of the expedition resided in Tasisaq and visited eight settlements around where nutritional intake was recorded by residing in families. However, the nutritional intake was analysed on a household level. The aim of the present study is to reanalyse the Høygaard et al. data according to modern scientific standards.
In total, 21 males and 14 females participated. Median (IQR) energy consumption was 3881 (1568) kcal.day−1 for males and 2910 (882) kcal.day−1 for females. Without the five participants living near trading centres, this was 3268 (219) kcal.day−1 and 2634 (723) kcal.day−1, respectively. Expressed in energy-percent, the macronutrient consumptions were 34% for protein, 37% for fat and 29% for carbohydrates. Without imported food, this was 41%, 49% and 10%, respectively.
The main findings of the present study are, as expected, that the food consumed came mainly from traditional hunting, was low in plant foods and extremely low in carbohydrates. The Inuit succeeded to stay in apparently healthy conditions with a traditional meat-based dietary pattern.
Introduction
Nutritional ethnography, the science behind the interactions between humans, economy and nutrition, has an essential role in describing traditional nutritional patterns before the expansive world globalisation creates a more uniform nutritional pattern, associated with a loss of unique traditional dietary patterns [Citation1]. This science implicates not only work in the field but also a (re)analysis and standardised reporting of historical nutritional data.
Greenlandic traditional nutrition was unique in the circumpolar arctic environment because it was an almost exclusive meat dietary pattern, extremely low in carbohydrates [Citation2]. Moreover, East Greenland was, due to the ice conditions, an extremely isolated area until World War II, with rather limited access to Western foods and beverages.
As stated by Kuhnlein et al. [Citation3], who studied nutritional patterns of Canadian Inuit intensively, the traditional dietary pattern of the Inuit was associated with a lower prevalence of chronic diseases compared to a more southern dietary pattern, and played a central role in the cultural identity and cultural integrity of the Inuit. Imported foods from the south, usually richer in carbohydrates, could ensure a more stable supply and avoid famine and starvation.
Nowadays, the traditional dietary patterns change slowly to a more southern lifestyle. Indigenous people have made the transition to a more Western diet, associated with an increase in chronic diseases, such as obesity, diabetes and cardiovascular diseases. In 2004, Kuhnlein et al. estimated for Canadian Inuit aged between 20 and 40 years that 14% to 18% of the daily energy requirements came from traditional foods. This was almost 30% for the age-category between 41 and 60 years [Citation4].
Before this unique cultural heritage disappears, it is important to record the traditional dietary patterns and eating habits of historical populations and to reanalyse older scientific data to contemporary standards. This last task is not easy because nutrition was often recorded anecdotally by explorers and researchers. This was not the case for the Høygaard et al. expedition [Citation5]. Høygaard et al. left Copenhagen in August 1936, and stayed in East Greenland until August 1937. The centre of the research was located at the trading post at Tasiilaq, a settlement consisting of 57 Inuit and two West-Greenland families. The Inuit lived in stone and turf-made winter houses, and in tents during the summer. The dietary patterns of the most remote settlements were selected for research, and nutritional intake was recorded by two researchers. However, the nutritional intake was analysed on a household level only, and not on an individual level or in function of energy requirements. Moreover, Høygaard et al. estimated the mean daily energy requirements of a male at 2800 kcal, and for a female at 2200 kcal. When the energy content of the recorded food was lower than the estimated energy requirement, all values were raised to the energy requirement, supposing inexact weighing. Luckily, Høygaard et al. published the raw data as supplement to the book, allowing a reanalysis on an individual basis [Citation5].
The aims of the present study were to reanalyse the Høygaard et al. data according to modern scientific standards, to calculate individual energy balances, macronutrient consumption and the role of imported food in daily nutritional patterns in a mid-1930 Inuit settlement in East Greenland.
Methods
Participants
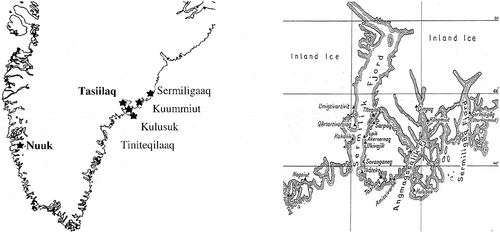
On 1 January 1937, the old “Angmagssalik” district counted 756 inhabitants living in 73 houses (). Høygaard et al. concentrated their investigations at the places who had been most isolated and so least influenced by Western civilisation, but included five individuals living near trading centres. In total 35 adults clustered in 13 families were selected: three individuals from Amituarsuk, two from Ikateq, four from Kulusuk, five from Qernertivartivit, nine from Sermiligaq, and seven from Titeqilaq; five participants lived near trading centres, three from Igdlumuit and two from Tasisaq (trading centre). Household scales were used by the researchers to register consumption. Participating families were offered one krone per family.
Figure 1. Locations in East Greenland of the Høygaard Study 1936–1937
Assessment of nutrition
Before the start of the study, two researchers living with the families, weighed all the foods in the houses, whether it was imported or from traditional Inuit origin. New food brought into the house was immediately weighed. All given or received food gifts were registered, together with the blubber quantities used for the lamps, the dog food, and the food supply stored for later. When the study period was over, food quantities in the houses were weighed again. There was no interference from the researchers to induce the participants to other food than usually consumed. No foods were forbidden, but foods were usually weighed in a raw state. After cooking the remnants, mainly bones, they were weighed again, and the weight was subtracted from the total weight before cooking.
The total number of days that food was recorded was 340, varying between 6 and 225 per family. To estimate individual food consumption from household food consumption, we used the adult-equivalent conversion factor from Claro et al. [Citation6]. Total traditional and imported food estimates from households were divided by adult-equivalents calculated on the basis of the household composition as described by Høygaard et al. [Citation5].
Estimation of the nutritional composition of traditional foods
To estimate the food changes during cooking, the traditional way of Inuit cooking was repeated experimentally by Høygaard et al., and analyses were done before and after cooking. Between October and December Høygaard et al. dissected Fjord seals, cods, guillemot, and ducks. Meat, organs and blubber were weighed and analysed for composition. From the composition, Høygaard et al. derived total energy using the Atwaters’ factors, i.e. 4 kcal for each gram of protein and carbohydrate and 9 kcal for each gram of fat [Citation7]. The composition of imported food was calculated using McCance and Widdowson’s Composition of Foods [Citation8].
Body weight and height
Weight and height were measured by the Høygaard team between September and October 1936. In the absence of body mass index (BMI) data in the Høygaard et al. study, we calculated the BMI using the following formula: BMI = body weight (kg)/height (m)2.
Assessment of rest metabolic rate, dietary-induced thermogenesis and physical activity
To estimate the rest metabolic rate in kcal.d−1, we used the Harris-Benedict equation adapted in 1984 [Citation9]. Dietary induced thermogenesis of a dietary pattern rich in fat and proteins was estimated at 10% of the rest metabolic rate in kcal.d−1. Physical activity was evaluated as a high physical activity level (PAL), following the reports of Høygaard et al. For males, the researchers observed 8 hours of sleep, 12 hours of low physical activity and 4 hours of more intense physical activity during hunting; for females this was 10 hours of sleep, 8 hours of low physical activity and 6 hours of more intense physical activity during household activities and cooking. PAL was evaluated as 2.10 for males and 1.82 for females [Citation10].
Assessment of total energy expenditure
Total energy expenditure expressed in mean kilocalories a day was the sum of:
TEE = RM + RM/10 + EE
TEE = total energy expenditure
RM = rest metabolic rate
RM/10 = dietary induced thermogenesis, i.e. 10% of the rest metabolism
EE = energy expenditure by physical activity
Energy balance (EB) was calculated by: EB = EI – TEE.
EI = energy intake by food and beverages
Statistics
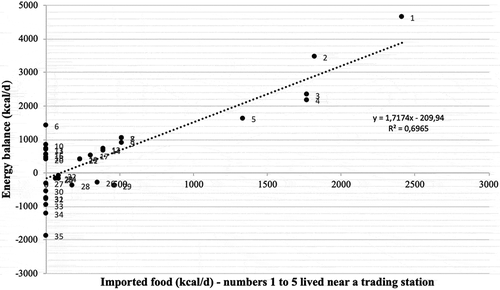
All descriptive data are presented as median, and interquartile range (IQR) because data were not normally distributed. The data were analysed by using IBM SPSS statistics for Windows Version 27.0 (Armonk, NY: IBM Corp.). All data were converted to 24 hours, expressed as d−1 (day). Scatter plots were constructed to express the energy balance versus imported foods for adults. A linear equation was constructed between energy balance (kcal.d−1) and imported food (kcal.d−1) to estimate the impact of imported food on energy balance.
Results
presents the general characteristics of the 21 males and 14 females of the Høygaard et al. study. The majority of the 35 participants had between 1 and 20 days of food recorded. At the time of the study, only 14% (n = 5) of the adults lived near a trading station.
Table 1. Baseline characteristics of the 35 participants (Høygaard Study 1936–1937)
presents the energy and the macronutrient consumption for the 35 participants in the Høygaard et al. study. Median (IQR) energy consumption was 3881 (1568) kcal.day−1 for males and 2910 (882) kcal.day−1 for females. Without the five participants living near trading centres, this was 3268 (219) kcal.day−1 and 2634 (723) kcal.day−1, respectively. Expressed in energy-percent, the macronutrient consumptions were 34% for protein, 37% for fat and 29% for carbohydrates. Without imported food, this was 41% for protein, 49% for fat and 10% for carbohydrates.
Table 2. Mean energy consumption and sources of energy consumption for the 35 participants (Høygaard Study 1936–1937)
present the energy expenditure, energy intake, and energy balance for the 35 adults of the Høygaard et al. study. Median (IQR) total energy expenditure was 3257 (217) kcal.day−1 and 2490 (46) kcal.day−1 respectively, which is somewhat higher than estimated by Høygaard et al., i.e. 2900 and 2200 kcal.day−1. The median (IQR) energy balance (energy intake in kcal.day−1 – energy expenditure in kcal.day−1) was 527 (1598) kcal.day−1 for males and 398 (920) kcal.day−1 for females.
Table 3. Energy expenditure and energy balance of the 35 adult participants (Høygaard Study 1936–1937)
presents the relationship between energy balance (kcal.day−1) and imported food (kcal.day−1) for the 35 adult participants in the Høygaard et al. study. An increasing quantity of imported food is associated with a more positive energy balance compared to traditional foods. The linear equation, i.e. y = 1,7174 x-209,94 (with y as energy balance and x as imported food, R2 = 0,70), indicated a negative energy balance of −209,94 kcal.day−1 when imported food is 0 kcal.day−1.
Figure 2. Energy balance versus imported food (kcal.d−1) for the 35 adult participants (Høygaard Study 1936–1937)
Discussion
The main findings of the present study are, as expected, that the food consumed came mainly from traditional hunting, was low in plant foods and extremely low in carbohydrates. Lastly, the energy balance increased with increasing imported foods, but in view of the many study limitations, making conclusions about energy balances is delicate.
Comparing the results of this study with other studies is difficult because of a lack of data. However, Krogh et al. [Citation11] estimated with a respiratory exchange method in 1913 for 4 male Inuit with a mean body weight of 69 kg an average energy expenditure of 82 kcal per hour sleeping and 112 kcal per hour when not sleeping. When sleeping 8 hours a night, this would be a total energy expenditure of 2448 kcal.d−1. Using the Harris-Benedict 1984 equation [Citation9], and using mean age and mean height of the Høygaard et al. study, this would give a resting metabolic rate of 1591 kcal.d−1. With 10% for dietary induced thermogenesis, the energy expenditure for physical activity would be only 698 kcal, which seems to be extremely low, corresponding to a physical activity level of only 1,4 (for sedentary persons) [Citation10].
In 1913, Krogh et al. used data from Rink et al. [1857, Citation11] to estimate energy consumption of West Greenland Inuit at 2559 kcal.d−1, with 1128 kcal.d−1 from proteins, 1215 kcal.d−1 from fat and 216 kcal.d−1 from carbohydrates. Expressed in energy percentage, this was 44% for proteins, 47% for fat and 8% for carbohydrates, comparable to our figures without imported food, i.e. 41%, 49% and 10%, respectively. With imported foods, the carbohydrate fraction increased to 29 energy per cent.
Bertelsen et al. in 1937 estimated the proportion of imported food in the energy requirements of the Inuit of the West Coast of Greenland to be as high as 63% in 1930. In the Høygaard et al. study this was only 10%, but probably lower when settlements were far from trading stations. In the Høygaard et al. data, only oats, rice, rye meal and sugar were consumed as imported foods.
To estimate energy balance, it is important in the arctic to know the weather conditions. As recorded by Høygaard et al., the mean temperature of the year was −2.0°C, with 6.6°C in July and −10.4°C in February, which can be seen as rather mild for the arctic.
In this study, the energy balance increased when the fraction of imported food increased. However, and in view of the many study limitations cited below, it is very delicate to make conclusions about this fact. The BMI between Inuit was comparable, living near trading centres or not, which emphasises the probability of comparable energy balances. It was probably easier to estimate the weight of imported food consumption than for traditional food consumption, which could introduce a bias in underestimation of energy consumption from traditional foods.
The traditional Inuit food system was extremely dependent on game, which on its turn depended on the sea currents, drift ice and the occurrence of plankton. A year with extreme pack ice could ruin the hunting season with starvation as a consequence. As noted by Høygaard et al., the most important food source was the Fjord seal, but as remarked by Holm et al. in 1888 [Citation12], the Greenlandic whale was common as food source in the past, but disappeared from the cost in the 20th century. It is clear that one whale could provide enough energy for a whole community during the winter. For this reason, adaptation of the traditional Greenlandic food system due to a lack of some type of game cannot be excluded.
A last point is the seasonal variations in energy balance as expressed by the variations in body weight. Høygaard et al. recorded adult body weight of 10 male and 8 female Inuit. The highest mean weight for males was in September 1936 with 64,7 kg, the lowest in April 1937 with 61,6 kg, a difference of 3,1 kg or 21700 kcal in approximately 212 days or 100 kcal.d−1. For females, this was 55,0 kg in April 1937 and 63,3 kg in July 1937, a difference of 8,3 kg or 58100 kcal in 122 days or 476 kcal.d−1, assuming no pregnancy.
The most important limitation of the present study, is that converting household consumption to individual consumption will obscure differences in intake among people of differing age and body weight, and that members of households do not participate to the study. A source of unavoidable error for Høygaard et al. was eating when hunting. It was impossible to prevent the members of a family to hunt and/or to forbid eating during a successful hunting with colleagues. This quantity could not be estimated and will introduce an error mainly on male consumption.
An important limitation of the present study is that we do not know how representative the sample of 35 persons was for the total population in the district. It is not clear from the Høygaard et al. data how the families were selected, but several families had to be excluded because the nutritional data were unreliable. Therefore, it is not possible to evaluate how representative the selected population was for the whole community, and a selection bias cannot be excluded. Another limitation of the present study is that multiple weight scales were used by different researchers to assess food consumption, so inter-observer errors cannot be excluded and the possible impact cannot be assessed. Although the researchers tried not to interfere in the daily activities and food consumption of the observed families, it is highly probable that this will have influenced the behaviour of the observed participants. In their systematic review, Robinson et al. demonstrated that heightened awareness of observation was associated with reduced energy intake when compared with the control condition [Citation13]. However, it is not clear from the Høygaard et al. data if the participants were aware of the aim of the study, and other methods for food investigation as dietary recall and food diary were unusual in those circumstances. Food recording by observation was probably the most valid method in view of the circumstances at that time.
Nowadays, there is a general tendency in Inuit communities towards decreasing traditional food consumption, and especially children and young adults consume less seal and whale [Citation14]. The traditional food items are replaced by imported food, and among the imported food items several rather unhealthy items are popular, such as sugar-sweetened beverages and fast food. Associated with a decrease in physical activity, this dietary transition has increased the prevalence of adiposity and diabetes. As stated by Bjerregaard et al., the modern Greenland Board of Nutrition must try to retain the benefits of the traditional diet, and, at the same time, to counteract the effects of poor quality imported food [Citation14].
As conclusion to the present study, a reanalysis of older nutritional data in a modern and standardised way can be interesting to better understand traditional nutritional systems in general, and of East-Greenlandic Inuit in particular. In this study, the importance of traditional foods in reaching an acceptable energy balance is emphasised, together with the specificity of Inuit traditional macronutrient consumption high in fat and protein, and low in carbohydrates.
The Inuit succeeded to stay in apparently healthy conditions with a traditional meat-based dietary pattern.
Authors’ contributions
PM worked on the original idea for the study. PM analysed the data, and drafted the first version of the manuscript, corrected by TD and PC. All authors read and approved the final version of the manuscript. All authors had full access to all data (including statistical reports and tables) in the study and can take responsibility for the integrity of the data and the accuracy of the data analysis.
Acknowledgments
The authors are indebted to the participants of this study and to the remarkable work of the Høygaard team in 1936-1937, i.e. Arne Høygaard, Harald Waage Rasmussen, Edward Falsen Krohn and Unni Høygaard. We would also like to thank Katrien Alewaeters, librarian at the Vrije Universiteit Brussel, for finding the Høygaard manuscript.
Data availability statement
All data available on request (corresponding author).
Disclosure statement
No potential conflict of interest was reported by the author(s).
Additional information
Funding
References
- Ottrey E, Jong J, Porter J. Ethnography in nutrition and dietetics research: a systematic review. J Acad Nutr Diet. 2018;118(10):1903–42 e10.
- Bjerregaard P, Jeppesen C. Inuit dietary patterns in modern Greenland. Int J Circumpolar Health. 2010;69(1):13–7. .
- Kuhnlein H. Nutrition of the Inuit: a brief overview. Arctic Med Res. 1991;90:728–730.
- Kuhnlein H, Receveur O, Soueida R, et al. Arctic indigenous peoples experience the nutrition transition with changing dietary patterns and obesity. J Nutr. 2004;124:1447–1453.
- Høygaard A. Studies on the nutrition and physio-pathology of eskimos. Oslo: Norske Vienskaps-Akademi i Oslo; 1940. p. 175.
- Claro RM, Levy RB, Bandoni DH, et al. Per capita versus adult-equivalent estimates of calorie availability in household budget surveys. Cad Saude Publica. 2010;26(11):2188–2195.
- Zou M, Moughan P, Awati A, et al. Accuracy of the Atwater factors and related food energy conversion factors with low-fat, high-fiber diets when energy intake is reduced spontaneously. Am J Clin Nutr. 2007;86:1649–1656.
- Holland B, Welch A, Unwin I, et al. McCance and Widdowson’s the composition of foods. Fifth ed. Cambridge: The Royal Society of Chemistry & Ministry of Agriculture, Fisheries and Food; 1993.
- Roza A, Shizgal H. The Harris Benedict equation reevaluated: resting energy requirements and the body cell mass. Am J Clin Nutr. 1984;40:168–182.
- Anonymous. Reports of the scientific committee for food - food science and techniques. Brussels: Commission of the European Communities; 1992.
- Krogh A, Krogh M. A study of the diet and metabolism of Eskimos undertaken in 1908 on an expedition to Greenland. Kopenhagen: Bianco Lunos Bogtrykkeri; 1913.
- Holm G. Den ostgrønlandske expedition udført i Aarrene 1883-1885. Kopenhagen: Bianco Lunos Bogtrykkeri; 1888.
- Robinson E, Hardman CA, Halford JC, et al. Eating under observation: a systematic review and meta-analysis of the effect that heightened awareness of observation has on laboratory measured energy intake. Am J Clin Nutr. 2015;102(2):324–337.
- Bjerregaard P, Mulvad G. The best of two worlds: how the Greenland board of nutrition has handled conflicting evidence about diet and health. Int J Circumpolar Health. 2012;71:18588. .