
ABSTRACT
The study aims to describe anthropometric data of Greenlandic preschool children, blood pressure (BP) measures and effects of maternal smoking during pregnancy in a follow-up of the ACCEPT birth cohort. The study included 102 children (55 boys and 47 girls) aged 3.5–5.5 years. Anthropometric measures included weight, height, head circumference (HC), body mass index (BMI), waist and hip circumference, ratio for height/weight, waist/height, waist/hip and BP measurements. Overweight and obesity-prevalence was determined using the international obesity task force BMI references for children. Significant increases in anthropometrics from 3.5 to 5.5 years included weight, height, HC and hip circumference, whereas ratio for height/weight, waist/hip and waist/height decreased. Boys had significantly larger HC than girls. The prevalence of overweight and obesity was similar (35.1%) between genders. Mean systolic and diastolic BP were 104 and 68 mmHg, respectively. Children of mothers smoking during pregnancy had higher hip circumference, lower waist/hip ratio and higher diastolic BP. The study present updated anthropometric data and BP of Greenlandic preschool children and effects of maternal smoking during pregnancy. The prevalence of overweight and obesity was higher than previously reported and maternal smoking during pregnancy affected the child data.
Abbreviations ACCEPT: Adaptation to Climate Change, Environmental Pollution and dietary Transition; BMI: Body Mass Index; BP: Blood Pressure; Circ: Circumference; DBP: Diastolic Blood Pressure; FFH: Fisher-Freeman-Halton exact test; HC: Head Circumference; H: Height; HDL: high-density lipoprotein; HiC: Hip Circumference; IOTF International Obesity Task Force, Max: maximum, Min: minimum, P25: 25th percentile, P75: 75th percentile, SBP: Systolic Blood Pressure, SD: Standard Deviation; VDLD: very-low-density lipoprotein; WaC: Waist Circumference, W: Weight, WHO: World Health Organization.
Introduction
In less than a century, the growth and development of Greenlandic children have undergone significant changes [Citation1–4], and the stunted growth pattern [low height (H) for age, evaluated using Center for Disease Control [Citation4] or the World Health Organization (WHO) [Citation3] cut-off values] of Greenlandic children found in the middle of the 20th-century is no longer present [Citation3,Citation4]. During the last century, the Greenlandic people went through a transition from the traditional marine diet and active lifestyle, characteristic for hunters, to a more inactive western lifestyle and a diet rich in carbohydrates and saturated fats [Citation5]. Consequently, there has been an increase in overweight and obesity in both children and adults [Citation5–7]. Most of the literature has focused on Greenlandic schoolchildren and adults, and few data are available on preschool children [Citation3,Citation4]. A report show that overweight and obesity of Greenlandic children at school-entry increase the risk of overweight and obese throughout the school years [Citation8].
The growing obesity epidemic is a major source of increasing health costs, morbidity and mortality because of hypertension, type 2 diabetes mellitus, dyslipidemia, certain cancers and cardiovascular diseases [Citation9]. There is a positive relationship between overweight or obesity and blood pressure (BP) and risk for hypertension [Citation10]. Similar to obesity, hypertension is a key unfavourable health metric that has negative health implications, and reports indicate a link between obesity and hypertension, which again consequently increases cardiovascular diseases [Citation9]. Studies show a link between obesity in mothers and the risk of obesity in offspring [Citation11]. The mother’s pre-conceptual weight (W) status is a marker of both environmental and genetic risk for the child, and genetic traits from the family can influence obesity risk [Citation11]. Hence, it is important to consider the risk factors early in life considering the age when the problems arise.
Categorising Greenlandic children and adults as overweight and obese has been based on anthropometric measures, which has been argued not to take into account the body proportions and composition of the Inuit population [Citation3,Citation12,Citation13], especially when comparing body mass index (BMI) to the international references [Citation3,Citation12].
The WHO Child Growth Standards were derived from an international sample of healthy breastfed infants and young children raised in environments that do not constrain growth and can be used to assess children everywhere, regardless of ethnicity, socio-economic status and type of feeding [Citation14]. The Box-Cox power exponential (BCPE) method, with curve smoothing by cubic splines, was used to construct the growth curves. Percentiles and z-score curves for boys and girls aged 0–60 month were generated for weight-for-age, length/height-for-age, weight-for-length/height (45 to 110 cm and 65 to 120 cm, respectively) and BMI-for-age.
Over the past decade, the WHO growth curves have been adopted by more than 100 countries, including Denmark [Citation15]. However, Danish and Swedish growth charts are commonly used in Greenland. Compared to European national references, the WHO growth standards and references have lower means and lower normal ranges or cut-offs that typically define abnormal growth [Citation3,Citation16–20].
Kløvgaard et al. [Citation3] compared the growth of Greenlandic children aged 6–10 years (2012) with WHO growth charts and Danish references. They found that 21–28% of the children aged 0–1 years exceeded the WHO growth chart for length by more than two standard deviations (SDs). For W and head circumference (HC), 9–16% of the children aged 0–10 years and 9–11% of the children from 0 to 2 years exceeded the WHO charts by more than two SDs. The Danish references were exceeded to a lesser degree. Z-scores in Greenlandic children generally exceeded the WHO and Danish growth charts significantly at age 3–5 years for length/height with −0.01 SDs and −0.31 SDs, W with +0.73 and +0.51 SDs, BMI with +1.03 and +0.97 SDs and HC with +0.96 and +0.45 SDs, respectively [Citation3].
At present, it is not clear at what age the body proportions of Greenlandic children deviate from the international references, and new reference values are under consideration, necessitating data on growth in preschool children.
Inuit adult populations from Alaska, Canada, and Greenland, elicited BP ranking intermediate on a global scale but low in comparison with most European populations [Citation21]. The observed regional differences might involve factors such as the traditional diet, a rural life with a low level of psychosocial stress, and genetics [Citation21]. Another study on adults showed that Greenlanders have a lower 24-h diastolic blood pressure (DBP) than Danes, and the authors suggest that genetic factors are mainly responsible for the lower BP level among Greenlanders [Citation22]. A study compared the metabolic profiles in Greenlandic Inuit children (aged 5.7–17.1 years) and Danish children (Copenhagen; aged 8.5–16.1 years) [Citation23]. Both Inuit children living in Nuuk and the northern villages had significantly higher glucose, total cholesterol, Apolipoprotein A1 levels, and DBP compared with Danish children after adjustment for differences in adiposity and aerobic fitness levels. Moreover, the Inuit children living in Nuuk had significantly higher BMI, body fat percentage, Haemoglobin A1C, and significantly lower aerobic fitness and Apolipoprotein A1 levels than northern living Inuit children [Citation23].
As a part of the ACCEPT birth cohort (Adaptation to Climate Change, Environmental Pollution and dietary Transition) [Citation24], the aim of this study is to describe i. anthropometric and BP measures of Greenlandic preschool children, ii. how these parameters change between the ages of 3.5 and 5.5 years and iii. the effect of maternal smoking during pregnancy. To our knowledge, there is no previous report on BP measurements in Greenlandic preschool children. With comparison to earlier studies, this study will contribute to the sparse data on growth patterns of Greenlandic preschool children, elucidating the underlying causes of the inter-generational changes in growth, overweight and obesity.
Methods and materials
Study population
This study is based on the ACCEPT birth cohort, established in 2010–2015, in Greenland, with the overall aim of exploring health and dietary changes during a period of lifestyle transition and climate change [Citation24]. This study is a follow-up on 102 Greenlandic ACCEPT children (3.5–5.5 years of age) with data collection from May 2019 to January 2020. To elucidate the growth and developmental changes of Greenlandic pre-school children during 3.5 to 5.5 years of age, the children were divided into four age groups, and further by gender, to compare the developmental patterns of boys and girls.
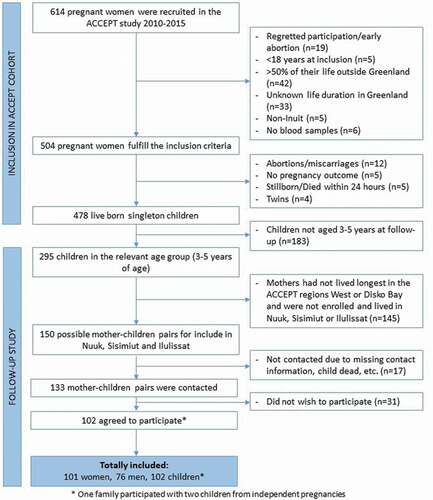
In total, 614 pregnant women were recruited to the ACCEPT birth cohort, 504 fulfilled the inclusion criteria (≥18 years of age at inclusion, lived ≥50% of their lives in Greenland, and had ≥1 Inuit parent). Among them, 478 completed the pregnancy and gave birth to a live born singleton with birth outcome available. At the time of follow-up, 295 live born singleton children were in the relevant age of 3–5 years (children of mothers recruited in 2013–2015). Of these, 150 fulfilled the follow-up criteria (mothers had lived longest in the ACCEPT defined regions, West or Disko Bay, and currently lived in Nuuk, Sisimiut, and/or Ilulissat). We contacted 133 ACCEPT mothers, and 102 agreed to participate (). In total, 102 children (55 boys and 47 girls), 101 mothers, and 76 fathers ended up participating in the follow-up (one family participated with two children from independent pregnancies). The participation rate at follow-up was 76.6%, and those who did not accept to participate mainly gave lack of time as the reason.
Figure 1. Flowchart showing the process of inclusion and exclusion of mother-child dyads for the ACCEPT follow-up study
The participants received a detailed description of the study, and the parent(s) gave informed consent concomitantly with the hand out of the questionnaires. The study was following the Helsinki convention II and approved by the Commission for Scientific Investigations in Greenland.
Questionnaire data
To evaluate lifestyle characteristics of the Greenlandic children, mothers and fathers, and the growth parameters of the children, questionnaires were available in both Danish and Greenlandic. The parental questionnaires included questions about lifestyle, diet, sociodemographic factors and reproductive factors. The child questionnaire included several standardised parts, such as the “The Strength and Difficulties Questionnaire” (SDQ) and “Ages & Stages Questionnaires” (ASQ). The child questionnaires were based on the Ages & Stages Questionnaires®. ASQ-3; the third edition of the internationally recognised questionnaire system for babies and toddlers, which was further customised in collaboration with the Aarhus Birth Cohort [Citation25] and the Greenlandic INUENDO project [Citation26], which used similar questionnaires for Danish and Greenlandic children. The questionnaires included questions about lifestyle, diet, sociodemographic factors, child-growth parameters, disease, housing conditions, and mental and physical development. The ACCEPT-child’s parent(s) completed the questionnaires in cooperation with a health nurse, in the child home, between May 2019 and January 2020. Questionnaire data were entered twice into the Epidata (version 3.1) program. For statistical analysis, data was exported from Epidata into SPSS (version 26).
The following measured anthropometric and BP parameters from the children’s questionnaires were analysed: W (kg), H (cm), HC (cm), BMI (kg/m2), waist circumference (WaC; cm), hip circumference (HiC; cm), height/weight ratio (cm/kg), waist/height ratio (cm/cm), waist/hip ratio (cm/cm), systolic blood pressure (SBP; mmHg) and DBP (mmHg). SBP and DBP were the average of three measurements. A health nurse measured the child-growth parameters, at the date the questionnaires were completed. The health nurse measured the BP using a child cuff. The BP were measured three times, while the child were sitting. For some children, it was only possible to measure the BP once as the children got sad/upset and refused to have further measurements, which we respected. Reproducibility and variation of inter- and intra-observer measurements, and the accuracy of the equipment used was not available. Of the eleven parameters analysed, only WaC, HiC and the waist/hip ratio had no missing answers, whereas 13–50% of answers were missing for the rest parameters ().
Table 1. Maternal and child characteristics of the study population
Table 2. Growth parameters and blood pressure of Greenlandic children aged 3.5–5.5 years
The children’s age were set as the difference between the date when the questionnaire was completed and the date of birth. For the statistical analysis, the children were divided into four age groups: i. >3.5 and ≤4.0 years including up to 23 children (12 boys and 11 girls; one boy of 3.3 years was included in this group); ii. >4.0 and ≤4.5 years including 27 children (16 boys and 11 girls); iii. >4.5 and ≤5.0 years including 28 children (16 boys and 12 girls); iv. >5.0 to approximately 5.5 years including up to 24 children (11 boys and 13 girls; two boys and one girl between 5.5 and 5.6 years were included in this group).
Assessment of the prevalence of overweight and obesity was based on age and gender-specific BMI cut-off values (Figure S1). The International obesity taskforce (IOTF) published the cut-off method with the purpose of linking adult BMI cut-off points (25 kg/m2 for overweight and 30 kg/m2 for obesity) to BMI centiles for children to provide age and gender-specific child cut-off points [Citation27]. Centile curves for BMI dataset by sex, obtained using the LMS method, which summarises the data in terms of three smooth age-specific curves called L (lambda), M (mu), and S (sigma). The M and S curves correspond to the median and coefficient of variation of BMI at each age whereas the L curve allows for the substantial age-dependent skewness in the distribution of BMI. The assumption underlying the LMS method is that after Box-Cox power transformation the data at each age are normally distributed. The points on each centile curve are defined in terms of the formula M(1+ LSz)1/L: where L, M, and S are values of the fitted curves at each age, and z indicates the z score for the required centile, for example, z = 1.33 for the 91st centile [Citation27]. Cut-off reference points for overweight and obesity were included at the ages of 36, 42, 48, 54, 60, 66 and 72 months, and reference-points were connected to cover the age in-between (Figure S1).
Cotinine measurements
Cotinine (a metabolite of nicotine, used as a biomarker for recent exposure to tobacco smoke) was measured in maternal plasma-samples (ng/ml) during pregnancy, using the Calbiotech Cotinine Direct ELISA Kit (Calbiotech Inc., CA, USA), at the Centre of Arctic Health and Molecular Epidemiology, Aarhus University, Denmark. The detection limit was 1 ng/ml, and concentrations below this limit was set as 0.5 ng/ml.
Statistical analysis
The normality of the data was evaluated using QQ-plots, histograms and the Shapiro–Wilk test, and all variables were normally distributed. Homogeneity of variance was tested using Levene’s test for equal variances. For the study population characteristics, independent samples t-test and Pearson’s chi2 test were used to test for gender differences of the continuous and categorical variables, respectively. Statistically significant differences in anthropometric measures and BP parameters between genders, age groups, and between genders in each age group, were determined using two-way ANOVA. Significant differences detected by ANOVA were elaborated using Tukey’s post hoc test for multiple comparison of age group means. Differences in anthropometric measures and BP between children of non-smoking and smoking mothers during pregnancy were analysed using independent samples t-test. Differences in plasma cotinine levels between non-smoking and smoking mothers during pregnancy, in each children age group, were detected using independent samples Mann–Whitney U test, as the plasma-cotinine distribution was non-normal. Associations between maternal plasma-cotinine and growth parameters and BP in the different age groups were tested using Spearman’s rank-order correlation. Differences in prevalence of overweight and obesity between genders and age groups were tested using Pearson’s chi2 test and the Fisher-Freeman-Halton exact test (when expected cell counts <5 for >20% of cells). Statistical tests were carried out in SPSS version 26–27. Statistical significance was determined at a p-value ≤0.050, and due to small sample size a borderline statistical significance at a p-value ≤0.080.
Results
shows maternal characteristics during pregnancy and child characteristics at birth. At the time of follow-up, 67.6% (n = 69) of the families lived in Nuuk, while 21.6% (n = 22) and 10.8% (n = 11) lived in Sisimiut and Ilulissat, respectively. None of the maternal characteristics differed between the offspring genders. The women had a median age at delivery of 29.2 years, a pre-pregnancy BMI of 24.1 kg/m2 and 20.6% smoked during pregnancy (). None of the women reported drinking alcohol during pregnancy (not shown). The maternal educational level at pregnancy was 20.8% of primary school, 12.9% of secondary school, 37.6% of technical college and 28.7% of university. The median gestational age was 40 weeks for both genders. At birth, the boys had a higher W (p = 0.014), a higher H (p = 0.003) and a larger HC (p = 0.019) than the girls. At follow up the children had a median age at of 4.51 years ().
The growth and developmental changes of Greenlandic pre-school children during 3.5 to 5.5 years of age were assessed for the four age groups and genders.
shows measures of anthropometric growth parameters and BP of the 102 Greenlandic children, which are further depicted as dot-plots and boxplots in , to visually present the range of values, and patterns of change with age.
Figure 2. Weight (a, e), height (b, f), head circumference (c, g) and BMI (d, h) of Greenlandic children aged 3.5–5.5 years. Linear fits of dot-plots, and β-values (linear slope), for each gender, are included to show the direction of change. Age groups of boxplots does not include the lower value. 3.5–4.0* Includes a boy of 3.3 years and 5.0–5.5** Includes two boys and one girl between 5.5 and 5.6 years. In the boxplot, the boxes display the 25th and 75th centiles, the line inside the boxes represents the median value, and the whiskers display the lower and upper values within 1.5 IQRs (Inter Quartile Ranges). Outliers are shown by dots, and defined to be 1.5–3.0 IQRs below the 25th centile, and/or 1.5–3.0 IQRs above the 75th centile. P-values are shown for significant differences between age groups
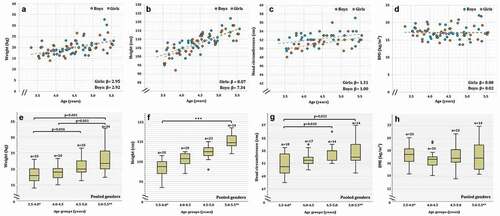
Figure 3. Waist circumference (a, f), hip circumference (b, g), height/weight ratio (c, h), waist/height ratio (d, i) and waist/hip ratio (e, j) of Greenlandic children aged 3.5–5.5 years. Linear fits of dot-plots, and β-values (linear slope), for each gender, are included to show the direction of change. Age groups of boxplots does not include the lower value. 3.5–4.0* Includes a boy of 3.3 years and 5.0–5.5** Includes two boys and one girl between 5.5 and 5.6 years. In the boxplot, the boxes display the 25th and 75th centiles, the line inside the boxes represents the median value, and the whiskers display the lower and upper values within 1.5 IQRs (Inter Quartile Ranges). Outliers are shown by dots, and defined to be 1.5–3.0 IQRs below the 25th centile, and/or 1.5–3.0 IQRs above the 75th centile. Extreme values are shown by triangles, and defined to be below or above 3.0 IQRs from the 25th or 75th centile respectively. P-values are shown for significant differences between age groups
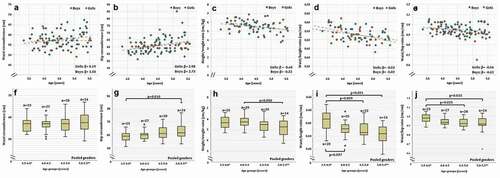
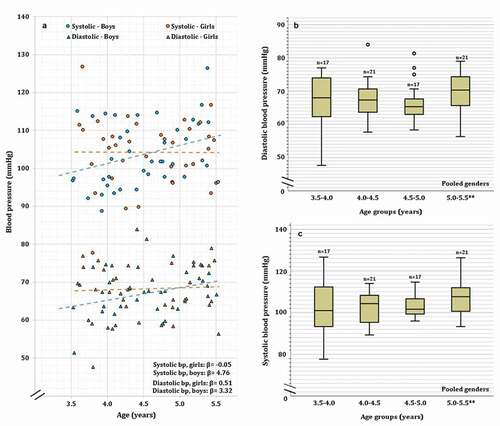
Figure 4. Diastolic and systolic blood pressure (a-c) of Greenlandic children aged 3.5–5.5 years. Linear fits of dot-plots, and β-values (linear slope), for each gender, are included to show the direction of change. Age groups of boxplots does not include the lower value. 5.0–5.5** includes one boys and one girl between 5.5 and 5.6 years. In the boxplot, the boxes display the 25th and 75th centiles, the line inside the boxes represents the median value, and the whiskers display the lower and upper values within 1.5 IQRs (Inter Quartile Ranges). Outliers are shown by dots, and defined to be 1.5–3.0 IQRs below the 25th centile, and/or 1.5–3.0 IQRs above the 75th centile
Differences between age groups
Significant differences were observed among age groups for W (p < 0.001), H (p < 0.001), HC (p = 0.007), HiC (p = 0.011), height/weight ratio (p = 0.031), waist/height ratio (p < 0.001) and waist/hip ratio (p = 0.013), but no differences were observed for BMI (p = 0.534), WaC (p = 0.451), SBP (p = 0.352) and DBP (p = 0.362) (, ). reports significant differences between age group when using the Tukey’s post hoc test for multiple comparison (indicated by capital letters, see legend). As expected, the pair-wise comparison between age groups showed that W was significantly higher in the age group 4.5–5.0 years compared to 3.5–4.0 years (p = 0.036), for 5.0–5.5 years compared to 3.5–4.0 years (p < 0.001), and for 5.0–5.5 years compared to 4.0–4.5 years (p = 0.001). Weight was not significantly different between the other age groups (). show the pattern of increasing W with age.
We found the expected significant increase in H between all age group years comparisons () as follows: between 3.5 - 4.0 and 4.0–4.5 (p = 0.002), 3.5–4.0 and 4.5–5.0 (p < 0.001), 3.5–4.0 and 5.0–5.5 (p < 0.001), 4.0–4.5 and 4.5–5.0 (p = 0.006), 4.0–4.5 and 5.0–5.5 (p < 0.001), and 4.5–5.0 and 5.0–5.5 (p = 0.001). See for the pattern of increasing H with age.
Compared to age group 3.5–4.0, the HC increased significantly for the age group 4.5–5.0 (p = 0.010) and 5.0–5.5 (p = 0.022). No other age-group HC comparisons were significant (). show the increasing pattern of HC from 3.5–4.0 years to 4.0–4.5 years and a subsequent stabilisation at ages above 4.0 years.
HiC increased significantly comparing age group 3.5–4.0 years to age group 5.0–5.5 years (p = 0.010). The data showed no other age group differences for HiC (). shows the increasing HiC with age.
In accordance with the proportionally larger increase in W than H, the height/weight ratio decreased significantly between the age groups of 4.0–4.5 and 5.0–5.5 years (p = 0.050), and the difference between age group 3.5–4.0 and 5.0–5.5 was borderline significant (p = 0.054). No significant differences were found between any other age groups (). show the change in height/weight ratio with age, showing decreasing ratios at ages above 4.5 years.
As H increased with age, while no change in WaC, the waist/height ratio was significantly higher in the 3.5–4.0 year group compared to 4.0–4.5 (p = 0.037), 4.5–5.0 (p = 0.009) and 5.0–5.5 (p < 0.001), whereas no other significant differences were found. show the decreasing pattern of the waist/height ratio with age.
Following the increase in HiC, concomitantly with no detectable change in WaC, the waist/hip ratio decreased significantly between age group 3.5–4.0 and 4.5–5.0 (p = 0.025) and between 3.5–4.0 and 5.0–5.5 (p = 0.015). The data showed no other age group differences for the waist/hip ratio (). show the decreasing pattern of the waist/hip ratio, which is most prominent up to the age of 4.5 years.
Differences between genders
The comparison of growth parameters and BP between genders showed that boys had a significantly larger HC (p = 0.012) (). None of the other parameters showed significant differences between genders ().
Differences between genders in each age group
The data showed no significant differences between genders within each age group for any parameters (). Figures S2-S3 show boxplots of age groups separated by gender and Table S1 the corresponding measures.
Prevalence of overweight and obesity
The overall prevalence of overweight and obesity, according to the IOTF BMI cut-off (Figure S1), was 35.1% with no significant differences were between genders (p = 0.153) or among age groups (p = 0.600) (). However, comparison of the IOTF BMI cut-off values for overweight and obesity showed for girls 32.3% overweight and 9.7% obese, respectively. Whereas, compared to girls, boys had a lower prevalence of overweight but a higher prevalence of obesity, being 14.0% and 16.3%, respectively (; Figure S1).
Table 3. Prevalence of overweight and obesity in Greenlandic boys and girls according to the international obesity taskforce gender and age specific BMI cut-offs
Effect of maternal smoking status and cotinine levels
As shown in , significantly higher cotinine level were found in mothers that smoked during pregnancy compared with non-smokers, for all child age groups (p < 0.001). Children of mothers that smoked during pregnancy had a higher HiC (p = 0.005) and lower waist/hip ratio (p = 0.013). The differences were only significant in the pooled age groups (), but with similar tendencies in the separate age groups. The HiC at 3.5–4.0 years (p = 0.075), the waist/hip ratio at 4.0–4.5 years (p = 0.076) and 4.5–5.0 years (p = 0.058), and DBP at 3.5–4.0 years (p = 0.063) were borderline significant (p ≤ 0.080), but no other significant differences could be detected (). The maternal cotinine levels significantly correlated with HiC (rs = 0.271, p = 0.006, age groups pooled), the waist/hip ratio (rs = −0.251, p = 0.011, age groups pooled) and DBP (rs = 0.542, p = 0.024, 3.5–4.0 years). No other correlations were significant (), although borderline significant correlations were found between maternal cotinine level and HiC at 4.0–4.5 years (rs = 0.354, p = 0.070) and the waist/hip ratio at 4.5–5.0 years (rs = −0.339, p = 0.077).
Table 4. The effects of maternal smoking status and cotinine levels, during pregnancy, on child growth and blood pressure
Discussion
In this study, we present updated anthropometric data and BP measurements of preschool Greenlandic children in the age group of 3.5–5.5 years. As expected, with increased age, we found significant increases in H, W, HC and HiC, and significant decreases in height/weight ratio, waist/hip ratio and waist/height ratio. Compared to some previous reports, the prevalence of overweight and obesity was relatively high in the present study [Citation4,Citation6,Citation28]. Furthermore, boys had a larger HC than girls. Children of mothers that smoked during pregnancy had a higher HiC, lower waist/hip ratio, and higher DBP.
Children’s height, weight and BMI
During the last century, Greenlandic children were characterised by stunted growth patterns compared to Caucasian references [Citation1], but this pattern is no longer prominent [Citation3,Citation4]. In the current study, we found similar H, W and BMI of Greenlandic children at 3.5–5.5 years of age compared to a recent Greenlandic child-cohort-study by Kløvgaard et al. [Citation3]. Kløvgaard et al. presented growth data on children between 0 and 10 years of age, based on 279 healthy children from Nuuk and Ilulissat, being 6–10 years of age in 2012 [Citation3]. The approximate growth chart by Kløvgaard et al. showed at the age 3.5 to 5.5 years, a median H increase from 100 cm to 114 cm in boys and 98 cm to 113 cm in girls. The median W increase from 17 kg to 21 kg in boys and from 16 kg to 21 kg in girls and median BMI decrease from 16.8 to 16.5 for both boys and girls [Citation3]. The data of Kløvgaard et al. [Citation3] are approximately 11 years older compared to the data presented in the current study, but as the anthropometric measures corresponded well between the two studies, the reference charts could be a good representation of Greenlandic children. In support to this, a child-cohort-study published by Galloway and colleagues [Citation4] considered anthropometrics of Greenlandic children aged 3–5 years (86 living in Nuuk and 572 living outside Nuuk) between 2001 and 2010 [Citation4]. Galloway et al. [Citation4] showed data on H and BMI of children living outside Nuuk (H: 107.3–109.2 cm; BMI: 17.2–17.3) and in Nuuk (H:117.2–118.3 cm; BMI: 16.7–16.8). The data from children living outside Nuuk were comparable to the present study, whereas children from Nuuk had a higher H, with similar BMI. Any discrepancies might result from the small population sizes in Greenland, as there is a possibility of pronounced yearly fluctuations in H, W and BMI.
In recent decades, there has been a tendency of increasing BMI and prevalence of overweight and obesity in young Greenlandic children [Citation4,Citation7]. In the present study, we found BMI to be similar between the age groups, resulting in a prevalence of overweight and obesity of 35.1% (based on IOTF cut-off values (Figure S1) [Citation27],), which is higher than previously shown. There are several studies on BMI and prevalence of overweight and obesity in Greenlandic children from Nuuk, using the IOTF cut-off reference [Citation4,Citation6,Citation28]. From 1980 to 2004, the prevalence of overweight and obesity in children at school-entry increased from 7.5% to 21.7% [Citation6]. From 2003 to 2007, in children aged 3–5 years, the prevalence of overweight and obesity was 31.4% [Citation4]; whereas from 2005 to 2011, for children at school entry (aged 5.4 to 7.6 years), the proportion decreased from 21.2% to 14.6%, although with pronounced yearly fluctuations, especially between genders [Citation28].
The somewhat higher prevalence of overweight and obesity detected in the current study for 3.5–5.5 years of age, compared to other studies on children from Nuuk using the same BMI cut-offs, is likely caused by a still ongoing increasing trend in BMI, earlier onset of overweight [Citation7], as well as yearly fluctuations, which can be as high as 20% [Citation28]. Overweight and obesity in children have been shown to be higher outside Nuuk [Citation4,Citation28], but for the 74 children with measures of BMI in the present study, only five lived outside Nuuk; thus, regional variation is an unlikely explanation. As in earlier studies, we found a higher prevalence of combined overweight and obesity in girls, whereas a higher percentage of boys were obese [Citation7,Citation28].
In average, it has been estimated that 20% (10–36%) of all 10-year-olds in Europe are overweight [Citation29]. Genetic factor has been suggested to play a role in approximately one-third of all cases of obesity [Citation30], however, since the human genetic has not changed during the past 20 years it cannot explain the increase. Changes in lifestyle and diet and lower physical activity are assumed to contribute to the overweight increase [Citation29]. Further evaluation of H, W and BMI of pre-school children is an important step in preventive healthcare, as overweight and obese children at school-entry are at high risk of staying overweight and obese in adolescence [Citation8].
Although the BMI of Greenlanders has increased over the last decades [Citation5,Citation7,Citation28], the BMI cut-off points for determining overweight and obesity have been argued to overestimate the prevalence in the Greenlandic Inuit population [Citation12,Citation31]. BMI reference charts and cut-off values are based on data from few ethnic populations and do not include Arctic circumpolar populations [Citation3,Citation27]. Greenlanders have been shown to have higher sitting heights and shorter legs compared to other populations, fitting with the higher W in relation to H [Citation2,Citation31], although comparative data on sitting height in preschool children is not available.
In addition to differences in body proportion, abdominal visceral and subcutaneous adiposity differs between ethnicities. Comparisons of adult Danes and Greenlanders by the use of ultrasonography have shown that for a given measure of BMI, WaC, waist/hip ratio and waist/height ratio, Greenlanders have less visceral and subcutaneous fat [Citation13]. In line with this, metabolic risk factors have also shown to differ between Danes and Greenlanders [Citation32]. In adult Inuit, marine diet was reported positively associated with serum high-density lipoprotein (HDL) and blood glucose and inversely with very-low-density lipoprotein (VLDL) and triglyceride [Citation33]. Compared to Danes, for a given measure of BMI and WaC, metabolic risk factors such as 2-hour glucose, insulin, triglycerides and BP were shown to be lower in Greenlanders, whereas HDL were higher [Citation32]. This further supports that international BMI and WaC references might not be accurate predictors of overweight and obesity and the related metabolic risk factors in Greenlandic adults. Whether these differences are present in Greenlandic children and at what age children start to deviate from the Caucasian body proportions is currently unknown, and needs further studies.
Children’s abdominal adiposity
Due to the uncertainties using international BMI cut-offs, evaluation of overweight and obesity in children should include other measurements that reflect subcutaneous and visceral abdominal adiposity [Citation13]. High WaC, high waist/hip ratio and/or high waist/height ratio, reflect abdominal adiposity irrespective of W, and relate to high levels of metabolic risk factors [Citation13,Citation34,Citation35]. The waist/height ratio is especially interesting, as this has enabled detection of children of normal W, with abdominal adiposity, at cardio-metabolic risk; and to detect overweight/obese children, with no abdominal adiposity, which are at lower risk than those with abdominal adiposity [Citation36]. Although some earlier studies have used a waist/height ratio cut-off point of 0.5 as an indicator of abdominal obesity in children [Citation26,Citation36], recent studies have shown that waist/height ratio depends on age, especially in the preschool period [Citation37,Citation38], and gender [Citation38]. The waist/height ratio has been shown to decrease during the preschool years [Citation37]. A former study on Greenlandic children, with a median age of 8.3 years (2010–2012), showed a slightly lower waist/height ratio [Citation26] than in the present study, which supports a decreasing waist/height ratio in Greenlandic children during the preschool and early school years. Thus, as for BMI, a one-size fits all solution for evaluation of abdominal adiposity in children is likely unreliable, and age and gender-dependent references should be developed for BMI and waist/height ratio alike.
Children’s head circumference
Head circumference is a good indication for child health and nutritional status, for example, protein energy malnutrition [Citation39–41]. To our knowledge, there is no reported data on HC in Inuit children at 3.5–5.5 years of age; thus, evaluation of proper development is dependent on international references. In the present study, we found the median HC of Greenlandic children, from 3.5 to 5.5 years of age, to be from 52.0 cm to 53.0 cm in boys and 49.8 cm to 52.0 cm in girls, which is higher than the WHO references [Citation42]. The WHO reference charts show that the median HC, from 3.5 to 5 years of age (5 years being the upper limit), increases from 49.9 cm to 50.7 cm in boys and 49.0 cm to 49.9 cm in girls [Citation42]. The higher HC in Greenlandic children, aged 3–5 years, compared to the WHO reference, has also been shown in Greenlandic children aged 0–2 years [Citation3], and in children aged 2 years from several other countries [Citation16]. The HC at birth, and at follow-up, was significantly larger for boys than girls. This has also been shown before in Greenlandic children at 0–2 years of age [Citation3], and it is likely, that Greenlandic boys have a larger HC from birth through the preschool years, a tendency also shown in other countries [Citation42]. Thus, there is a need for gender-specific Greenlandic reference charts for HC, and care should be taken when using the WHO international references, as this might result in underestimation of microcephaly and overestimation of macrocephaly in the population.
Children’s BP
The BP measurements included in this study, is, to our knowledge, the first published data for Greenlandic and Inuit preschool children. In Europe, evaluation of hypertension in children is based on age-specific BP percentiles for a given H percentile of the population [Citation16,Citation43], but corresponding references for Greenlandic children are not available [Citation3]. In the current study, the SBP and the DBP were similar among Greenlandic children of 3.5 − 5.5 years and did not differ between genders. In other populations, BP is found to increase slightly with age in preschool children [Citation44,Citation45], and the relatively short age range in the current study may explain the non-significant changes seen between the ages. However, in boys we see a tendency to increase in DBP and SBP with age. BP has been measured in Greenlandic children at ages 5.7–17.1 years, living in Nuuk and Thule, with estimates of SBP ranging from 109 to 112 mmHg and DBP ranging from 65 to 67 mmHg [Citation23]. The higher SBP compared to the current study, might result from age-differences, as BP increases with child-age in non-Greenlandic children [Citation43]. Comparison with 11-year old Inuit children from Nunavik (a northern region of Quebec, Canada), showed a comparable SBP of 105 mmHg, although with a lower DBP of 59 mmHg [Citation46]. In the adult Greenlandic population, BP is lower, despite higher BMI’s, compared to European countries [Citation21]. Whether this pattern is present in children needs further studies.
Effects of maternal smoking on child growth and BP
The smoking among pregnant women in Greenland is relatively high although a tendency to a slight decrease [Citation47]. In the ACCEPT study related to the current study, 29% of the mothers smoked during pregnancy [Citation24]. In this sub-study of ACCEPT 20.6% of the mothers smoked during pregnancy. We found that children of mothers that smoked during pregnancy had higher HiC and correspondingly lower waist/hip ratio. Accordingly, maternal cotinine levels positively correlated with HiC, and negatively correlated with the waist/hip ratio. Literature on the effects of maternal smoking during pregnancy and HiC and the waist/hip ratio in children is lacking, but the waist/hip ratio have been found to be higher in 21 year olds, which had mothers that smoked during their pregnancy [Citation48]. Thus, whether the effects of maternal smoking on the waist/hip ratio differ between preschool children and young adults, and whether ethnic differences or chance findings are involving factors remains to be determined.
Previous reports describe the influence of maternal smoking during pregnancy on BP of children and young adults [Citation48,Citation49]. SBP was higher in children of mothers that smoked during pregnancy, whereas DBP was unaffected [Citation49]. No effects have been found in young adults [Citation48]. Even though we found an effect of maternal smoking on DBP in 3.5–4.0 year group, only five mothers in this group had cotinine-levels above the detection limit, and the other age groups showed inconsistent results. Despite not finding an influence of smoking status on SBP, there is a trend of higher SBP in children of smoking mothers, except for the 4.0–4.5 year group, although correlations with cotinine were inconsistent. Thus, whether maternal smoking during pregnancy affect BP in Greenlandic preschool children is inconclusive, and needs to be further studied.
Despite the maternal smoking status during pregnancy elicited limited effects on other anthropometric data of the children in our study, there is a tendency for higher BMI in children of mothers that smoked during pregnancy. A recent meta-analysis has shown that maternal smoking during pregnancy puts the child at higher risk of becoming overweight and obese, which also was the case when the analysis was limited to studies using the IOTF cut-offs for overweight and obesity [Citation50]. Furthermore, maternal smoking during pregnancy was shown to increase the risk of overweight and obesity in young adults [Citation48].
The limitations of the study
The population size in the current study was small, although with a relatively high participation rate, reflecting the small Greenlandic population. We are aware about the limitations, especially when dividing the study population into age and gender groups. Therefore, we decided to present the data for all ages including both genders together, but for further data insight also giving the data for the four age groups and boys and girls separately. There might be regional differences and care should be taken, when comparing our data with other Greenlandic towns and cities, especially comparing west to the north, south and east (economic reasons did not permit inclusion of these regions), as these are dispersed over a large geographic area. However, 50% of the Greenlandic population lives in Nuuk, Sisimiut and Ilulissat [Citation51], and the proportion of children from Nuuk, Sisimiut and Ilulissat in the current study, reflects the population sizes in these cities/towns, being 64%, 20% and 16%, respectively [Citation51]. The missing values for some parameters were relatively high and therefore the percentage of missing data are given in the study tables for clarification. It is important to note that the number of data points for each analysed parameter differed between cities/towns as given in the result section and .
We considered maternal smoking status, verified by cotinine measurements, due to the relatively high smoking frequency among pregnant Greenlandic women. However, we did not include analyses of other parameters that could influence child growth, for example maternal age, pre-pregnancy BMI, nutrition and passive exposure to tobacco smoke early in life. Most studies focus on maternal parameters influencing foetal growth. Our study aim was to focus on the missing anthropometric growth data of Greenlandic preschool children and compare to other studies on Greenlandic children. Moreover, due to the low number of participants, multiple statistical adjustments can affect the statistical power.
In general, completion of questionnaires were with assistance of the health nurse that followed the child in the initial 2 years after birth, which would have benefitted the child measures, especially for BP. Furthermore, evaluating methodological discrepancies, such as inter-observer and intra-observer variation, between studies was difficult because of the lack of information on equipment and procedures, which was not available to us and often omitted in other studies [Citation3,Citation4].
We plan to follow-up on the ACCEPT children at school age and the presented study data can then be a part of a Greenlandic child growth curve – for comparison to other ethnic groups.
Conclusion
In this follow-up study of the ACCEPT birth cohort, we present anthropometric data and BP measures of Greenlandic pre-school children, aged 3.5–5.5 years. We found comparable measurements of H and W to previous studies, although BMI and the prevalence of overweight and obesity was higher. Height, W, HC and HiC increased significantly from 3.5 to 5.5 years, whereas height/weight ratio, waist/hip ratio and waist/height ratio decreased. The only gender-difference found was for HC, which was significantly larger in boys. Children of mothers that smoked during pregnancy had higher HiC, lower waist/hip ratio and a higher DBP. As in the adult population, estimating the extent of overweight and obesity in pre-school children necessitates a better understanding of specific growth patterns, body proportions, fat deposition and the levels of metabolic risk factors.
Supplemental Material
Download MS Word (440.1 KB)Acknowledgments
Our thanks goes to the participating families, the health nurses at the health care facilities in Nuuk and Sisimiut, and to the Clinical laboratories at the Regional Hospital in Sisimiut and Dronning Ingrid’s Hospital in Nuuk. Additionally, we thank all Colleagues at the Centre for Arctic Health & Molecular Epidemiology, Department of Public Health, Aarhus University, Denmark.
The establishment of the ACCEPT cohort was funded by the Danish Environmental Protection Agency (MST-112-00225 & MST-112-00289), and the follow-up was funded by the Danish Environmental Protection Agency (MST-113-00092) under the Danish Cooperation for Environment in the Arctic (DANCEA) program.
Disclosure statement
No potential conflict of interest was reported by the author(s).
Supplementary material
Supplemental data for this article can be accessed here.
Additional information
Funding
References
- Jamison PL. Secular trends and the pattern of growth in arctic populations. Soc Sci Med. 1990;30(6):751–18.
- Becker-Christensen FG. Growth in Greenland: development of body proportions and menarcheal age in Greenlandic children. Int J Circumpol Heal. 2003;62(3):284–295.
- Kløvgaard M, Nielsen NO, Sørensen TL, et al. Growth of children in Greenland exceeds the World Health Organization growth charts. Acta Paediatr. 2018;107(11):1953–1965.
- Galloway T, Niclasen BVL, Muckle G, et al. Growth measures among preschool-age Inuit children living in Canada and Greenland. Scand J Public Healt. 2012;40(8):712–717.
- Bjerregaard P, Larsen CVL. Three lifestyle-related issues of major significance for public health among the Inuit in contemporary Greenland: a review of adverse childhood conditions, obesity, and smoking in a period of social transition. Public Health Rev. 2018;39(1):5.
- Schnohr C, Sørensen TIA, Niclasen BV-L. Changes since 1980 in body mass index and the prevalence of overweight among in schooling children in Nuuk, Greenland. Int J Circumpol Heal. 2005;64(2):157–162.
- Schnohr CW, Petersen JH, Niclasen BV-L. Onset of overweight in Nuuk, Greenland: a retrospective cohort study of children from 1973 to 1992. Obesity. 2008;16(12):2734–2738.
- Niclasen BV-L, Petzold MG, Schnohr C. Overweight and obesity at school entry as predictor of overweight in adolescence in an Arctic child population. Eur J Public Health. 2007;17(1):17–20.
- Leggio M,Lombardi M, Caldarone E, et al. The relationship between obesity and hypertension: an updated comprehensive overview on vicious twins. Hypertens Res. 2017;40(12):947–963.
- Harsha DW, Bray GA. Weight loss and blood pressure control (Pro). Hypertension. 2008;51(6):1420–1425. discussion 1425.
- Williams CB, Mackenzie KC, Gahagan S. The effect of maternal obesity on the offspring. Clin Obstet Gynecol. 2014;57(3):508–515.
- Young TK. Are the circumpolar inuit becoming obese? Am J Hum Biol. 2007;19(2):181–189.
- Rønn PF, Andersen GS, Lauritzen T, et al. Ethnic differences in anthropometric measures and abdominal fat distribution: a cross-sectional pooled study in Inuit, Africans and Europeans. J Epidemiol Commun H. 2017;71(6):536–543.
- Child Growth WHO. Standards based on length/height, weight and age. Acta Paediatr Suppl. 2006;450:76–85.
- Grummer-Strawn LM, Reinold C, Krebs NF Use of World Health Organization and CDC growth charts for children aged 0-59 months in the USA. MMWR Recommendations and reports: Morbidity and mortality weekly report Recommendations and reports. 2010;59( Rr-9):1–15.
- Natale V, Rajagopalan A. Worldwide variation in human growth and the World Health Organization growth standards: a systematic review. BMJ Open. 2014;4(1):e003735.
- Tinggaard J, Aksglaede L, Sørensen K, et al. The 2014 Danish references from birth to 20 years for height, weight and body mass index. Acta Paediatr. 2014;103(2):214–224.
- Erratum. Erratum. Acta Paediatr. 2016;105(4):434.
- Júlíusson PB, Roelants M, Hoppenbrouwers K, et al. Growth of Belgian and Norwegian children compared to the WHO growth standards: prevalence below −2 and above +2 SD and the effect of breastfeeding. Arch Dis Child. 2011;96(10):916–921.
- Christesen HT, Pedersen BT, Pournara E, et al. Short stature: comparison of WHO and National Growth Standards/References for height. PLoS One. 2016;11(6):e0157277.
- Bjerregaard P, Dewailly E, Young TK, et al. Blood pressure among the Inuit (Eskimo) populations in the Arctic. Scand J Public Healt. 2003;31(2):92–99.
- Jørgensen ME, Pedersen MB, Siggaard C, et al. Twenty-four-hour blood pressure among Greenlanders and Danes: relationship to diet and lifestyle. Scand J Clin Lab Invest. 2002;62(6):413–422.
- Munch-Andersen T, Sorensen K, Andersen LB, et al. Adverse metabolic risk profiles in greenlandic inuit children compared to danish children. Obesity. 2013;21(6):1226–1231.
- Terkelsen AS, Long M, Hounsgaard L, et al. Reproductive factors, lifestyle and dietary habits among pregnant women in Greenland: the ACCEPT sub-study 2013–2015. Scand J Public Healt. 2018;46(2):252–261.
- Mortensen LM, Bech BH, Nohr EA, et al. Data resource profile: the Aarhus birth cohort biobank (ABC biobank). Int J Epidemiol. 2013;42(6):1697–1701.
- Høyer BB, Ramlau-Hansen CH, Vrijheid M, et al. Anthropometry in 5- to 9-Year-Old Greenlandic and Ukrainian children in relation to prenatal exposure to perfluorinated Alkyl substances. Environ Health Perspect. 2015;123(8):841–846.
- Cole TJ, Bellizzi MC, Flegal KM, et al. Establishing a standard definition for child overweight and obesity worldwide: international survey. BMJ. 2000;320(7244):1240.
- Budtz AES, Lynge AR, Budtz CS, et al. Weight among children born 2005-2011 in Nuuk at the time of school entry. Int J Circumpol Heal. 2019;78(1):1618667.
- Raben A. Jumbosize Europe? European Union conference on obesity calls for immediate action. Scand J Nutr. 2003;47(1):29–38.
- Farooqi IS, O’Rahilly S. Genetic factors in human obesity. Obes Rev. 2007;8(Suppl 1):37–40.
- Charbonneau-Roberts G, Saudny-Unterberger H, Kuhnlein HV, et al. Body mass index may overestimate the prevalence of overweight and obesity among the Inuit. Int J Circumpol Heal. 2005;64(2):163–169.
- Jørgensen ME, Glümer C, Bjerregaard P, et al. Obesity and central fat pattern among Greenland Inuit and a general population of Denmark (Inter99): relationship to metabolic risk factors. Int J Obesity. 2003;27(12):1507–1515.
- Bjerregaard P, Pedersen HS, Mulvad G. The associations of a marine diet with plasma lipids, blood glucose, blood pressure and obesity among the inuit in Greenland. Eur J Clin Nutr. 2000;54(9):732–737.
- Moore LM, Fals AM, Jennelle PJ, et al. Analysis of pediatric Waist to hip ratio relationship to metabolic syndrome markers. J Pediatr Health Car. 2015;29(4):319–324.
- Lo K, Wong M, Khalechelvam P, et al. Waist-to-height ratio, body mass index and waist circumference for screening paediatric cardio-metabolic risk factors: a meta-analysis. Obes Rev. 2016;17(12):1258–1275.
- Mokha JS, Srinivasan SR, DasMahapatra P, et al. Utility of waist-to-height ratio in assessing the status of central obesity and related cardiometabolic risk profile among normal weight and overweight/obese children: the Bogalusa heart study. BMC Pediatr. 2010;10(1):73.
- Roswall J, Bergman S, Almqvist-Tangen G, et al. Population-based waist circumference and waist-to-height ratio reference values in preschool children. Acta Paediatr. 2009;98(10):1632–1636.
- Inokuchi M, Matsuo N, Takayama JI, et al. Waist-to-height ratio centiles by age and sex for Japanese children based on the 1978–1981 cross-sectional national survey data. Int J Obesity. 2016;40(1):65–70.
- Singh I, Grover K. Nutritional profile of urban preschool children of Punjab. Anthropologist. 2003;5(3):149–153.
- Maiti S, Ali KM, Ghosh D, et al. Assessment of head circumference among Pre-school Children of Midnapore Town, West Bengal using WHO (2007) recommended Cut-off points. Int J Prev Med. 2012;3(10):742–744.
- Savage SA, Reilly JJ, Edwards CA, et al. Adequacy of standards for assessment of growth and nutritional status in infancy and early childhood. Arch Dis Child. 1999;80(2):121–124.
- WHO MGRSG. WHO Child Growth Standards: head circumference-for-age, arm circumference-for-age, triceps skinfold-for-age and subscapular skinfold-for-age: methods and development. WHO Child Growth Standards: Methods and development. 2007.
- Lurbe E, Cifkova R, Cruickshank JK, et al. Management of high blood pressure in children and adolescents: recommendations of the European Society of Hypertension. J Hypertens. 2009;27(9):1719–1742.
- National High Blood Pressure Education Program working group on high blood pressure in children and adolescents. The fourth report on the diagnosis, evaluation, and treatment of high blood pressure in children and adolescents. Pediatrics. 2004;114(2 Suppl 4th Report):555-576.
- Flynn JT, Kaelber DC, Baker-Smith CM, et al. Clinical practice guideline for screening and management of high blood pressure in children and adolescents. Pediatrics. 2017;140(3):e20171904.
- Valera B, Muckle G, Poirier P, et al. Cardiac autonomic activity and blood pressure among Inuit children exposed to mercury. Neurotoxicology. 2012;33(5):1067–1074.
- Knudsen A-KS, Long M, Pedersen HS, et al. Lifestyle, reproductive factors and food intake in Greenlandic pregnant women: the ACCEPT – sub-study. Int J Circumpolar Health. 2015;74(1):29469.
- Mamun AA, O’Callaghan MJ, Williams GM, et al. Maternal smoking during pregnancy predicts adult Offspring Cardiovascular Risk Factors – evidence from a community-Based Large birth cohort study. PLoS ONE. 2012;7(7):e41106.
- Cabral M, Fonseca MJ, González-Beiras C, et al. Maternal smoking: a life course blood pressure determinant? Nicotine Tob Res. 2018;20(6):674–680.
- Rayfield S, Plugge E. Systematic review and meta-analysis of the association between maternal smoking in pregnancy and childhood overweight and obesity. J Epidemiol Commun H. 2017;71(2):162–173.
- Groenlands statistik. Statistikbanken. Cited 2020 Nov 4 11.00 AM. Available from: https://bank.stat.gl/pxweb/da/Greenland