
ABSTRACT
Muscle strength is an important predictor for function and mortality among older adults. We measured hand grip strength among 1442 participants aged 15+ years and carried out a 30 second chair stand test among 786 participants aged 55+ years. Neither test has been carried out among the Inuit before. We present reference values for men and women as means with standard deviations and medians with 10th, 25th, 75th and 90th percentiles. Hand grip strength was higher among men than among women (means 45.2 kg and 25.8 kg; p < 0.0001), in linear regression analyses it increased with height (βmen = 0.69; βwomen = 0.46), weight (βmen = 0.24; βwomen = 0.08) and body mass index (βmen = 0.56; βwomen = 0.24), and decreased with age (βmen = −0.49; βwomen = −0.29) and Inuit genetic ancestry (βmen = −0.96; βwomen = −0.59). Chair stand score showed similar associations with sex (mean score for men and women 13.8 and 11.5; p < 0.0001), age (βmen = −0.22; βwomen = −0.20) and Inuit genetic ancestry (βmen = −0.38; βwomen = −0.41). The hand grip strength of the Inuit was at the same level as in European and North American populations whereas chair stand score was lower than that of a mostly white US population.
Introduction
Muscle strength decreases with age and has in several studies from around the world been shown to predict morbidity and mortality. Hand grip test and chair stand test are two widely used tests to assess muscular strength. Neither test has been carried out among the Inuit.
Hand grip strength is an indicator of upper body strength but is also used as an indicator of overall muscle strength in population studies [Citation1,Citation2]. Hand grip strength varies significantly according to age, sex and height [Citation3–11] as well as ethnicity [Citation9,Citation10,Citation12, Citation13,Citation14]. Hand grip strength is a predictor of overall mortality, cardiovascular death and disease, respiratory disease and cancer [Citation6,Citation15][Citation10,Citation16–20]. Hand grip strength predicted length of stay in hospital among hospitalised older patients [Citation21] and future cognitive function measured by the Mini Mental State Examination (MMSE) [Citation22].
Chair stand test is a functional test which measures the ability to rise from a chair. It is a test of lower extremity muscle strength, balance and coordination but other functional domains are also involved, such as endurance [Citation23]. Several studies have concluded that it is a valid test for lower extremity strength [Citation24–26]. Chair stand test predicted 10-year survival [Citation27] and along with several other measurements of muscular strength future cognitive decline [Citation22]. Chair stand test has mostly been used among older adults and the few studies available give little information about ethnic variation. Lower extremity strength decreased with age [Citation23,Citation28,Citation29] and men had greater strength than women [Citation23].
Muscle strength, in particular hand grip strength, has been shown to vary significantly according to world region and ethnicity. For instance, among 61–70-year-old adult men the median hand grip strength was 40 among European/North American participants and 27 among South Asian participants [Citation9]. Although some of the differences may be due to differences in height, it seems problematic to apply similar reference values to all populations. Reference values are therefore necessary at an ethnic or at least national level.
The purpose of the article is to present reference values by age and sex for hand grip strength and chair stand test among Greenlandic Inuit, to compare the findings internationally and to explore the association of muscle strength with height, weight, body mass index and Inuit genetic ancestry.
Methods
Data collection
Data were collected from 2017 to 2019 as part of a countrywide cross-sectional health survey in Greenland () [Citation30]. The participants, aged 15 years and older, were selected through a stratified random sample of adults in Greenland, who had been born in Greenland or Denmark. From each of five strata defined according to geographical criteria (South, Mid, Northwest, North and East Greenland), 20 towns and villages were chosen at random. From 12 towns, a random sample of inhabitants aged 15+ years were invited and from 8 villages all inhabitants were invited to participate in the study. Data were collected by interviews and self-administered questionnaires. The participation rate was 52%. Interviews provided information about socio-demographic factors and health. Questionnaires were developed in the Danish language, translated into Greenlandic (kalaallisut), back-translated and revised. Interviews were conducted in the participant’s language of choice, which was most often Greenlandic, by native Greenlandic speaking interviewers who had been trained in the study procedures. A total of 2,436 Inuit participated in the survey. Inuit ethnicity was defined by the interviewers at enrolment based on primary language and self-identification.
Hand grip strength
A total of 908 participants aged 55 and above were invited to participate in the measurement of hand grip strength. Of these, 95 were excluded: 18 because of physical impairments, 11 because of equipment failure, and 9 persons declined to participate. For 57 persons there was no information about why the test was not carried out. One outlier and two participants with less than 3 measurements were also excluded bringing the total number of valid measurements among the 55+ year-old to 810. The characteristics of the 810 test participants were compared with those of all 908 survey participants in the age group. According to an additional protocol, 650 participants aged 15–54 from 10 communities visited after 1 June 2018, were invited and 634 participated. The reasons for non-participation were not recorded. Two participants with less than 3 measurements were excluded bringing the total number of valid measurements to 632. The characteristics of the 632 test participants were compared with those of those of all 1528 survey participants in the age group. For , participants with diabetes, coronary artery disease, stroke and chronic obstructive lung disease were excluded (n = 153) in order to assure comparability with published values [Citation9]. The test was carried out by 11 examiners of whom 9 only spoke Danish. The examiners had no prior experience with the test but had been instructed in the measurement of hand grip strength as part of the general training in study procedures.
Table 1. Population characteristics of 908 Greenlandic Inuit aged 55 + . Greenland Population Health Survey 2018
Table 2. Population characteristics of 1,528 Greenlandic Inuit aged 15–54. Greenland Population Health Survey 2018
Table 3. Hand grip strength and chair stand test (CS-30) by demographic, anthropometric and genetic indicators and social position. Adjustment for age and height in univariate general linear models and multiple linear regression. Greenland Population Health Survey 2018
Table 4. Reference values for maximal hand grip strength (kg). Greenland Population Health survey 2018 (n = 1442)
Table 5. Reference values for chair stand test (CS-30). Greenland Population Health survey 2018 (n = 786)
Table 6. Hand grip strength (kg) in Greenland and seven world regions. Observed medians (25th – 75th percentiles); for Greenland medians and percentiles estimated from quantile regressions. Participants without certain chronic diseases. Regions sorted by descending overall average grip strength
Grip strength was measured by a SAEHAN DHD-1 digital hand dynamometer [https://www.procare.dk/da/produkter/haandtryks-kraftmaaling/digital-hand-dynamometer]. The participant was seated at a table with the feet firmly placed on the ground, the elbow resting on the table and the forearm parallel with the table. The dynamometer was adjusted to fit the participant’s hand. After instruction, the participant pressed the dynamometer until maximum strength was shown and the results were recorded in kilograms with one decimal. The test was performed 3 times with both hands alternating between hands. Hand dominance was noted. Some encouragement was allowed but not outright cheering. For statistical analysis the maximum of the measurements was chosen [Citation31]. For , the mean value of the maximum measurement of the right and left hand was used in order to assure comparability with published values [Citation9]. The measurements were regarded as normally distributed according to visual inspection of a Q-Q plot.
Chair stand test
908 participants aged 55 and above were invited to participate in the chair stand test (SC-30) as a measurement of lower body strength. Of these, 122 were excluded: 62 because of pain in joints or back, 12 declined to participate, 10 were excluded because of heart disease or dizziness and 7 for other reasons whereas the reason was not specified for 31 participants. The total number of valid measurements was thus 786. The characteristics of the 786 test participants were compared with those of those of all 908 survey participants in the age group. The test was carried out by four examiners who all spoke Greenlandic. The examiners had no prior experience with the test but had been instructed in the chair stand test as part of the general training in study procedures. The participant was seated on a chair placed against the wall with the back touching the chair and the feet flat on the ground. The chair was not standardised but at each location a chair with a seat height of 43–45 centimetres without armrests was procured. The arms were crossed at the wrists and the palms were placed loosely around the collarbones. After instruction, a test attempt was carried out. Participants who did not pass the test attempt scored 0. The participants were then asked to stand and then sit down on the chair as many times as possible and as quickly as possible within 30 seconds without using the arms. Some encouragement was allowed but not outright cheering. The number of times the participant was able to fully stand up was recorded. The exercise was stopped if the participant became tired and short of breath, began to use the arms or if the instructor was otherwise concerned about the safety of the participant. The measurements were regarded as normally distributed according to visual inspection of a Q-Q plot.
Anthropometric and sociodemographic data
Age was calculated as date of interview – date of birth truncated. Sex and date of birth were derived from the civil registration number. For participants aged 18+ years (N = 2,360), education was recorded from survey information on school and occupational education into four categories according to the highest achievement: primary and secondary school only; short vocational education (1–2 years); medium long education (2–3 years); long education, university (4+ years). Information on education was available for 2,270 participants (96%). Participants were asked about their ownership of six household items: video/DVD player, computer, microwave oven, washing machine, dishwashing machine and internet. Here, 0/1 answers were added, yielding a household asset score ranging from 0 to 6. The household asset score is an indicator of social position that is closely associated with more traditional measures of socioeconomic position, such as education and income, but it has certain practical advantages and is often used in a Greenlandic context [Citation32, 2018]. All participants answered these questions.
Height and weight were measured with the participants stripped to their underwear and socks. Weight was measured on a standard electronic clinical scale. Height and weight were recorded with one decimal. Body mass index was calculated as weight/height2 (kg/m2). Information on body mass index was available for 2366 participants (97%).
Health
Self-rated health was assessed by the question “How would you rate your health in general?” Participants who answered, “really good” or “good” were classified as having good self-rated health; the other possible answers were “average”, “poor” and “very poor”. The presence of musculoskeletal symptoms was based on the following three questions: “During the last two weeks, have you been bothered by pain or discomfort in 1) neck or shoulders; 2) back or lower back; 3) arms, hands, legs, knees, hips or joints”. Those who answered that they had been “bothered a lot” to at least one question were classified as having musculoskeletal symptoms. The presence of certain chronic diseases was ascertained from four questions: “Did a doctor ever tell you that you suffered from 1) diabetes; 2) acute coronary disease; 3) stroke; 4) chronic obstructive lung disease”. Participants were included even if they suffered from one or more of these conditions and thus represent the normal clientele of a health centre. Participants with one or more of these chronic diseases were excluded from the international comparisons of hand grip strength.
Genetic admixture
A subset of the participants (n = 1,005) were genotyped for European admixture using about 200,000 SNPs on the Illumina CardioMetaboChip [Citation33] assuming two ancestral populations, i.e. Inuit and European. Admixture was recorded as the estimated proportion of Inuit genetic ancestry, which ranged from 0.17 to 1.0 (median 0.79). The European admixture has been shown to be almost entirely of recent Danish origin [Citation34].
Statistics
Statistical analyses were performed by the standard statistical software IBM SPSS Statistics version 26.0. Analyses included cross tables with chi-square tests, median tests, means with ANOVA, univariate general linear models, multiple linear regression analyses and quantile regression. Reference values for muscle strength were presented as observed means and medians with 10th, 25th, 75th and 90th percentiles. In , mediation analyses were performed in SPSS by the extension module PROCESS v. 3.5.3 [Citation35].
Ethical considerations
Ethical approval of the study was obtained from Greenlandic Ethics Committee (KVUG 2017–05) and written informed consent was obtained from all participants.
Results
shows characteristics of the 908 Inuit aged 55+ years who were invited to participate in the measurements of muscle strength. Those who participated were slightly younger than non-participants (p < 0.0001). Other statistically significant differences (p ≤ 0.01) included household assets and body mass index for hand grip test and household assets, height, self-rated health and musculoskeletal symptoms for chair stand test, but the differences were small. shows the same for 1528 Inuit aged 15–54 years among whom 632 participated in the hand grip strength measurements. Those who participated were slightly older (p < 0.0001) and other statistically significant differences (p ≤ 0.01) included weight and body mass index, but the differences were small.
In both measures of muscle strength were analysed for associations with demographic, anthropometric, genetic and social factors. Both hand grip test and chair stand test decreased with age and was higher among men than among women. Adjusted for age, height as well as weight and body mass index were directly associated with hand grip strength but not with chair stand test. Judged by the standardised regression coefficient, height was the most important anthropometric variable for grip strength (results not shown). Adjusted by age, the estimated proportion of Inuit ancestry was inversely associated with hand grip strength. A mediation analysis showed that both the direct effect and the effect mediated by height were inverse and statistically significant. For chair stand test, the total effect of Inuit ancestry was also inverse but statistically significant only among women. Finally, adjusted for age, height and Inuit ancestry, social position was directly associated with hand grip test among both men and women but not with chair stand test. The association between upper and lower extremity strength as measured by hand grip test and chair stand test was statistically significant in a linear regression model (Grip strength = 19.3 + 0.88*chair stand score; p < 0.0001).
presents descriptive reference values for the hand grip test as observed means (SD) and medians with 10th, 25th, 75th and 90th percentiles within age groups. presents reference values for the 30-s chair stand test as observed means (SD) and medians with 10th, 25th, 75th and 90th percentiles within age groups.
We compared the grip strength of participants from Greenland estimated by quantile regression with that of seven world regions [Citation9] (). Populations from Europe and North America had the highest average grip strength over the whole age span closely followed by the Greenland Inuit (all Inuit participants irrespective of their degree of Inuit genetic ancestry). Grip strength decreased with age in all populations. We furthermore examined the grip strength of Inuit from the highest and lowest quartiles of Inuit genetic ancestry. Those from the lower quartile had higher grip strength than persons from Europe and North America whereas those from the upper quartile had grip strength between that of persons from the Middle East and South East Asia.
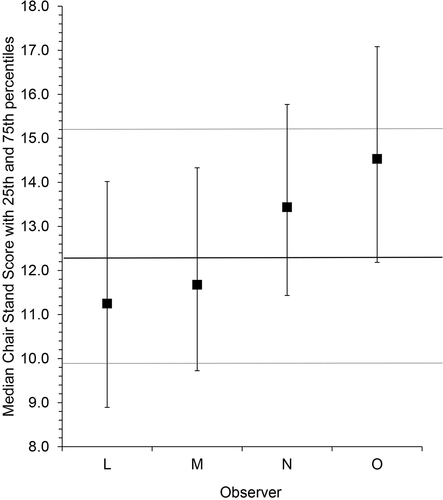
shows the variation among 11 examiners of grip strength. The measurements were adjusted for differences in age, sex and height of the participants. The variation among examiners was statistically significant (p < 0.0001) but only observer A fell outside the 25th-75th percentile interval of the total. There was no difference in muscle strength measurements according to the language capability of the examiner (p = 0.52). shows the variation among four examiners of the chair stand test. Although statistically different (p < 0.0001) they also fell reasonably within the 25th-75th percentiles of the total.
Figure 1. Map of the circumpolar region and Greenland with data collection sites marked with grey circles. Circumpolar map by Winfried Dallmann, Norwegian Polar Centre
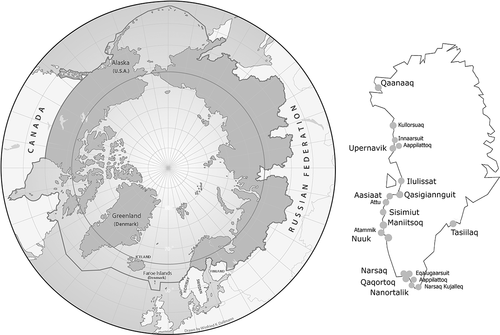
Figure 2. Hand grip strength measurements by 11 observers estimated from quantile regression. Greenland Population Health survey 2018 (n = 1420). Medians with 25th and 75th percentiles. Solid line is median of all measurements, dotted lines are percentiles
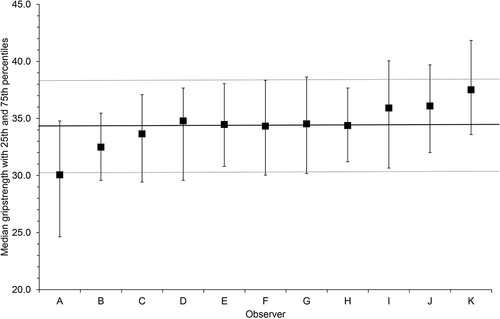
Figure 3. Chair stand test by 4 observers estimated from quantile regression. Greenland Population Health survey 2018 (n = 786). Medians with 25th and 75th percentiles. Solid line is median of all measurements, dotted lines are percentiles
Discussion
We have presented reference values for hand grip strength for Greenlandic Inuit aged 15+ and 30 seconds chair stand test for Greenlandic Inuit aged 55+, analysed muscle strength in relation to demographic, anthropometric and genetic indicators and social position and compared values for hand grip strength with published results from other ethnic groups. Like in other studies, muscle strength was higher among men than among women and decreased significantly with age. Grip strength increased significantly with height, weight and body mass index, and for a subset of participants decreased with the proportion of Inuit ancestry. The results regarding height, weight and body mass index are consistent with previous studies [Citation9]. Chair stand score decreased by age and, among women, increased by height and weight. A similar age pattern was found in several studies [Citation23,Citation28,Citation36] whereas only one study addressed variation by anthropometric variables and found an increase by weight but no variation by height [Citation25].
Grip strength and, for women, chair stand score, increased by social position after adjustment for age, height and Inuit ancestry. This is in concordance with most studies of both social position in childhood [Citation37,Citation38] and later in life [Citation39,Citation40]. These studies have been carried out mostly in the UK and other European countries, but also Latin American countries showed an increase in muscle strength by social position [Citation41]. One study from the UK did not find any association of childhood or adult social position with grip strength [Citation42]. In Greenland, social position is associated with diet, physical activity and smoking which could all contribute towards an explanation for the variation in muscle strength with social position [Citation43–47].
For hand grip strength, a significant variation has been observed among seven world regions [Citation9]. The level of hand grip strength differed among populations but followed similar age and sex patterns. However, Greenlandic men and women both exhibited a steeper decrease in hand grip strength than participants from other parts of the world from the age interval 51–60 years to 61–70 years. This might indicate the existence of a cumulative exposure to environmental factors which are more prevalent in Greenland than in other countries, such as for instance smoking or dietary exposure to environmental contaminants [Citation30,Citation44,Citation48] Nielsen and Bjerregaard 2017.
Given that the world regions studied by Leong and co-workers comprised 21 different countries and an unknown number of ethnic groups it is only a rough indication of ethnic variation. There are few studies of single ethnic groups which, however, do point to similar differences. One study compared male Mizos from Northern India with white male Germans and found lower hand grip strength among the former [Citation12]. Another study compared Malay, Chinese and Indian participants from Singapore and found that Chinese men had higher hand grip strength than the two other ethnic groups whereas Chinese women had lower hand grip strength than the two other groups. However, the analyses were not adjusted for occupation and the differences were not statistically significant (Hossain et al. 2012). Furthermore, a study compared children and adolescents of the Turkana from northern Kenya with other ethnic groups. Their hand grip strength was lower than that of African Americans and Zapotec children from Oaxaca, Mexico and not very different from a mixed sample of Khoisan, Bantu, European, and Asian children from South Africa [Citation14].
Genetically, Greenlandic Inuit are a heterogenous population with a wide variation in European genetic admixture to the original Inuit genome, which has Asian roots [Citation49,Citation50]. In the study by Leong and co-workers [Citation9] hand grip strength was lowest in the Asian countries and we found accordingly that the hand grip strength of the participants with the highest level of Inuit genetic ancestry was as low as in several Asian countries whereas that of the Inuit with the least Inuit genetic ancestry resembled that of European and North American populations.
There is less information published about ethnic differences for chair stand test. Reference values for the USA [Citation51] were about 20% higher than for Inuit in Greenland whereas reference values for Hong Kong were at the same level as for Inuit [Citation36].
Our experience from the field showed that it was easy to instruct the participants in the hand grip test and to carry out the procedure. The chair stand test on the other hand presented more problems. It is of some concern for its use in clinical practice that as many as 122 (13%) of those aged 55+ years who were invited to participate had to be excluded mostly because of pain in the joints or the back. One examiner reported that instruction of the participants could be difficult and that encouragement during the procedure was necessary for the participants to understand the importance of speed during the test, but this was not the general impression of the examiners. On the positive side, only one case of equipment failure was noted – the chair was too high for the participant to reach the floor with her feet.
In clinical practice, the test results can be used to define and predict functional fitness of the upper and lower extremities. There is no universally agreed on cut-off points for frailty, but strength below the 25% percentile of the population studied or the means of a population of low-functioning individuals have been used as rough normative criteria [Citation52]. As a criterion reference standard for hand grip strength, a value of 27.8 kg for men and 16.0 kg for women was found to maintain instrumental activities of daily life [Citation53] whereas values <26 kg for men and <16 kg for women were indicative of muscle weakness [Citation15]. For the chair stand test, a score of 8–9 has been suggested as the level of muscle strength needed to maintain activities of daily life [Citation52,Citation54]. It seems logical to assume that the same absolute level of muscle strength is needed for all individuals to ensure functional ability and it is therefore questionable to advocate different cut-off values for men and women and for different ethnic groups. Since muscle strength decreased by age, a higher cut-off point is needed at a young age in order to maintain functional ability in late life [Citation54].
Strengths and weaknesses
Data was collected in a countrywide population health survey and is representative of Greenlandic Inuit from towns and villages. The participants were randomly selected from all age groups. In the oldest age groups the number of participants was therefore small. Only 41 men and 58 women aged 75+ participated in the hand grip test and only 33 and 44 men and women, respectively, in the chair stand test and the estimates of muscle strength were accordingly imprecise among the oldest participants. This is a drawback since the measurement of muscle strength is particularly germane among older adults. There was significant inter-observer variation for the measurement of hand grip strength as well as for the chair stand test, but the study design did not permit a further estimation of whether this was due to insufficient adjustment in the analyses, to insufficient instruction of the staff or other reasons. It points, however, to the need of a genuine inter- and intra-observer variation study and the importance of further instruction of examiners in future studies.
In the daily clinical work with older adult patients, the reference values will be useful as benchmarks for muscle strength and physical performance with the limitations in mind that the number of participants aged 75+ was small. It is suggested that future studies of muscle strength in Greenlandic Inuit add more participants aged 75+, address the cumulated effect of smoking and environmental contaminants as determinants of muscle strength and the association of muscle strength among older adults with the ability to perform activities of daily life, as well as its association with physical and mental health.
Conclusion
We have for the first time presented reference values for muscle strength among Greenlandic Inuit aged 15+ for hand grip test and aged 55+ for chair stand test (CS-30) although the number of participants aged 75 years and older was small. Muscle strength has been shown to vary by sex, age, height and other anthropometric variables, Inuit genetic ancestry and social position. The reference values can be used in the clinical setting to estimate the prognosis for a variety of health issues among older adult Inuit in Greenland, but further studies are needed to establish the association of muscle strength with activities of daily life and mental health. Studies are also needed to confirm the observed difference between populations of age-related decrease in hand grip strength and to explore the possible causes of this.
Data availability
Data will be deposited at the Danish National Archives from where it will be made available anonymously upon reasonable request.
Acknowledgments
We thank Ida Moltke, Torben Hansen and Anders Albrechtsen from University of Copenhagen for the permission to use the data on genetic admixture in the Greenlandic population.
Disclosure statement
No potential conflict of interest was reported by the author(s).
References
- Bohannon RW. Are hand-grip and knee extension strength reflective of a common construct? Percept Mot Skills. 2012;114:514–11.
- Strandkvist V, Larsson A, Pauelsen M, et al. Hand grip strength is strongly associated with lower limb strength but only weakly with postural control in community-dwelling older adults. Arch Gerontol Geriatr. 2021;94:104345.
- Chong CK, Tseng CH, Wong MK, et al. Grip and pinch strength in Chinese adults and their relationship with anthropometric factors. J Formos Med Assoc. 1994;93:616–621.
- Dodds RM, Syddall HE, Cooper R, et al. Grip strength across the life course: normative data from twelve British studies. PLoS One. 2014;9:e113637.
- Frederiksen H, Hjelmborg J, Mortensen J, et al. Age trajectories of grip strength: cross-sectional and longitudinal data among 8,342 Danes aged 46 to 102. Ann Epidemiol. 2006;16:554–562.
- Gale CR, Martyn CN, Cooper C, et al. Grip strength, body composition, and mortality. Int J Epidemiol. 2007;36:228–235.
- Günther CM, Bürger A, Rickert M, et al. Grip strength in healthy caucasian adults: reference values. J Hand Surg AM 2008;33:558–565. .
- Kim CR, Jeon YJ, Kim MC, et al. Reference values for hand grip strength in the South Korean population. PLoS One. 2018;13:e0195485.
- Leong DP, Teo KK, Rangarajan S, et al. Reference ranges of handgrip strength from 125,462 healthy adults in 21 countries: a prospective urban rural epidemiologic (PURE) study. J Cachexia Sarcopenia Muscle. 2016;7:535–546.
- Oksuzyan A, Demakakos P, Shkolnikova M, et al. Handgrip strength and its prognostic value for mortality in Moscow, Denmark, and England. PLoS One. 2017;12:e0182684.
- Yu R, Ong S, Cheung O, et al. Reference Values of Grip Strength, Prevalence of Low Grip Strength, and Factors Affecting Grip Strength Values in Chinese Adults. J Am Med Dir Assoc. 2017;18:551.e9–551.e16.
- Fink B, Thanzami V, Seydel H, et al. Digit ratio and hand-grip strength in German and Mizos men: cross-cultural evidence for an organizing effect of prenatal testosterone on strength. Am J Hum Biol. 2006;18:776–782.
- Hossain MG, Zyroul R, Pereira BP, et al. Multiple regression analysis of factors influencing dominant hand grip strength in an adult Malaysian population. J Hand Surg Eur 2012;37:65–70.
- Little MA. Grip strength and body composition in Turkana pastoralist children and adolescents. Am J Hum Biol. 2017;29. DOI:https://doi.org/10.1002/ajhb.22922
- Celis-Morales CA, Welsh P, Lyall DM, et al. Associations of grip strength with cardiovascular, respiratory, and cancer outcomes and all cause mortality: prospective cohort study of half a million UK Biobank participants. BMJ. 2018;361:k1651.
- Leong DP, Teo KK, Rangarajan S, et al. Prognostic value of grip strength: findings from the Prospective Urban Rural Epidemiology (PURE) study. Lancet. 2015;386:266–273.
- Metter EJ, Talbot LA, Schrager M, et al. Skeletal muscle strength as a predictor of all-cause mortality in healthy men. J Gerontol A Biol Sci Med Sci. 2002;57:B359–65.
- Rantanen T, Harris T, Leveille SG, et al. Muscle strength and body mass index as long-term predictors of mortality in initially healthy men. J Gerontol A Biol Sci Med Sci. 2000;55:M168–73.
- Sasaki H, Kasagi F, Yamada M, et al. Grip strength predicts cause-specific mortality in middle-aged and elderly persons. Am J Med. 2007;120:337–342.
- Silventoinen K, Magnusson PK, Tynelius P, et al. Association of body size and muscle strength with incidence of coronary heart disease and cerebrovascular diseases: a population-based cohort study of one million Swedish men. Int J Epidemiol. 2009;38:110–118.
- Kerr A, Syddall HE, Cooper C, et al. Does admission grip strength predict length of stay in hospitalised older patients? Age Ageing. 2006;35:82–84.
- Auyeung TW, Lee JS, Kwok T, et al. Physical frailty predicts future cognitive decline - a four-year prospective study in 2737 cognitively normal older adults. J Nutr Health Aging. 2011;15:690–694. PMID: 21968866
- Jones CJ, Rikli RE, Beam WC. A 30-s chair-stand test as a measure of lower body strength in community-residing older adults. Res Q Exerc Sport. 1999;70:2.
- Benton MJ, Alexander JL. Validation of functional fitness tests as surrogates for strength measurement in frail, older adults with chronic obstructive pulmonary disease. Am J Phys Med Rehabil. 2009;88:579–583. quiz 584-6, 590. PMID: 19542782.
- Johansson J, Strand BH, Morseth B, et al. Differences in sarcopenia prevalence between upper-body and lower-body based EWGSOP2 muscle strength criteria: the Tromsø study 2015-2016. BMC Geriatr. 2020;20:461.
- Ostchega Y, Harris TB, Hirsch R, et al. Reliability and prevalence of physical performance examination assessing mobility and balance in older persons in the US: data from the Third National Health and Nutrition Examination Survey. J Am Geriatr Soc. 2000;48:1136–1141. PMID: 10983916
- Arnau A, Espaulella J, Méndez T, et al. Lower limb function and 10-year survival in population aged 75 years and older. Fam Pract. 2016;33:10–16. Epub 2015 Nov 11. PMID: 26560093.
- Nakazono T, Kamide N, Ando M. The Reference Values for the Chair Stand Test in Healthy Japanese Older People: determination by Meta-analysis. J Phys Ther Sci. 2014;26:1729–1731.
- Nielsen NO, Bjerregaard P Befolkningsundersøgelsen i Grønland 2014. Eksponering for miljøkontaminanter i Grønland. Kviksølv og persistente organiske forureningsstoffer (POP) [Population health survey in Greenland 2014. Exposure to environmental contaminants in Greenland. Mercury and persistent organic pollutants (POPs). In Danish]. Copenhagen, National Institute of Public Health, 2017. https://www.sdu.dk/sif/-/media/images/sif/udgivelser/2021/2017_eksponering_for_miljoekontaminanter_i_groenland.pdf (accessed Jul 2021).
- Larsen CVL, Hansen CB, Ingemann C, et al. Befolkningsundersøgelsen i Grønland 2018. Levevilkår, livsstil og helbred: oversigt over indikatorer for folkesundhed [Population health survey in Greenland 2018. Living conditions, lifestyle, and health: indicators for public health. In Danish]. Copenhagen: National Institute of Public Health. University of Southern Denmark; 2019 accessed May 2021).. https://www.sdu.dk/da/sif/rapporter/2019/befolkningsundersoegelsen_i_groenland
- Roberts HC, Denison HJ, Martin HJ, et al. A review of the measurement of grip strength in clinical and epidemiological studies: towards a standardised approach. Age Ageing. 2011;40:423–429.
- Bjerregaard P, Dahl-Petersen IK, editors. Befolkningsundersøgelsen i Grønland 2005–2007 [Population health survey in Greenland 2005–2007. In Danish]. Copenhagen: National Institute of Public Health, University of Southern Denmark; 2008.
- Moltke I, Fumagalli M, Korneliussen TS, et al. Uncovering the genetic history of the present-day Greenlandic population. Am J Hum Genet. 2015;96:54–69.
- Waples RK, Hauptmann AL, Seiding I, et al. The genetic history of Greenlandic-European contact. Curr Biol. 2021 In press
- Hayes AF. Introduction to Mediation, Moderation, and Conditional Process Analysis: a Regression-Based Approach. Second edition ed. New York: Guilford Press; 2018.
- Macfarlane DJ, Chou KL, Cheng YH, et al. Validity and normative data for thirty-second chair stand test in elderly community-dwelling Hong Kong Chinese. Am J Hum Biol. 2006;18:418–421.
- Hurst L, Stafford M, Cooper R, et al. Lifetime socioeconomic inequalities in physical and cognitive aging. Am J Public Health. 2013;103:1641–1648.
- Petersen GL, Pedersen JLM, Rod NH, et al. Childhood socioeconomic position and physical capability in late-middle age in two birth cohorts from the Copenhagen aging and midlife biobank. PLoS One. 2018;13:e0205019.
- Carney C, Benzeval M. Social patterning in grip strength and in its association with age; a cross sectional analysis using the UK Household Longitudinal Study (UKHLS). BMC Public Health. 2018;18:385.
- Rautio N, Heikkinen E, Ebrahim S. Socio-economic position and its relationship to physical capacity among elderly people living in Jyväskylä, Finland: five- and ten-year follow-up studies. Soc Sci Med. 2005;60:2405–2416.
- Birnie K, Cooper R, Martin RM, et al. Childhood socioeconomic position and objectively measured physical capability levels in adulthood: a systematic review and meta-analysis. PLoS One. 2011;6;e15564. DOI:https://doi.org/10.1371/journal.pone.0015564.
- Strand BH, Cooper R, Hardy R, et al. Lifelong socioeconomic position and physical performance in midlife: results from the British 1946 birth cohort. Eur J Epidemiol. 2011;26:475–483.
- Bjerregaard P, Dahl-Petersen I. How well does social variation mirror secular change in prevalence of cardiovascular risk factors in a country in transition. Am J Hum Biol. 2011;23:774–779.
- Bjerregaard P, Larsen CVL Three life-style related issues of major significance for public health among the Inuit in contemporary Greenland. A review of adverse childhood conditions, obesity and smoking in a period of social transition. Public Health Reviews 2018; DOI https://doi.org/10.1186/s40985-018-0085-8.
- Bjerregaard P, Larsen CVL, Dahl-Petersen IK, et al. Stable isotopes of carbon and nitrogen as markers of dietary variation among sociocultural subgroups of Inuit in Greenland. Am J Hum Biol. 2017;29. DOI:https://doi.org/10.1002/ajhb.23018
- Bjerregaard P, Dahl-Petersen IK, Larsen CVL. Measuring social inequality in health amongst indigenous peoples in the Arctic. A comparison of different indicators of social disparity among the Inuit in Greenland. SSM Popul Health. 2018;6:149–157.
- Dahl-Petersen IK, Jørgensen ME, Bjerregaard P. Physical activity patterns in Greenland: a country in transition. Scand J Public Health. 2011;39:678–686.
- Johansen P, Pars T, Bjerregaard P. Lead, cadmium, mercury and selenium intake by Greenlanders from local marine food. SciTotal Environ. 1999;245:187–194.
- Gulløv HC, Ed.. Grønlands forhistorie [Prehistory of Greenland. In Danish]. Nordisk Forlag, Copenhagen; 2004.
- Reich D, Patterson N, Campbell D, et al. Reconstructing native American population history. Nature. 2012;488. p. 370–374.
- Rikli RE, Jones CJ. Functional fitness normative scores for community-residing older adults, ages 60-94. J Aging Phys Act. 1999;7:162–181.
- Rikli RE, Jones CJ. Senior fitness test manual. Champaign, USA: Human Kinetics; 2001.
- Lee MC, Hsu CC, Tsai YF, et al. Criterion-Referenced Values of Grip Strength and Usual Gait Speed Using Instrumental Activities of Daily Living Disability as the Criterion. J Geriatr Phys Ther. 2018;41:14–19. PMID: 28079633
- Rikli RE, Jones CJ. Development and validation of criterion-referenced clinically relevant fitness standards for maintaining physical independence in later years. Gerontologist. 2013;53:255–267.