
ABSTRACT
The rising global obesity rate is alarming due to its real health and socioeconomic consequences. Finland, like other circumpolar regions, is also experiencing a rise in obesity . Here we assess BMI, body adiposity, and measures of cardiometabolic health among a small population of reindeer herders in sub-Arctic Finland. We collected anthropometric and biomarker measures at two different time points: October 2018 (N = 20) and January 2019 (N = 21) with a total of 25 unique individuals across the data collection periods (ages 20–64). Anthropometric measures included height, weight, age, and body composition. Biomarkers included measures of cholesterol, fasting glucose, HDL cholesterol, LDL cholesterol, and triglyceride levels. Over 70% of this sample was classified as “overweight” and “obese” as categorised by BMI and 64% classified as “overfat” based on body fat percentage. However, there was no significant relationship between BMI and body fat percentage with any of the measured biomarkers. Although the sample size is small, the results of this study suggest there might not be a strong correlation between BMI, body adiposity, and cardiometabolic health indices within this population – a pattern that has been documented elsewhere. However, further study is needed to confirm this lack of a correlation.
Introduction
In 2016, over 39% of the global adult population was considered “overweight” (based on body mass index, BMI kg/m2, of 25 to <30) and over 13% were considered “obese” (BMI ≥ 30), and percentages have since increased [Citation1]. This accelerating rise in the global obesity rate is alarming due to the very real health and socioeconomic consequences [Citation2,Citation3]. Socioeconomic consequences include rising hospital, medical intervention, and prescription medication costs, to name a few [Citation3]. Obesity often also carries numerous comorbidities such as hypertension, hyperlipidaemia, high cholesterol, type 2 diabetes, osteoarthritis, some cancers, and coronary heart disease among others [Citation1,Citation4–6]. In order to assess if an individual has obesity and/or suffers from poor cardiometabolic health, BMI is calculated along with measuring various biomarkers (fasting glucose, total cholesterol, high-density lipoprotein cholesterol, low-density lipoprotein, and triglyceride levels) [Citation7,Citation8]. However, it should be noted that BMI does not take body composition, particularly body adiposity vs. fat-free mass, into account [Citation9–11], and there is a growing body of evidence that BMI does not accurately indicate obesity nor metabolic risk factors similarly across different populations [Citation12–14]. As such, there are also body fat percentage cut-offs to determine “overfat”, which often has a similar relationship to cardiometabolic risk factors as does BMI [Citation1,Citation15].
Cardiometabolic health among circumpolar populations largely follows a global pattern of rising obesity rates and obesity comorbidities. However, a unique relationship between obesity and cardiometabolic markers among circumpolar populations has been documented in the recent past. For example, despite a high rate of obesity, numerous Indigenous circumpolar populations exhibited fasting glucose and lipid levels within the normal range, but also commonly exhibited hypertension [Citation16–22]. Some have suggested that this mosaic pattern is driven by a combination of cold climate adaptations and behaviour such as increased metabolic rate, which may increase blood pressure, and participation in traditional subsistence activities that would keep cardiometabolic biomarkers within normal ranges [Citation8,Citation19,Citation23–26]. More recently, work among the Yakut of Siberia found evidence that comorbidities often associated with obesity may be mediated by lifestyle such that individuals who more regularly participate in subsistence activities and consume more traditional diets have more favourable cardiometabolic profiles [Citation8,Citation27,Citation28]. However, greater market integration, which leads to reduced physical activity and a greater reliance on processed, refined foods, is driving a higher incidence of poor cardiometabolic health among circumpolar populations [Citation8,Citation24,Citation25,Citation27,Citation29–31].
Finland, the site of the present study, is no exception to the global obesity trend with over 22% of the Finnish population considered “obese” [Citation32]. Furthermore, Finland has some of the highest rates of cardiovascular disease in the world, though this is declining [Citation33–35]. However, less is known about reindeer herders in Finland who are highly physically active due to participation in subsistence practices [Citation36,Citation37], and exhibit an unusual metabolic pattern with females having higher resting metabolic rates than males [Citation38]. Here we examine the relationship between BMI, body adiposity, and cardiometabolic health biomarkers (fasting glucose, total cholesterol, high-density lipoprotein cholesterol, low-density lipoprotein, and triglyceride levels) among a small sample of highly active cold climate population of reindeer herders from sub-Arctic Finland. Due to the small sample size, this work is descriptive in nature, but adds to the complicated picture of circumpolar population health and helps inform hypotheses regarding the relationship between obesity and health.
Methods
This study is part of a larger project, “The metabolic cost of living among reindeer herders in northern Finland, 2017–2020” assessing the biological and cultural mechanisms for coping with a highly demanding occupation in an extreme cold environment. This larger project incorporated measurements of resting metabolic rate [Citation38], brown adipose tissue activity [Citation39], total energy expenditure [Citation36], and ethnographic interviews [Citation37]. Reindeer herders in Finland are both Indigenous Sami and Finnish, and their herding work blends traditional and modern technologies and practices [Citation37]. The data presented here are from two different time points: October of 2018 just prior to the autumn herd roundup and January 2019.
This study was conducted with Institutional Review Board approval from the University at Albany (17-E-165) and with the approval of the Northern Ostrobothnian Health Care District from the University of Oulu, Finland (EETTMK: 4/2018). Participants were provided with an oral introduction and a written information sheet about the study, and informed written consent (written in Finnish) was obtained from all participants [Citation40].
Participant population
Participants (October 2018: 20–62 years old, N = 20, 5 females and 15 males; January 2019: 20–64 years old, N = 21, 6 females and 15 males) were recruited from herding districts within 180 km Rovaniemi, Finland (66.5°N, 25.7°E). Four females and 12 males took part in both data collection periods. Participating females in this study were not pregnant or lactating at the time of data collection; menstrual cycle data were not collected at this time. The disproportionate number of males in this sample is representative of the female-to-male ratio among active herders [Citation41]. Data collection took place in the mornings at either the Arctic Centre of the University of Lapland in Rovaniemi, Finland or in herders’ homes, cabins, or a hotel room near the herding district of interest when participants were fasted.
The autumn data collection took place during the second week of October 2018, when the mean temperature was 1°C [Citation42]. This occurred just before the autumn herd roundup during which herders gather reindeer from their summer pastures, administer preventative parasite medication, ear mark calves, return stray reindeer to their proper herding districts, separate animals to be slaughtered from those spared, and process the meat from slaughtered reindeer [Citation37,Citation41]. The winter data collection took place in the final 2 weeks of January 2019, when the mean temperature was −16.5°C [Citation42]. During the winter, herders are occupied with daily reindeer feeding in the winter enclosures, bookkeeping, and sometimes tourism [Citation37]. We have provided a more detailed description of reindeer herding and of the herders elsewhere [Citation37,Citation38].
Anthropometrics
All anthropometric measures were taken in the morning before participants had eaten or consumed coffee. Participants were asked to refrain from alcohol consumption the day before scheduled measurements. Height, weight, and body composition measurements were all performed according to the standard protocol Citation43. We used a portable stadiometer (Seca Corporation, Hanover, MD) to record height to the nearest 1 mm. We used an electronic scale (AccuWeight, New York, NY) to record weight to the nearest 0.1 kg. We measured body composition using bioelectrical impedance (RJL systems, Clinton, MI), for which participants were in a supine position either on a cot or the floor. We placed small electrodes on the dorsum of the wrist, middle finger, ankle, and middle toe all on the right side of the body. We recorded reactance and resistance and used preset standard NHANES-III equations to determine fat-free mass and body fat percentage [Citation44]. Four-site skinfold thicknesses were also collected and measured. However, there was no significant difference between the bioelectric impedance values and skinfold measures [Citation38]. Only bioelectrical impedance results were used for further analysis.
Biomarkers
For both October 2018 and January 2019 data collection periods, we measured blood fasting glucose, total cholesterol, and high-density lipoprotein (HDL) cholesterol using a CardioChek PA. The CardioChek portable professional blood test device was fitted with fasting glucose and lipid panel test strips (Polymer Technology Systems, Inc., Indianapolis, IN). Finger-stick capillary whole blood samples were taken in the morning before participants had eaten. Blood samples were analysed using the Cardiochek PA manufacturer’s instructions and standard procedure [Citation8,Citation45,Citation46]. Validations of the Cardiochek PA have demonstrated that the system provides accuracy within 10% of serum reference values [Citation45]. Fasting glucose, total cholesterol, and HDL cholesterol results from the CardioChek PA were reported and recorded in mmol/L.
For the January 2019 data collection, we had the opportunity to collect and analyse venous whole blood samples to measure fasting glucose, total cholesterol, HDL cholesterol, low-density lipoprotein cholesterol, and triglyceride levels. As such, there were fewer overall participants with measures of LDL cholesterol and triglyceride levels. Blood samples were collected in 6 mL EDTA tubes (BD Vacutainer), plasma separated by centrifuging the samples at 1700 g for 10 minutes (+4C°), aliquoted to 1.5 mL Eppendorf tubes and frozen at −20 C and stored in a − 70° freezer until analysed at a clinical lab (NordLab, Oulu, Finland). One female and two male participants declined having their blood drawn.
We used paired t-tests to compare January 2019 measurements conducted with the CardioChek PA to the whole blood sample analysis. We found a significant difference (reported in results) for total cholesterol and HDL cholesterol levels with the CardioChek underestimating total cholesterol levels by 18.33% and overestimating HDL cholesterol by 10.9%, as such we used these percentages as correction factors to apply to all of the CardioChek total and HDL cholesterol values. We used these corrected values for the analysis.
Statistical analysis
Data were normally distributed (p > 0.06 in all cases) and are presented as min-max ranges in the text and as means ± the standard deviation in tables. We used one-way ANOVA with a Bonferroni correction for repeat participants across the two measurement periods to compare anthropometric and biomarker values between the two data collection periods. Power analysis was performed using G* Power 3.1 open-source software. A sample size of 20 subjects provides over 78% power to detect significant differences (α = 0.05, effect size = 0.65). There were no significant differences found in any of the measures between the two data collection periods (reported in results), and as such, the data from both periods were pooled to conduct multiple linear regression analyses to determine the effect BMI, age, sex, and body fat percentage on cholesterol (N = 25), fasting glucose (N = 25), and HDL cholesterol (N = 25). Measures from repeat participants were averaged and treated as a single individual for regression analysis. We performed the same multiple regression analysis of LDL (N = 18) and triglyceride level (N = 18) data from January 2019. We also performed simple linear regressions to determine the effect of just BMI alone and just body fat percentage alone on total cholesterol, fasting glucose, HDL cholesterol, LDL cholesterol, and triglyceride levels. We conducted all the analyses using SPSS version 26 (IBM, Armonk, NY), and the results were considered significant at the p = 0.05 level.
Results
Participant anthropometrics
Participant anthropometrics for the October and January data collections can be found in . There was no significant difference between the two measurement periods (fall N = 20, winter N = 21) for age (p = 0.41), weight (p = 0.78), height (p = 0.68), BMI (p = 0.89), body fat percentage (p = 0.63), or fat-free mass (p = 0.65). For the pooled sample of N = 25, age ranged from 20 to 64 years old, weight ranged from 46.7 to 129.6 kg, height ranged from 154.8 to 195.0 cm, BMI ranged from 19.5 to 34.2 kg/m2, body fat percentage ranged from 17.7% to 40.6%, and fat-free mass ranged from 34.2 to 91.3 kg. When comparing the sexes, there was no significant differencefor BMI (p = 0.155). Females had a significantly higher body fat percentage than males (F(1,40) = 35.109, p < 0.001). Males were significantly heavier (F(1,40) = 21.004, p < 0.001), taller (F(1,40) = 72.759, p < 0.001), had more fat-free mass (F(1,40) = 56.080, p < 0.001), and were significantly older than females (F(1,40) = 11.705, p = 0.001).
Table 1. Summary of the anthropometrics for the herders in the October 2018 and January 2019 data collection periods. The age and sex categories have been removed to protect participant confidentiality
In terms of BMI classification, 29.3% of participants fell within the “normal” BMI range, 48.8% within the “overweight” range, and 21.9% fall within the “obese” range. This results in 70.7% of participants be classified as either “overweight” or “obese”. Standard body fatness range norms differ by sex – males with <25% body fat are considered normal and ≥25% body fat are considered “overfat”, while females with <35% body fat are considered normal and ≥35% body fat are considered “overfat” [Citation15]. Just over 70% of females and 60% of males would be classified as “overfat” with the rest considered having a “normal” body fat percentage.
Biomarkers
Normal biomarker reference values for Finland are 4.0–6.0 mmol/L for fasting blood glucose, <5.0 mmol/L for total cholesterol, >1.2 mmol/L for HDL cholesterol for women and >1.0 mmol/L for men, <3.0 mmol/L for LDL cholesterol, and <1.7 mmol/L for triglycerides [Citation47]. Participant biomarkers for the October and January data collections can be found in . Paired t-tests between the CardioChek PA values and whole blood values revealed that the CardioChek PA produced significantly lower values (by 18.33%) for total cholesterol and significantly higher (by 10.9%) HDL values (p < 0.002 in both). There was no significant difference between the two measurement periods for corrected total cholesterol values (p = 0.38), fasting glucose (p = 0.38), and corrected HDL cholesterol (p = 0.47). Corrected total cholesterol ranged from 3.06 to 9.56 mmol/L, fasting glucose ranged from 1.1 to 6.80 mmol/L, corrected HDL cholesterol ranged from 0.83 to 2.31 mmol/L, LDL cholesterol ranged from 1.4 to 4.80 mmol/L, and triglycerides ranged from 0.48 to 2.95 mmol/L (). There were no significant differences between the sexes for corrected total cholesterol (p = 0.21), fasting glucose (p = 0.67), corrected HDL cholesterol (p = 0.93), and triglycerides (p = 0.82). However, females had significantly lower LDL cholesterol levels than males (p = 0.025). Prevalence of overweight, obesity, and cardiometabolic biomarkers outside of the recommended range can be found in .
Table 2. Summary of the cardiometabolic biomarker measures for the herders from the October 2018 and January 2019 data collections. The age and sex categories have been removed to protect participant confidentiality
Table 3. Prevalence of overweight, obesity, and cardiometabolic biomarkers outside of the recommended range for the pooled sample
Figure 1. These are the pooled values for glucose (N = 25), corrected total cholesterol (N = 25), corrected HDL-cholesterol (N = 25), LDL-cholesterol (N = 18), and triglycerides (N = 18). The red box and lines indicate the normal, healthy values for each measure. For HDL cholesterol, only the normal value for females is presented (>1.2 nnmol/L). The health value for males in Finland is >1.0 nnmol/L.
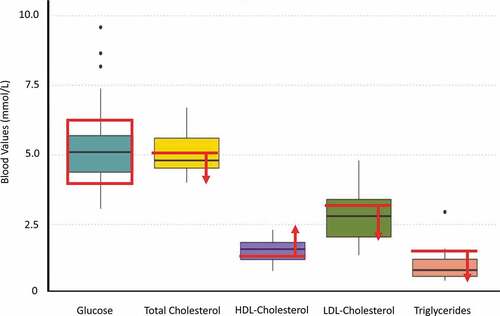
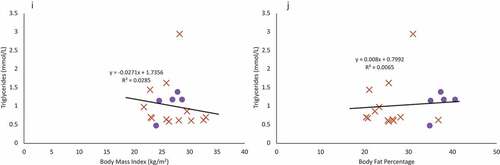
Figure 2. Females are indicated in purple circles and males in organe X’s. a & b: Regression of the pooled corrected total cholesterol levels (N = 25)against body mass index (A) and body fat percentage (B). Neither BMI nor body fat percentage were a significant predictor of corrected total cholesterol levels. c & d: Regression of the pooled glucose levels (N = 25) against body mass index (C) and body fat percentage (D). Neither BMI nor body fat percentage were a significant predictor of glucose levels. e & f: Regression of the pooled corrected HDL cholesterol levels (N = 25) against body mass index (E) and body fat percentage (F). Neither BMI nor body fat percentage were a significant predictor of corrected HDL cholesterol levels. g & h: Regression of LDL cholesterol levels (N = 18) against body mass index (G) and body fat percentage (H). Neither BMI nor body fat percentage were a significant predictor of LDL cholesterol levels, though sex was a significant predictor. i & j: Regression of the triglyceride levels (N = 18) against body mass index (I) and body fat percentage (J). Neither BMI nor body fat percentage were a significant predictor of triglyceride levels.
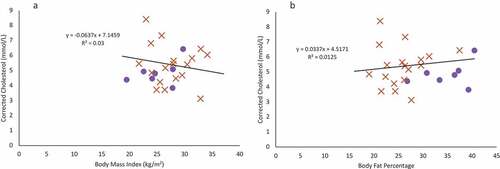
Figure 2. Continued.
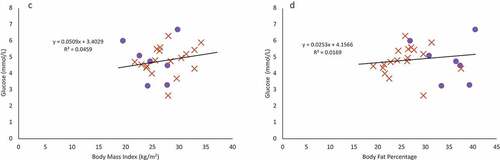
Figure 2. Continued.
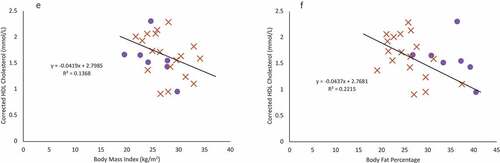
Figure 2. Continued.
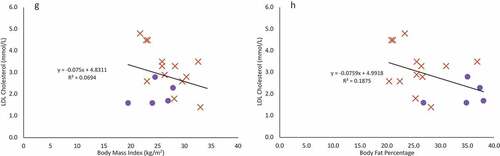
Figure 2. Continued.
The relationship between biomarkers to BMI and body fat percentage
For multiple regression models, age, sex, BMI, fat-free mass, and body fat percentage were not significant predictors of corrected total cholesterol levels, fasting glucose, corrected HDL cholesterol, and triglycerides (). There was a significant regression model for LDL cholesterol with sex being a significant predictor. BMI, age, fat-free mass, and body fat percentage were not significant predictors and were removed from the model (final model statistics: F(5,24) = 6.107, p = 0.025, adj. r2 = 0.231). However, given how few females participated in this study, this is likely an artefact of a small sample size.
Table 4. Results of the multiple regression models for the relationship between BMI, body adiposity, and the cardiometabolic biomarkers of corrected total cholesterol, glucose, corrected HDL cholesterol, LDL cholesterol, and triglycerides
Using a simple, single predictor linear regression, BMI and body fat percentage were not significant predictors for corrected total cholesterol (), fasting glucose (), corrected HDL cholesterol (), LDL cholesterol (), or triglyceride levels () (p > 0.07 in all cases).
Discussion
In this study, we measured BMI, body composition, and cardiometabolic biomarkers among a small sample of reindeer herders from sub-Arctic Finland between October 2018 and January 2019. We found BMI classified over 70% of this sample to be “overweight” or “obese” and 64% classified as “overfat”. We found a high level of total cholesterol but relatively normal values for other cardiometabolic biomarkers. However, there was no significant relationship between BMI and body fat percentage with any of the measured biomarkers, as would be predicted with high rates of overweight and obesity. The results here mirror the mosaic of results seen among other circumpolar populations. Here, we will focus on three reasons for this potential disconnect: BMI as a poor indicator of health, the role of physical activity in mitigating metabolic health risk factors, and cold climate adaptations.
BMI as a poor indicator of fat and cardiometabolic health
One of the biggest weaknesses of BMI is the inability of this metric to distinguish fat mass from fat-free mass. For example, in a study conducted among athletes and non-athletes, investigators found that BMI alone was able to distinguish between these two groups only 52% of the time [Citation10]. Measures of subcutaneous fat were far more accurate (81%) at distinguishing the more muscular athletes from less muscular non-athletes. An assessment of ~1.3 million patients who were part of the Patient Outcomes Research to Advance Learning consortium found that while being overweight and having obesity did increase cardiometabolic risk factors (blood pressure, triglyceride levels, LDL levels, and fasting glucose levels), there was a great deal of variation [Citation48] – such variation was observed in the present study as well. Furthermore, it has been demonstrated that BMI does not accurately predict cardiometabolic health equally across all populations. BMI has been shown to inaccurately assess adiposity and indicators of cardiometabolic health among Black women [Citation12,Citation49,Citation50] as well as among Asian and Indigenous North American populations [Citation13,Citation51]. This, too, may be the case among the herders, who despite high degrees of overweight and obesity, have relatively normal cardiometabolic biomarker levels [Citation52,Citation53].
Age could also be an important factor in interpreting the result of the present study. Although there was a large age range (20–64 years) among participants in this study, it is possible with a small sample size that we were unable to detect the impact of age on the emergence of a poor cardiometabolic profile. This could explain why no females were categorised as obese in this sample, as could the higher resting metabolic rate documented among females in this sample previously [Citation38]. However, female representation in this study is poor, and a greater number of female participants would provide a better indicator if there are true sex differences in the prevalence of obesity. It is possible that individuals in this study have not encountered the ill effects of overweight and obesity but will in the years to come. However, numerous studies have shown that negative health impacts associated with a high BMI, though exacerbated by age, do appear at younger ages [Citation48,Citation54–56]. Along with ethnic background, age, sex, and body fat distribution, physical activity fitness levels may also explain the inability of BMI to accurately and consistently predict present and future health status [Citation52,Citation53].
The mitigating role of fitness & physical activity
Physical activity and/or intentional exercise are known to have numerous health benefits such as improved cardiovascular health, reduced risk of certain cancers, and reduced inflammation [see review by Citation57]. As such, physical activity and high cardiorespiratory fitness may mitigate the potentially negative health impacts typically associated with being overweight or obese. A number of studies have addressed this concern and have found that risks associated with a high BMI are greatly reduced by high levels of physical activity. Data from over 4,600 adults ages 20–49 who took part in the National Health and Nutrition Examination Survey revealed that roughly 17.4% of the adults classified as “overweight” and 8.9% of adults classified as “obese” had a high degree of cardiovascular fitness [Citation58]. Other work has looked specifically at physical activity levels and health outcomes. Among over 47,200 Finnish women and men [Citation59] and almost 40,000 women, part of the Women’s Health Study [Citation60], regular physical activity was strongly associated with reduced all-cause mortality or coronary heart disease in these studies, respectively.
Though it would require further study, high physical activity levels among the reindeer herders may be in part responsible for the lack of association between BMI and body adiposity with cardiometabolic biomarkers. Total energy expenditure (kcal day−1) and physical activity levels were measured among the herders during the 2018 autumn herd round up, which occurred during the 1–2 weeks just after the biomarker data were collected (Ocobock et al.). During the round up, herders expended a mean of 4183 kcal day−1 (as measured by the doubly labelled water method) with females expending a mean of 3371 kcal day−1 and males 4530 kcal day−1.
This is one of the most physically demanding periods of the herding year and may not be representative of energy expenditure across seasons. However, it is possible this high level of physical activity could be mitigating some of the potential negative health benefits associated with the high BMI and degree of adiposity exhibited among the reindeer herders in this study as has been seen elsewhere [Citation59–61].
Work among Yakutia men found that those who took part in more traditional subsistence activities resulting in greater physical activity levels had higher total cholesterol driven by higher HDL levels [Citation8,Citation62], which was also true in the present study. Yakutia females displayed a less favourable cardiometabolic profile, which has been attributed to taking part in fewer physically demanding subsistence practices, further suggesting that factors other than BMI and adiposity can impact cardiometabolic biomarkers. Further, physical activity alone appears to have a relatively rapid dose-dependent effect on cardiometabolic biomarkers [Citation63–65], such that the high physical activity levels associated with herding may have altered their cardiometabolic profile.
Total energy expenditure and cardiometabolic biomarker measurements across seasons and years would elucidate whether the herders in this study truly exhibit a unique cardiometabolic profile – one altered by their high levels of physical activity. However, physical activity levels may not be the only factor driving this observed disconnect between BMI, body adiposity, and indicators of cardiometabolic health as the herders also inhabit a harsh, cold climate.
Cardiometabolic profiles in cold climates
Sub-Arctic Finland can be described as a cold, snowy environment. The mean annual temperature ranges from 0.1°C to 1.6°C and snow that reaches a depth of 72 cm [Citation66], though the temperature has significantly risen and the weather has become more unpredictable in the last 50–100 years due to climate change [Citation67,Citation68]. Numerous well-known cold climate adaptations that appear in circumpolar populations include high resting metabolic rates [Citation27,Citation38,Citation69–72], shivering thermogenesis and brown adipose activity [Citation39,Citation73,Citation74], oscillating vasoconstriction and vasodilation [Citation75,Citation76], as well as numerous cultural mitigation strategies [Citation37].
There is evidence that seasonality shifts resting metabolism substrate utilisation such that more carbohydrates are utilised in the winter as opposed to summer, which can alter lipid and glucose profiles [Citation8,Citation31]. Brown adipose tissue (BAT), a type of mitochondria dense fat, has received a great deal of recent attention both for its ability to increase heat production during cold exposure and for how it may alter metabolic rate and circulating blood glucose and lipid levels [Citation73,Citation74,Citation77–80]. BAT has been identified among cold climate [Citation39,Citation73,Citation81] and temperate climate populations [Citation74,Citation82,Citation83] during acute cold exposure, and has been shown to increase metabolic rate from 3% to 9.5% depending on the population. The reindeer herders in this study trended on the higher end of that metabolic rate increase [Citation39]. Furthermore, BAT activity seems to significantly alter blood glucose and lipid levels. In a small study conducted among seven men, acute cold exposure elicited a 63% increase in lipid utilisation and a 588% increase in glucose utilisation [Citation84]. Among the Yakutia, glucose levels, but not lipid levels, were positively correlated with BAT activity [Citation73]; a similar preference for glucose utilisation was also found among a population of women and men in Albany, NY [Citation83], and among the reindeer herders included in this study lipids were utilized [Citation39]. As the measures for this study took place in fall when temperatures were beginning to drop and in Winter when temperatures are consistently cold, it was likely that seasonal BAT activity influenced reindeer herder cardiometabolic profiles.
However, despite the potential for a disconnect between BMI, body adiposity, and cardiometabolic health indices among the herders as documented among other circumpolar populations, recent drastic changes in diet and physical activity levels could be altering this pattern [Citation22,Citation73,Citation85,Citation86]. Though older work among circumpolar populations revealed relatively low mortality from cardiovascular disease and incidence of diabetes as well as lower fasting blood glucose and lipid levels, this pattern is changing [Citation16,Citation21,Citation22,Citation85,Citation87–88Citation89]. Finland has high rates of cardiovascular disease [Citation33–35], and more broadly cardiovascular disease is a leading cause of death among circumpolar populations [Citation25,Citation87]. A great deal more research measuring seasonal total energy expenditure, resting metabolic rates, BAT activity, diet composition, adherence to traditional subsistence practices, and associated cardiometabolic biomarker levels, as well as data on cardiovascular disease mortality and diabetes are needed.
Limitations
Although the results of this study demonstrate a unique cardiometabolic profile among reindeer herders of sub-Arctic Finland, there are a number of limitations. First, the sample size of this study is small with only 25 unique participants across the two data collection periods. Second, females are underrepresented, making up only ~25% of the participant pool, though this reflects the sex ratio among herders. Third, it would have been ideal to include blood pressure measurements, fitness assessments, a more detailed personal medical history, and a detailed family medical history, particularly as that history pertains to cardiometabolic disorders to more accurately evaluate individual and population health trends. Such measures should be included in any future study. Fourth, it is possible that the participant population is not old enough to display the negative effects of a high BMI or high adiposity. Fifth, biomarker analysis should be completed with whole blood samples as total and HDL cholesterol levels were significantly different between the CardioChek PA and whole-blood analysis. Finally, it would be informative to have seasonal participant observation and detailed physical activity data to assess the role of physical activity and more traditional subsistence practices on cardiometabolic biomarkers.
Conclusion
This study measured cardiometabolic biomarkers, body mass index, and body adiposity among a small sample of reindeer herders from sub-Artic Finland. Participants in this study exhibited high BMIs and high body adiposity. Biomarker results were mixed with a high level of total cholesterol, but fasting glucose, HDL cholesterol, LDL cholesterol, and triglyceride levels were largely within the healthy range. However, there was no relationship between BMI and body adiposity in cardiometabolic lipids and fasting glucose biomarkers. It is possible that highly active lifestyles and even cold climate adaptations such as brown adipose tissue activity can mitigate the negative health effects associated with high body adiposity. The results of this study add to a growing body of the literature, suggesting that BMI does not accurately assess health equally across different populations. Finally, this work highlights a potentially unique interaction among subsistence lifestyle, climate, and cardiometabolic health indices – an area ripe for future research.
Acknowledgments
We thank Executive Director Anne Ollila and Advisors Anna-Leena Jänkälä and Maaren Angeli from the Reindeer Herder’s Association in Finland who helped us recruit reindeer herding districts and herders for this study. We are grateful to the participants and participating districts for not only taking part in this study but also providing valuable input along the way. Thank you to the University at Albany for supporting the early efforts of this research. Thank you also to incredibly helpful conversations with Alexandra Niclou and Dr. Joe Alcock. Thank you to Adam Gordon for his support and guidance. This study also would not have happened without the aid of Pertti Leinonen who provided fantastic logistical support at the Arctic Centre. This study also would not have been possible without the early advice and input from Tim Frandy, Bob Jarvenpa, Hannu Heikkinen, Hannu Rintamäki, Terhi Vuojala-Magga, Ville Stenbäck, and Karl-Heinz Herzig.
Disclosure statement
No potential conflict of interest was reported by the author(s).
Data Availability Statement
The authors confirm that the data supporting the findings of this study are available within the article.
Additional information
Funding
References
- WHO. Obesity and overweight. World Heal Organ 2021.
- Sassi F. Obesity and the economics of prevention. Cheltenham, United Kingdom: Edward Elgar Publishing. Books. 2010.
- Withrow D, Alter DA. The economic burden of obesity worldwide: a systematic review of the direct costs of obesity. Obes Rev. 2011;12(2):131–14.
- Brown CD, Higgins M, Donato KA, et al. Body mass index and the prevalence of hypertension and dyslipidemia. Obes Res. 2000;8(9):605–619.
- Chaput J-P, Doucet É, Tremblay A. Obesity: a disease or a biological adaptation? An update. Obes Rev. 2012;13(8):681–691.
- Fontaine KR, Barofsky I. Obesity and health-related quality of life. Obes Rev. 2001;2(3):71–82.
- Guo F, Garvey WT. Cardiometabolic disease risk in metabolically healthy and unhealthy obesity: stability of metabolic health status in adults. Obesity. 2016;24(2):516–525.
- Levy SB, Leonard WR, Tarskaia LA, et al. Lifestyle mediates seasonal changes in metabolic health among the yakut (Sakha) of northeastern siberia. Am J Hum Biol. 2016;28(6):868–878.
- Frühbeck G, Busetto L, Dicker D, et al. The ABCD of obesity: an EASO position statement on a diagnostic term with clinical and scientific implications. Obes Facts. 2019;12(2):131–136.
- Kruschitz R, Wallner-Liebmann SJ, Hamlin MJ, et al. Detecting body fat–A weighty problem BMI versus subcutaneous fat patterns in athletes and non-athletes. Romanovsky AA (ed.). PLoS One. 2013;8(8):e72002.
- Wharton S, Lau DCW, Vallis M, et al. Obesity in adults: a clinical practice guideline. CMAJ. 2020;192(31):E875–91.
- Racette SB, Deusinger SS, Deusinger RH. Obesity: overview of prevalence, etiology, and treatment. Phys Ther Rehabil J. 2003;83:276–288.
- Ramachandran A, Snehalatha C. Rising burden of obesity in Asia. J Obes. 2010;2010:1–8.
- World Health Organization. The Asia-pacific perspective: redefining obesity and its treatment. Australia; 2000.
- WHO Expert Committee. Physical status: the use and interpretation of anthropometry. report of a WHO expert committee - PubMed. World Heal Organ Tech Rep Ser. 1995;854:1–452.
- Bang HO, Dyerberg J. Lipid metabolism and ischemic heart disease in greenland eskimos. In: Harold H. Draper. (eds)., Advances in nutritional research. US: Springer; 1980. p. 1–22.
- Bang HO, Dyerberg J, Nielsen AB. Plasma lipid and lipoprotein pattern in Greenlandic West-coast Eskimos. Lancet. 1971;297(7710):1143–1146.
- Kozlov A, Vershubsky G, Kozlova M. Stress under modernization in indigenous populations of Siberia. Int J Circumpolar Health. 2003;62(2):158–166.
- Snodgrass JJ, Leonard WR, Sorensen MV, et al. The influence of basal metabolic rate on blood pressure among indigenous Siberians. Am J Phys Anthropol. 2008;137(2):145–155.
- Young T. Obesity, central fat patterning, and their metabolic correlates among the Inuit of the central Canadian Arctic. Hum Biol. 1996;68(2):245–263.
- Young TK, Moffatt MEK, O’Neil JD. Cardiovascular diseases in a Canadian Arctic population. Am J Public Health. 1993;83(6):881–887.
- Young TK, Nikitin YP, Shubnikov EV, et al. Plasma lipids in two indigenous Arctic populations with low risk for cardiovascular diseases. Am J Hum Biol. 1995;7(2):69–87.
- Himms-Hagen J. Lipid metabolism during cold-exposure and during cold-acclimation. Lipids. 1972;7(5):310–323.
- Shephard R, Rode A. The health consequences of “Modernisation”: evidence from circumpolar peoples. Cambridge: Cambridge University Press; 1996.
- Snodgrass JJ. Health of indigenous circumpolar populations. Annu Rev Anthropol. 2013;42(1):69–87.
- Snodgrass JJ, Sorensen MV, Tarskaia LA, et al. Adaptive dimensions of health research among indigenous Siberians. Am J Hum Biol. 2007;19(2):1–8.
- Leonard WR, Sorensen MV, Galloway VA, et al. Climatic influences on basal metabolic rates among circumpolar populations. Am J Hum Biol. 2002;14(5):609–620.
- Snodgrass J, Leonard W, Sorensen M, et al. The emergence of obesity among indigenous Siberians. J Phys Anthropol. 2006;25(1):75–84.
- Bjerregaard P, Jørgensen M. Diet, nutrition, and physical activity. In: Young T, Bjerregaard P, editors. Health transitions in arctic populations. Toronto: University of Toronto Press; 2008. p. 192–204.
- Cepon TJ, Snodgrass JJ, Leonard WR, et al. Circumpolar adaptation, social change, and the development of autoimmune thyroid disorders among the Yakut (Sakha) of Siberia. Am J Hum Biol. 2011;23(5):703–709.
- Leonard WR, Levy SB, Tarskaia LA, et al. Seasonal variation in basal metabolic rates among the yakut (Sakha) of Northeastern Siberia. Am J Hum Biol. 2014a;26(4):437–445.
- Prevalence of obesity among adults. World Heal Organ 2020.
- Salomaa V, Arstila M, Kaarsalo E, et al. Trends in the incidence of and mortality from coronary heart disease in Finland, 1983–1988. Am J Epidemiol. 1992;136(11):1303–1315.
- Statistics Finland. Mortality from diseases of the circulatory system decreased further in 2019. 2020.
- Tuomilehto J, Rastenyte D, Sivenius J, et al. Ten-Year Trends in Stroke Incidence and Mortality in the FINMONICA stroke study. Stroke. 1996;27(5):825–832.
- Ocobock C, Soppela P, Turunen M, et al. Reindeer herders from subarctic Finland exhibit high total energy expenditure and low energy intake during the autumn herd roundup. Am J Hum Biol 2021 e23676 10.1002/ajhb.23676
- Turunen M, Soppela P, Ocobock C. How reindeer herders cope with harsh winter conditions in northern Finland: insights from an interview study. Arctic. 2021;74(2):188–205.
- Ocobock C, Soppela P, Turunen MT, et al. Elevated resting metabolic rates among female, but not male, reindeer herders from sub-Arctic Finland. Am J Hum Biol. 2020a;32(6):e23432.
- Ocobock C, Soppela P, Turunen MT, et al. Evidence for brown adipose tissue activation among male and female reindeer herders from sub-Arctic Finland. Am Assoc Phys Anthropol. 2020b;171:205.
- Kohonen I, Kuula-Luumi A, Spoof S-K. The ethical principles of research with human participants and ethical review in the human sciences in Finland. Helsinki; 2019.
- RHA. Reindeer herders association statistics. 2021.
- FMI. Finnish Meteorological Institute. 2021.
- Lohman, TG, and Roche, AF, Martorell, R (Eds.) Anthropometric standardization reference manual. Champaign, IL: Human Kinetics Books; 1988.
- Sun SS, Chumlea WC, Heymsfield SB, et al. Development of bioelectrical impedance analysis prediction equations for body composition with the use of a multicomponent model for use in epidemiologic surveys. Am J Clin Nutr. 2003;77(2):331–340.
- Donato LJ, Deobald GR, Wockenfus AM, et al. Comparison of two point of care devices for capillary lipid screening in fasting and postprandial adults. Clin Biochem. 2015;48(3):174–176.
- Raichlen DA, Pontzer H, Harris JA, et al. Physical activity patterns and biomarkers of cardiovascular disease risk in hunter-gatherers. Am J Hum Biol. 2016;29(2):1–13.
- Rustad P, Simonsson P, Felding P, et al. Nordic Reference Interval Project Bio-bank and Database (NOBIDA): a source for future estimation and retrospective evaluation of reference intervals. Scand J Clin Lab Invest. 2004;64(4):431–438.
- Nichols G, Horberg M, Koebnick C, et al. Cardiometabolic risk factors among 1.3 million adults with overweight or obesity, but not diabetes, in 10 geographically diverse regions of the USA, 2012-2013. Prev Chronic Dis. 2017;14:E22.
- Gallagher D, Visser M, Sepulveda D, et al. How useful is body mass index for comparison of body fatness across age, sex, and ethnic groups? Am J Epidemiol. 1996;143(3):228–239.
- Rahman M, Berenson AB. Accuracy of current body mass index obesity classification for white, black, and Hispanic reproductive-age women. Obstet Gynecol. 2010;115(5):982–988.
- Slattery ML, Ferucci ED, Murtaugh MA, et al. Associations among body mass index, waist circumference, and health indicators in American Indian and Alaska native adults. American Journal of Health Promotion. 2010;24(4):246–254.
- Flegal KM, Kit BK, Orpana H, et al. Association of all-cause mortality with overweight and obesity using standard body mass index categories a systematic review and meta-analysis. J Am Med Assoc. 2013;309(1):71–82.
- Heymsfield SB, Cefalu WT. Does body mass index adequately convey a patient’s mortality risk? J Am Med Assoc. 2013;309(1):516–525.
- Jiang X, Srinivasan SR, Webber LS, et al. Association of fasting insulin level with serum lipid and lipoprotein levels in children, adolescents, and young adults: the Bogalusa heart study. Arch Intern Med. 1995;155(2):190–196.
- Singh GM, Danaei G, Pelizzari PM, et al. The age associations of blood pressure, cholesterol, and glucose: analysis of health examination surveys from international populations. Circulation. 2012;125(18):2204–2211.
- Stoner L, Pontzer H, Barone Gibbs B, et al. Fitness and fatness are both associated with cardiometabolic risk in preadolescents. J Pediatr. 2020;217:39–45.e1.
- Mikkelsen K, Stojanovska L, Polenakovic M, et al. Exercise and mental health. Maturitas. 2017;106:48–56.
- Duncan GE. The “fit but fat” concept revisited: population-based estimates using NHANES. Int J Behav Nutr Phys Act. 2010;7(1):1–5.
- Hu G, Tuomilehto J, Silventoinen K, et al. The effects of physical activity and body mass index on cardiovascular, cancer and all-cause mortality among 47 212 middle-aged Finnish men and women. Int J Obes. 2005;29(8):894–902.
- Weinstein AR, Sesso HD, Lee IM, et al. The joint effects of physical activity and body mass index on coronary heart disease risk in women. Arch Intern Med. 2008;168(8):884–890.
- Ortega F, Lee D, Katzmarzyk P, et al. The intriguing metabolically healthy but obese phenotype: cardiovascular prognosis and role of fitness. Eur Heart J. 2013;34(5):389–397.
- Leonard WR, Levy SB, Tarskaia LA, et al. Seasonal variation in basal metabolic rates among the yakut (Sakha) of Northeastern Siberia. Am J Hum Biol. 2014b;26(4):158–166.
- Durstine JL, Grandjean PW, Davis PG, et al. Blood lipid and lipoprotein adaptations to exercise: a quantitative analysis. Sport Med. 2001;31(15):1509–1517.
- Leon A, Rice T, Mandel S, et al. Blood lipid response to 20 weeks of supervised exercise in a large biracial population: the HERITAGE family study. Metabolism. 2000;49(4):513–520.
- Trejo-Gutierrez J, Fletcher G. Impact of exercise on blood lipids and lipoproteins. J Clin Lipidol. 2007;1(3):175–181.
- Pirinen P, Simola H, Aalto J, et al. Climatological statistics of Finland 1981–2010. Finnish Meteorol Inst Reports. 2012;1:1–96.
- Markkula I, Turunen M, Rasmus S. A review of climate change impacts on the ecosystem services in the Saami Homeland in Finland PALOMA View project Gradual changes and abrupt crises-changing operational environment of Finnish reindeer View project A review of climate change impacts on the. Sci Total Environ. 2019;692:1–16.
- Ruosteenoja K, Jylhä K, Kämäräinen M. Climate projections for Finland under the RCP forcing scenarios. Geophysica. 2016;51:17–50.
- Froehle AW. Climate variables as predictors of basal metabolic rate: new equations. Am J Hum Biol. 2008;20(5):510–529.
- Galloway V, Leonard WR, Ivakine E. Basal metabolic adaptation of the Evenki reindeer herders of Central Siberia. Am J Hum Biol. 2000;12(1):75–87.
- Rode A, Shephard RJ. Basal metabolic rate of inuit. Am J Hum Biol. 1995;7(6):723–729.
- Snodgrass JJ, Leonard WR, Tarskaia LA, et al. Basal metabolic rate in the Yakut (Sakha) of Siberia. Am J Hum Biol. 2005;17(2):155–172.
- Levy SB, Klimova TM, Zakharova RN, et al. Brown adipose tissue, energy expenditure, and biomarkers of cardio-metabolic health among the Yakut (Sakha) of northeastern Siberia. Am J Hum Biol. 2018;30(6):e23175.
- van Marken Lichtenbelt WD, Vanhommerig JW, Smulders NM, et al. Cold-activated brown adipose tissue in healthy men. N Engl J Med. 2009;360(15):1500–1508.
- Steegmann AT. Human cold adaptation: an unfinished agenda. Am J Hum Biol. 2007;19(2):218–227.
- Stocks J, Taylor N, Tipton J, et al. Human Physiological responses to cold exposure. Aviat Sp Environ Med. 2004;75:444–457.
- Cannon B, Nedergaard J. Yes, even human brown fat is on fire! J Clin Invest. 2012;122(2):486–489.
- Cypess AM, Lehman S, Williams G, et al. Identification and importance of brown adipose tissue in adult humans. N Engl J Med. 2009;360(15):1509–1517.
- Leonard WR, Levy SB. Contributions of brown adipose tissue to human metabolic adaptation: comparative and evolutionary perspectives - Google Scholar. Am J Phys Anthropol. 2015;156:202.
- Ouellet V, Labbé SM, Blondin DP, et al. Brown adipose tissue oxidative metabolism contributes to energy expenditure during acute cold exposure in humans. J Clin Invest. 2012;122(2):545–552.
- Virtanen KA, Lidell ME, Orava J, et al. Functional brown adipose tissue in healthy adults. N Engl J Med. 2009;360(15):1518–1525.
- van der Lans AAJJ, Vosselman MJ, Hanssen MJW, et al. Supraclavicular skin temperature and BAT activity in lean healthy adults. J Physiol Sci. 2016;66(1):77–83.
- Niclou A, Ocobock C. Weather permitting: increased seasonal efficiency of non-shivering thermogenesis through brown adipose tissue activation in the winter. Am J Hum Biol. (2021): e23716. In Press.
- Vallerand AL, Jacobs I. Rates of energy substrates utilization during human cold exposure. Eur J Appl Physiol Occup Physiol. 1989;58(8):873–878.
- Kozlov A, Vershubsky G, Kozlova M. Indigenous peoples of Northern Russia: anthropology and health. Int J Circumpolar Health. 2007;66(sup1):1.
- Sorensen MV, Snodgrass JJ, Leonard WR, et al. Lifestyle incongruity, stress and immune function in indigenous Siberians: the health impacts of rapid social and economic change. Am J Phys Anthropol. 1996;138(1):62–69.
- Château-Degat M-L, Dewailly E, Charbonneau G, et al. Obesity risks: towards an emerging Inuit pattern. Int J Circumpolar Health. 2011;70(2):166–177.
- Harvald B. Third international symposium on circumpolar health. Ugeskr Laeger. 1974;136(44):75–87.
- Rode A, Shephard R, Vloshinsky P, et al. Plasma fatty acid profiles of Canadian Inuit and Siberian Ganasan. Arctic Med Res. 1995;54(1):10–20.