
ABSTRACT
Global efforts are still under way to ensure sustainable development goal 6 of providing enough clean water to sustain public health in many regions, and especially in the Arctic where the remoteness of communities and the harsh climate make water provision especially challenging. This study aimed to examine the sufficiency, accessibility, and affordability of water supplies in rural Greenland. The state of the water supply was investigated using quantitative data on infrastructure and demographics. Qualitative data on water-related practices and perceptions were collected through fieldwork and interviews in a selection of settlements. Generally, the supply of drinking water was found to be sufficient and affordable for most. However, access was severely constrained by the lack of piping to rural homes (20% were piped). The daily water consumption of residents from un-piped households was between 13 and 23 L/d/cap, i.e. within the basic access level according to WHO, which is in theory not sufficient to sustain public health. Several health risks could be caused by the low daily consumption in un-piped homes, and water saving practices induced by it – i.e. the use of shared handwashing basins, and household water storage, which could lead to degradation of water quality at the point-of-use.
Introduction
Access to clean water is essential to sustaining human health and prosperity [Citation1] and therefore recognised as a human right by the United Nations [Citation2], who have dedicated the sixth Sustainable Development Goal [Citation3] to achieving universal access to sufficient quantities of water. They insist that water is “at the very core of sustainable development, critical to the survival of people and the planet” [Citation3]. The UN human right to water therefore requires that water be “sufficient, safe, acceptable, physically accessible, and affordable” [Citation4].
Globally, approximately 2 billion people are still lacking access to safe drinking water [Citation5]. The challenge of a safe water supply proves especially complex in the Arctic [Citation6], where keeping water flowing in sub-freezing temperatures requires costly logistics, and the small size and remoteness of most communities make for a high cost per capita of any system implemented [Citation7].
Additionally, the cost incurred due to old and degrading infrastructure is adding to the challenge in various parts of the Arctic [Citation6,Citation8]. Notably, in Yakutia, Russia, an estimated 75% of centralised water supplies are in need of replacement [Citation9]. Cost logically affects the amount of water used, and instances have been observed in Alaska of users choosing to disconnect from the water supply because of high water fees [Citation6,Citation10]. As a result, water consumption is typically low in many parts of the rural Arctic [Citation6], with for instance residents of Coral Harbour, Canada, using only a third of the water used by average Canadians [Citation8,Citation11].
The local and regional service inadequacies in the Arctic region are, however, often lost in the official inventories, due to the small size of the Arctic populations compared to the total nations´ populations at large [Citation12]. UN statistics, for instance, indicate that 100% of homes are served in the Kingdom of Denmark, which encompasses Greenland [Citation13], while sources specifically describing the Greenlandic situation suggest severe inadequacies in the services for rural Greenland [Citation14,Citation15]. In fact, based on an online survey, the water supply service in Greenland was reported to be among the least developed in the circumpolar Arctic [Citation14].
The supply of drinking water in Greenland is managed by the national company Nukissiorfiit [Citation15], which is in charge of water and energy supply for all localities – i.e. 52 settlements and 17 towns – excluding some seafood plants, three large airports and their adjacent settlement, and sheep farms. Water may be piped to the homes, delivered by trucks to a domestic water tank or made available for collection at public taphouses. Remoteness is a limiting factor in infrastructure development, in part due to the absence of roads between communities, that are all located on islands and along the coast – as an ice sheet covers most of the country’s surface. As a result, all supplies have to be operated in an insular fashion [Citation15], which potentially leads to inequalities across the country. At this time, however, detailed knowledge of the water supply situation in Greenland settlements remains to be documented.
Aside from the state of the public water supply itself, it is well documented that indigenous knowledge systems also affect the choice of water sources [Citation8,Citation16–20]. Previous studies on water use in the Arctic have documented the preference, by some users, to go collect water from alternative sources in their natural surroundings [Citation21–23]. Furthermore, Alessa et al. [Citation24] has noted the importance of the local knowledge associated with this practice in maintaining community resilience on the long term.
This study constitutes the first part of a research project evaluating the current situation in Greenlandic settlements regarding the UN human right to water. WHO classifies water access levels with respect to a number of criteria, such as distance to point of use, collection time, needs covered, and quantities available. Distance is described as optimal when water is available on the premises, intermediate under 100 metres, basic below 1000 m, and inadequate over 1000 m. Regarding quantities, the levels of access are described: inadequate below 5.3 L/d/cap, basic up to 20 L/d/cap, and intermediate around 50 L/d/cap. Optimal access refers to an average use exceeding 100 L/d/cap [Citation1]. The aim of this paper is to elucidate access in terms of distance to point-of-use (including proportion of piped homes and distance to outdoor public taps), domestic consumption (in L/d/cap) and cost to the residents. Acceptability is explored to the extent that it affects users´ choices influencing these aspects. Each criterion was explored on the basis of qualitative data, obtained from various institutional sources, and qualitative data, derived from field observations and interviews with local residents, conducted in the settlements.
Materials and methods
Coverage of the study
In the first phase, during a desk study, data was collected on all Greenlandic settlements – i.e. with a population of less than 500 people – in 2020. The exception to this was the eastern community of Ittoqqortoormiit, which despite having a population of 345 in 2020, used to have town status and therefore might have undergone a different development than settlements – the community was thus excluded from this study. The term “rural” thereafter refers to the population living in settlements, while “urban” refers to those living in the towns – with a population of 500 to a few thousand people. In a second, fieldwork phase, interviews were conducted in five settlements and one town, Nanortalik, which was included to provide insights into the extent of the practice of collecting alternative water from nature in localities with piped homes and presumably easier access to treated water. The term “region” refers here to the five Greenlandic municipalities, namely from North to South: Avannaata Kommunia, Kommune Qeqertalik, Qeqqata Kommunia, Kommuneqarfik Sermersooq (divided into West and East coast), and Kommune Kujalleq.
Data collection on infrastructure and water supply
This study focuses mainly on the accessibility, cost, and consumption of treated water from the public supply, thereafter referred to as “public” water. It also makes mention of water from untreated natural sources, such as river, lake or ice floats from icebergs (known as “nilak”), thereafter “alternative” water.
Data on water quantity from the public supply
The amount of water distributed through the public supply was measured by Nukissiorfiit water metres. Data on water consumption were then provided by Nukissiorfiit in the form of Excel sheets, showing monthly consumption for each building and taphouse during 2020. This included the amount of water distributed in each of the 52 settlements, as well as the overall national and urban totals. Two outliers appeared in the taphouse supply: Qassimiut showed a very high consumption of 260 L/d/cap, and Kitsissuarsuit showed no consumption at all, despite having five taphouses. Both have been confirmed to be unreliable data points in terms of water consumption by Nukissiorfit, and have therefore been disregarded during subsequent calculations of water quantity in this study.
The potential for expansion of water supplies was extracted from data provided in January 2022 by Nukissiorfiit, showing their estimates based on the needs of the seafood processing industry in the area.
Data treatment
The dataset showing the amount of water distributed through the public supply was divided into three categories. “Taphouses” includes the metres related to direct outdoor public water distribution installations (taphouses and water treatment plant) as identified in maps provided by Nukissiorfiit. “Public buildings” include the service house (i.e. a community building where one can shower and do laundry), schools, kindergartens, public offices, health stations, and community halls. The consumption in “Piped” households was mainly extracted using the customer codes estimated to include mostly housing units, after discussion with Nukissiorfiit – to which were added some homes found under the codes for Government and municipalities but assumed to be staff housing, as identified on the Nukissiorfiit maps and/or Google street view. Also included were the nursing homes, when piped. In rare cases, homes included in this category only had a few months of recorded water use in 2020.
Customer categories consistently excluded from the study were businesses, seafood plants, and the trading company “KNI” that supply goods to settlements along the coast. Rare instances of seafood plant facilities and technical buildings were also excluded when found under the municipality customer codes. Farm buildings were kept out of the data collection, even when inhabited, as they are not served by Nukissiorfiit.
For national and urban consumption, the total water amounts were provided by Nukissiorfiit, and extracted by excluding the customer categories: businesses, seafood plants and “KNI”.
Calculations
The total population and number of households for each settlement were obtained from StatBank Greenland, under “Population” [Citation25]. From those, the average household size was calculated for each settlement.
Maps of the settlements were provided by Nukissiorfiit, showing the b-number (building identifier) of each building/house/taphouse, and characteristics/purpose of public buildings (i.e. “school”, “church”, “service house”, etc.). Piped homes were identified thanks to the list of water metres (which shows the b-number associated with each metre), and by extension, all other homes were identified as un-piped. The percentage of piped homes was calculated by using, for all 52 settlements, the total number of households from StatBank Greenland and the number of piped homes derived from the Nukissiorfiit metres list (as described above). Based on this, the number of users in piped and un-piped homes was derived as follows. The number of users in piped homes was estimated as: number of piped houses × average household size in the settlement. The number of users in un-piped homes was estimated as: (number of households – number of piped homes) × average household size in settlement.
For water use per capita at national, total urban, and total rural levels, the calculations were based on the total amount of water (supplied through taphouses, piped homes, public buildings and truck haul), and the total population. The latitude of the settlements was determined in the decimal degree format with two decimals (DDD.DD°) from Google Maps. When a settlement spreads over several latitudes, the one chosen was determined at the location of the school building, as indicated on the Nukissiorfiit maps.
Distance to taphouse was estimated using the Nukissiorfiit maps. The maps were printed at a scale of 1:2000, on A3 format. The distance to taphouse was measured on paper from the closest point of each house to the closest point of the nearest taphouse – as the crow flies, but avoiding major water bodies where relevant. The choice to use straight lines as indicators of distance was made by default, since the optimal path is difficult to predict without being on site, due to uneven terrain, various types of soil (marshy, rocky, etc.), and very few structured network (roads) between buildings. Houses and nursing homes were included, while public buildings and suspected farms and summerhouses were excluded.
The number of people sharing a taphouse was calculated from the estimated number of inhabitants of un-piped homes (calculation explained above), and the number of taphouses in the settlement available in the Nukissiorfiit dataset and maps, as mentioned above.
Interviews on water perceptions and household practices
As a first phase, semi-structured interviews were conducted in one settlement (Sarfannguit, in the central region of Qeqqata), in August 2019 and March 2020, in a conversational way, including open-ended questions about the residents´ opinions, concerns, and possible questions regarding water supply. The concerns expressed, which included the state of piping, technologies used for water treatment, quality of alternative water sources and safety considerations related to household water storage, were incorporated into the design of the study, in order to answer questions of relevance to the communities visited. Some specific inputs were also incorporated into the results section of this paper.
Structured interviews focusing on the main concerns were then conducted in four selected settlements and a town – Qaarsut and Saattut in the northern region of Avannaata, Itilleq in the central region of Qeqqata and Tasiusaq and the town of Nanortalik in the southern region of Kujataa ().
Table 1. Characteristics of the study sites where interviews were conducted.
The visits to settlements were announced in Greenlandic to community members by posters on the local bulletin board, on Facebook or by emails. When possible (Qaarsut and Sarfannguit), people were first welcomed to a public meeting, and introduced in Greenlandic to the purpose of the research project. These meetings were held following the local practice known by non-Greenlandic speakers as “kaffemik” – a type of gathering where doors are open for all, food and warm drinks are served, and people can come in and out freely. This format being common in Greenland was deemed more culturally appropriate, and more comfortable for the residents. The participants were encouraged to express their views, concerns, and wishes regarding the aim and scope of the project.
Interviews about the respondents´ preferences, practices and perception of water were conducted mostly in the form of home visits (in Qaarsut, Itilleq, Tasiusaq, and Nanortalik), while a few were conducted on the phone (Saattut). In all, 21 respondents took part in the formal interviews (numbers shown in detail in ), including 13 women, seven men and one couple. Some respondents had volunteered during the kaffemik or on Facebook, while others agreed to talk to us on the spot during random home visits. All interviews were conducted in Greenlandic, by mediation of a translator, who had ties to the settlement in most cases (Sarfannguit, Qaarsut, Saattut, Nanortalik and Tasiusaq). The information power of this sample was deemed sufficient due to the narrow aim of the study, case-based approach, and focused dialogue facilitated by a translator [Citation26]. The survey questionnaires were adapted from a previous work by Wright et al. [Citation20] and translated into Greenlandic. The interview results were anonymised and are only reported at settlement level.
Statistical analysis
The quantitative assessment of water accessibility involved an investigation of the influence of the potential for expansion of water supplies, which had been estimated by Nukissiorfiit based on the needs of the seafood processing industry, as a potential determinant of the level of piping in the settlements. This investigation involved a two-step modelling process to account for the zero-inflated continuous nature of the response variable. First, the level of piping was modelled as a binary process (i.e. piping or no piping) using logistic regression. Second, the level of piping in settlements with piping was modelled using a GLM following a gamma distribution with a log link. This approach makes it possible to determine whether the potential for expansion is a potential driver in the presence or absence of piping and, in the settlements with piping, whether the potential for expansion is driving the level of piping.
The quantitative assessment of water sufficiency involved an investigation of water consumption from public taps (L/d/capita). Here, an analysis was conducted to determine the potential drivers of water consumption from taphouses, at settlement level. The factors investigated were geographical (latitude and steepness of terrain), infrastructural (level of piping in the settlement and average distance to taphouse) and demographic variables (saturation of service point and household size).
More specifically, the water consumption from public taps (L/d/capita) was modelled using a generalised linear model following a Gamma distribution with a log link to determine the effect of average distance to taphouse, settlement steepness (i.e. elevation of highest house), household size, service point saturation (i.e. capita per taphouse), percentage of piped homes, and latitude (model 1).
A priori data exploration was conducted on 47 settlements to determine potential outliers and issues related to collinearity [Citation27]. In addition, regression assumptions were verified by plotting residuals against fitted values and each covariate in the model [Citation28]. A stepwise model selection approach was used to determine the optimal covariate combination. Cook's distance was investigated to determine potential influential observations. The statistical analysis was conducted in R version 4.0.4 [Citation29].
Model 1: Full Gamma model used to investigate water consumption from taps in settlements
Water consumptioni ~ Gamma (µi)
E(Water consumptioni) = µi
Log(µi) = distance to taphousei + settlement steepnessi + % of piped homesi + latitudei + household sizei + service point saturationi
Post hoc inspection of Cook’s distance revealed a single influential observation, namely, Upernavik Kujalleq, which shows unusually high consumption from taphouses, but none from public buildings. It is possible that the water consumption from these buildings was mistakenly included in the taphouse data, for instance the school, which lies next to one taphouse, the health station next to the other one or the industry building next to the water plant. Either way, this outlier was removed from the analysis, resulting in a final number of 46 settlements included in this analysis.
Similarly, post hoc data exploration revealed collinearity issues related to household size and service point saturation (i.e. variance inflation factors > 2). This is due to both values being calculated based on the settlement population, therefore household size was chosen to represent these combined effects, which implies that service point saturation was excluded from the model.
Results
The results are presented following three service criteria from the UN Human Rights-based approach to water access for personal and domestic use that were studied here: physically accessible, sufficient and affordable.
Physical accessibility of water
Quantitative assessment of water accessibility
The settlements´ population represents 11% of the population of the country, with 6 302 (out of 56 081) people living in 2 213 rural households. A summary of regional piping levels is shown in (more detailed data is given in S1 and S2), together with the repartition of the rural population, and logistical characteristics in each region – distance to taphouse, steepness of terrain, and saturation of public taps.
Table 2. Proportion of the rural population living in each region, and regional values (based on calculations at settlement level) for percentage of piped and un-piped homes, average distance to taphouse, steepness, and saturation of public taps.
Overall, in the country, only 20% of rural households were piped, with an average of 16±24% across all settlements. For the total rural population, this means 441 households were piped and 1 772 un-piped. Water supply was absent from three of the 52 settlements, all of which are located in the northernmost region of Avannaata. It should be noted that one of these settlements (Qeqertat) is scheduled to receive a water supply in 2022. On the opposite side of the spectrum, the highest amount of piping of all settlements was found in Qeqertarsuatsiaat, which is located on the west coast in the region of Sermersooq (home to the capital city). In one settlement only, Alluitsup Paa in the southern municipality of Kujalleq, truck-haul water delivery was also available in addition to taphouses, and served a dozen households in 2020. The use of truck-haul service and amounts of water delivered by truck may be higher in other years, as the available data for 2020 showed truck deliveries only occurred during some months that year.
The level of in-home piping was found to vary greatly between settlements and regions. Regionally, the proportion of piped homes ranged from 1% to 65%, leaving between 35% and 99% of the population without a water source on their premises. The least serviced region was Avannaata, the northernmost municipality, which also had the highest proportion of the rural population (46%); while the region with the highest service level was Sermersooq West, which encompasses only 5% of the total rural population.
Overall, in Greenland, taphouses were located on average 89±45 m from the individual homes. At the settlement level, the average distance to taphouse ranged from 29±22 m for Kangaamiut (central region of Qeqqata) to 250±112 m for Savissivik (northern region of Avannaata), respectively. This was often across uneven terrain, as the steepness of settlements ranged from 10 to 70 m, with an average of 33±14 m and no notable differences between regions. Saturation of the point-of-use, i.e. the number of people sharing a taphouse, ranged more widely, from 14±6 people per tap on the West coast of the Sermersooq region, to 76±67 people per tap on the East coast of the same region.
Qualitative assessment of accessibility
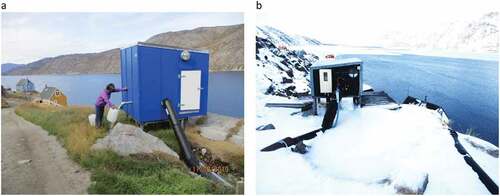
Based on the interviews, the physical constraints of collecting water from the taphouse () seemed to be of limited concern for most, with 12 of 17 respondents considering it “easy”, while the other five expressed some level of concern, mostly related to slippery terrain in the winter (3), to age (3), and to the steepness of the terrain (1). Indeed, a small ice sheet was observed covering the ground around the taphouses during the winter season, attesting to some wastage of water and posing a risk for the users who may slip on it when collecting water (illustrated in ).
Figure 1. (a) A woman collects water from a taphouse in Greenland, August 2019 – in this case from the pipe normally used by trucks, because the other tap was malfunctioning at the time. (b) A taphouse in Greenland, surrounded by an ice sheet just at the edge of a rather perilous drop, March 2020.
For respondents without a household water tank, the frequency of water collection varied from twice a day to twice a week. Of the five respondents who had a tank, two reported filling it with a hose connected to a taphouse (twice a month and twice a week, respectively), while another two went out daily to collect water with jugs to refill their tank. The last respondent, living in a town, could order truck-haul water delivery to refill his tank three times a week. About a quarter of respondents using a taphouse remarked that it would sometimes freeze shut during the winter.
When asked about possible improvements to the system, half of the respondents said they wished for more piping to the homes (10 of 21) – one even mentioned being “envious” of a nearby settlement that had many piped homes. In an informal interview, however, one person gave a very different answer, saying that piped water was not desirable unless a sewer was first put in place. This was because grey water was drained directly into the terrain outside each house and could be seen running over streets and recreational areas. Consequently, should homes become piped, the dramatic increase expected in water use would worsen the issue of open spillage of wastewater onto public areas. The sewer itself would have to be well enough designed to preserve the quality of the fishing grounds around the settlement, thus posing another barrier to the development of an acceptable water supply.
Two-thirds of the respondents who expressed an opinion (13 of 20) were aware that access to water is a human right, with one stating that “that’s how it should be, water is a necessity”.
Sufficiency of water
Quantitative assessment of water sufficiency
Based on the quantitative data retrieved, the overall level of water consumption in Greenland was found to be 29 L/d/cap on average in the settlements (, detailed data in S2), i.e. in the intermediate range as defined by WHO [Citation1]. This was compared to an average daily consumption of 104 L/d/cap in the country overall, and 114 L/d/cap in the towns, which are both in the WHO’s optimal range. In the settlements, a significant difference in consumption was revealed between piped and un-piped homes, with an average consumption of 55 L/d/cap in piped homes and 13 L/d/cap in un-piped homes.
Figure 2. Daily water consumption per capita, in L/d/cap, in overall Greenland, in the towns, and in the settlements (including truck hauled water in the one settlement, Alluitsup Paa). Daily water consumption in the Greenlandic settlements for: piped homes, non-piped homes, and shared public buildings (taking into account the total settlement population). The levels of access as defined by WHO are shown in lines: inadequate below 5.3 L/d/cap, basic up to 20 L/d/cap, intermediate around 50 L/d/cap, and optimal above 100 L/d/cap.
These values were obtained for the rural population overall, but daily water consumption was also found to vary strongly within the rural population and between settlements. At settlement level, daily water consumption of piped homes ranged from 18 to 144 L/d/cap, thus from basic to optimal access levels; while for inhabitants of non-piped homes (excluding the three settlements without a public water supply) daily water consumption ranged from 4 to 59 L/d/cap, i.e. from inadequate to intermediate access levels.
To household water use can be added the consumption from public buildings (), which include the school, kindergarten, administrative office, health station, community hall, and service house. The service house is a public facility where it is possible to take a shower and do laundry. While the consumption in the other public buildings is shared by potentially all members of the community, it can be assumed that service houses are mainly used by people from non-piped homes. This is, however, only an assumption, and the daily consumption from public buildings ranged from 8 L/d/cap when calculating based on the entire settlements to 10 L/d/cap when using only the number of people living in un-piped homes. Either way, adding this amount to the one used in un-piped homes brought the average daily consumption for their residents to between 21 and 23 L/d/cap, or just above the WHO definition of basic level.
On the other hand, the in-home consumption calculated based on taphouse consumption data was inevitably overestimated, as a significant amount of water is lost by either deliberate flushing of the pipes before filling the jugs or spillage, as often indicated by the wet/icy ground under and around the taphouses. This means that the difference between water consumption in piped and un-piped homes is likely to be even larger than described here, and that the consumption of residents of un-piped homes may well fit within the basic to inadequate levels as defined by WHO, 2020.
The three northern settlements that do not have a water supply (Naajaat, Nutaarmiut and Qeqertat) officially showed a daily consumption of 0 L/d/cap, while in reality the residents collect alternative water from natural sources. The null consumption from taphouses for these three communities was included in the calculations of the relevant averages (national, settlements and un-piped homes) shown in , as this study approaches access to a water as a basic human right, and therefore acknowledges its absence where relevant.
Alluitsup Paa is the only settlement in which water can be truck-hauled to some homes for parts of the year. Adjusting for the average household size in the settlement, this either added an extra 8 L/d/cap for the specific 26 truck-serviced residents – out of 202 inhabitants of the settlement, or raised the daily water consumption from 12 to 14 L/d/cap for all inhabitants of un-piped homes in the settlement.
At regional level, interesting differences emerged. shows an overview of the disparities between regions, including the repartition of the rural population across the country, and the daily water use per capita for piped and un-piped homes of each region. Overall, the average daily consumption for inhabitants of piped homes was rather even across all regions, ranging from 51 to 65 L/d/cap, with an average of 57±5 L/d/cap, and therefore laid reliably in the intermediate access level. The situation for un-piped homes was less even between regions, ranging from 10 to 45 L/d/cap, with an average of 18±12 L/d/cap, thus overall staying below the intermediate access level, and ranging from inadequate to intermediate. Two regions really stood out, namely the northernmost Avannaata region where the majority of the population used an average of only 13 L/d/cap, and the west coast of the Sermersooq region, which had a much higher water use per capita from taphouses than all the others (45 L/d/cap, against 10 to 14 L/d/cap for the others).
Figure 3. Regional distribution of the rural population, and daily water consumption per capita for piped (dark) and non-piped (light) consumers in each Greenlandic region.
One hypothesis was that the differences in water consumption among settlements could be explained by the limited size of the raw water resources. The data showed that the current capacity of water supplies, shown in (more detail in S3), was determined in most cases by the infrastructure in place, rather than the raw water resources – although they could also be a limiting factor in some cases. However, capacity was reported to be affected by seasonality, and typically limited in the winter (14 of 39 supplies) due to the freezing of raw water resources, and the limited size of winter tanks. The potential for expansion of water supplies (), estimated by Nukissiorfiit for the seafood industry, served as an indication of how much water was potentially available in the area. The prospects of expanding the intake of water from available water resources appeared good in 23 settlements, limited in 14 and inexistent in 13 – the latter being mostly found in the Northern region of Avannaata. Interestingly, the northern region of Avannaata, with lowest percentage of piping, also had the most limited production capacity, and highest proportion of water supplies deemed non-expandable.
Figure 4. The range of water supply capacity in each Greenlandic region, as reported by Nukissiorfiit. In the plot, the box extends vertically from the first quartile (25th percentile) to the third quartile (75th percentile), the cross represents the mean value, and the horizontal line inside the box represents the median value. Whiskers represent the minimum and maximum value excluding outliers, and the dots represent the outliers.
Figure 5. The potential for expansion of the water supply, estimated by Nukissiorfiit based on the needs of the seafood industry, for the settlements in each Greenlandic region.
A two-part model indicated that the potential for expansion could influence the absence or presence of piping within settlement (df = 2, LRT = 5.78, p=0.056). Output from the model indicated that it was more likely to have houses with piping in settlements with limited or good potential for expansion, as opposed to settlement with inexistent potential for expansion (). However, in settlements with piping, there was no clear relationship between the potential for expansion and the level of piping (df = 2, LRT = 4.96, p=0.08). Here, it was indicated that the level of piping was slightly smaller in settlements with limited potential as opposed to settlements with good or inexistent potential. This result is most likely due to a relatively small sample size (n=32).
Figure 6. Correlation between potential for expansion of the water supply, and probability that there is piping in place to at least some homes, in Greenlandic settlements.
Another set of factors were explored as to their role in driving the amount of water used by un-piped households. Water consumption from taphouses was modelled, with results indicating that latitude, average distance to taphouse, settlement steepness and the percentage of piped homes had no effect on the water consumption from public taps, leaving household size as the only driver of water consumption. Regression assumptions were verified and indicated no issues related to homogeneity or independence.
Finally, using data from 46 settlements, the final model revealed a significant effect of household size on the water consumption from public taps (df = 1, χ2 = 8.83, p=0.003). This effect indicated that daily water consumption per capita was lower in settlements with larger households (, see S4 for more detail). The other factors were confirmed to have no detectable influence on the amount of water collected from taphouses, thus other parameters must be driving the significant differences in water consumption of un-piped homes among the settlements.
Figure 7. Predictions from Gamma GLM showing the effect of household size, measured in capita per household, on the water consumption from public taps, measured in litre per day per capita.
Qualitative assessment of water sufficiency
When questioned about their water use, respondents using taphouses unanimously reported having enough water for their needs – although one deplored having to go out too often to collect it. Ten out of 19 un-piped households reported that the daily amount of water used varied with activity and weather/season, as well as with the health of the person in charge of collection. Three of the 19 households were unable to provide a clear daily amount collected. When it was possible, by an interview, to estimate a daily amount of water used in the household, it was in the range 3.75 to 30 L/d/cap in houses without a tank, and 12 to 25 L/d/cap in those with a tank that was refilled by the residents themselves. This is within the range calculated based on the quantitative data of 4–59 L/d/cap, including possible spillage.
One respondent in a town without service house reported trying to save water (e.g. for flushing) because of the size limitations of their tank, forcing the household to do laundry less often than they would like. This was despite the truck-haul water delivery system in place in the town, because the delivery time was estimated to be too long. Also, the house was deemed by the respondent to be too small for installation of a larger tank.
In addition to public water, according to the interview responses, many households used an alternative water source collected directly from the natural environment (from ice floes collected at sea, a river or a lake) and used preferentially as drinking water. The town of Nanortalik was used as a control, to establish whether a causality exists between the lack of piping and the use of alternative water sources. There, three respondents lived either in piped homes (2) or in a home with a tank refilled by truck-haul (1). Despite easy and reliable water access on their premises, all three reported using alternative water for drinking – at least during the summer when the river was easier to access (2), and year-round for the last respondent.
Affordability of water
In Greenland, the cost of water, when piped to a household, is fixed (currently at 20 DKK/m3) and highly subsidised in communities with expensive treatments such as reverse osmosis (RO) or melting of ice, while water collected from a taphouse is free for the consumer. Indeed, affordability was not a major limiting factor for the water consumption in either piped or un-piped households, as confirmed by all respondents using taphouses. The fixed price also limits the impact of cost on the variability of consumption between settlements.
The only respondent who expressed concerns about pricing had a tank that was refilled by truck-haul, for a fee, upon request; they shared concerns about the overall cost of water and delivery, and how this was a limiting factor of their water use.
However, personal views on the cost of water expressed during interviews varied greatly, with some respondents saying they chose “not to waste money on water”, while another reported buying bottled water and assuming the price was worth the health benefits of good water: “it can be a little expensive, but if you want to be healthy, (…) the price is ok”.
It is in theory possible for owners of un-piped houses to connect their home to the water main of the settlement when there is one; but since the year 2000, the cost of connecting to the system – and heating the connection – has fallen on the residents themselves. On top of paying for the connection itself comes the cost of (re)-constructing a toilet/bathroom, for which specific requirements are given in the legislation when water is supplied. This may be very costlyin particular, considering that it is not possible for rural residents to obtain a mortgage on their house, thus this financial constraint may contribute to limiting the frequency of piping [Citation7]. The cost of connecting was considered prohibitive by two respondents, while a third said that “it's affordable for everyone, and it pays off in health”, but admitted being unsure on the exact price.
Discussion
Accessibility of treated water is limited in rural Greenland, where about 80% of rural homes are un-piped. However, most residents of un-piped homes have access to treated water at public taps, leaving only three out of 52 settlements completely without a public water supply (this number should go down to only two by the end of 2022). Truck-haul of water, which is used year-round in parts of Arctic Canada [Citation8,Citation30], is extremely rare in rural Greenland, where only one settlement has access to it. As a result of the low piping frequency, many households have to fetch water from the public taps outside their homes, and the accessibility of taphouses thus becomes a decisive parameter of water accessibility for residents of rural Greenland.
Accessibility of treated water varies highly across the country, with the proportion of piped homes ranging from 1% in settlements in Avannaata in the North to 65% for settlements in the capital region. It was hypothesised that awareness of limitations of the raw water resource could be a main limiting factor in connecting to the water main in rural Greenland. While the source capacity for expansion appears good in 23 settlements, limited in 14 and inexistent in 13 – mostly in the Northern region of Avannaata, the findings from this study indicate that the source capacity for expansion could be a deciding factor, as to whether a settlement has piping or not. Generally, settlements with good or limited potential for expansion are more likely to have households with piped water compared to settlements with low potential for expansion. This effect could be a hindrance to water accessibility in settlements that have no source capacity for expansion. Interestingly, the source capacity for expansion does not seem to affect the level of piping in settlements where some people have access to in-home piped water. This could be due to fairly low sample sizes, but it is also likely that other factors could be determining the piping levels, e.g. the historic development plans for the country that focused on the southern regions [Citation7]. Another factor of accessibility could be the harsh climatic conditions, as is seen in other parts of the Arctic and Subarctic where winter temperatures regularly reach −40°C, alongside winter storms [Citation6], potentially limiting the use of outdoor public taps. Despite the challenges of fetching water manually from taphouses, the service was deemed continuous and reliable enough by the most users questioned – yet they overwhelmingly expressed an interest in developing the piping system to all homes, when asked for possible improvements.
As for sufficiency, the overall Greenlandic daily water consumption per capita, and the average water consumption in the towns, sit comfortably – yet reasonably – in the optimal range, with 104 and 114 L/d/cap, respectively. In addition, these numbers must include water collected from alternative sources in nature, which has not been quantified in this study. For comparison, the daily water consumption in Denmark and the US were, respectively, 101 and 310 L/d/cap [Citation31,Citation32]. At a time when the world is reckoning with overexploitation of resources and overpopulation, awareness about saving water is growing, and arguments could be made that it would not necessarily be desirable to go over the 100 L/d/cap recommended by WHO.
In the Greenlandic settlements, on the other hand, the daily water consumption lies between basic and intermediate levels overall, and typically dives below basic level in un-piped homes, thus potentially affecting the health of a significant portion of the rural population. This observation would be ignored if looking only at country or national level. This low water consumption in un-piped homes, which is in theory not sufficient to support public health reliably [Citation1], is observed despite taphouses being located at a distance characteristic of the intermediate access range – i.e. within 100 m of the home [Citation1]. This documents that, even though some consumers experience the fetching of water as relatively unproblematic, it is in fact a hindrance to consumption. However, since the water consumption in rural piped homes, with its average of 55 L/d/cap, was also observed to be low compared to the country average and the urban consumption, other factors may contribute to limitations in water use, such as habits or the lack of sewer.
In fact, a number of factors were investigated as to their role in the variability of water consumption in un-piped homes (distance to the taphouse, steepness of the terrain, household size, service saturation at the point of use, latitude of the settlement, and percentage of piped homes). The only significant effect indicated that daily water consumption per capita was lower in larger households, which could be explained by the shared use of some of the water, destined to everyday chores and maintenance of the house. However, settlements with larger household size also generally have a larger population size and a greater service point saturation, which could also be investigated as reasons for lower water consumption. An interesting exemption is the relatively high water consumption in un-piped homes in the region of the capital city, with a consumption of 45 L/d/cap, against 10 to 14 L/d/cap for the other regions. This may be explained by the proportion of houses in the capital area that are summer homes for inhabitants of the capital city Nuuk, who are therefore used to urban levels of water consumption – although this is only speculation and deserves further research. Interestingly, water consumption from taphouses did not seem affected by distance to taphouse, steepness of terrain, latitude, or piping level in the settlement. This indicates, at settlement level, that harsher conditions (e.g. longer walks, steeper terrain, colder climate, or social pressure) are not necessarily a limiting factor in the collection of water from taphouses. However, it is possible that such effects would be more explicit at the individual level and, therefore, not necessarily visible at settlement level.
Affordability of water, which has been documented to hinder water consumption in parts of Canada and Alaska [Citation6,Citation33,Citation34], is hardly a factor in Greenland, as water is provided free-of-charge through taphouses, and service is apparently deemed continuous and reliable enough by the users. While it is possible for residents to connect to the main in principle, it is reportedly costly; and although developing piping in all rural homes seems like an obvious answer, it is not as straightforward as it seems, as illustrated by the interviewee who pointed out the links between all parts of the system: piping, sewer, and subsistence activities in the area. Additionally, since responsibility for the drinking water supply and the sewage system belong to Nukissiorfiit and the municipalities, respectively, cooperation between the two bodies is needed to develop the systems harmoniously.
Overall, the level of water consumption observed in un-piped homes is in theory not sufficient to support public health reliably [Citation1] and poses questions as to health hazards in the settlements, which should be investigated further. It is well documented that limited water access and degraded infrastructure pose health risks for communities, in particular respiratory illnesses and skin infections [Citation12,Citation35–41], as well as mental health issues [Citation8,Citation42,Citation43]. The numerous examples include high rates of lower respiratory infections in Alaskan villages without in-home water services [Citation11,Citation44], the case of Chukotka, Russia, where ageing infrastructure is suspected of exposing the population to waterborne diseases [Citation9], and mental stress documented in Canada in relation to the burden of hauling enough water to provide for the needs of families [Citation45]. Limited water quantities have also been found to lead to the deterioration of water quality in household water storage, previously documented by Wright et al. [Citation22] in similar settings in Canada, and the use of shared basins for handwashing, documented in Alaska by Chambers et al. [Citation46], a practice that could create a transmission route for pathogens.
Furthermore, alternative water sources are a common practice – also documented in Alaska and Canada [Citation47,Citation48,Citation49,Citation50,Citation18], which seems, in Greenland, to be caused mainly by users´ preferences. Its prevalence in Nanortalik seems to confirm that alternative water is used by choice rather than necessity, and even in homes that have otherwise easy access to treated water – i.e. are piped, or have truck-haul delivery to a tank. The quality of this water has not been investigated in Greenland.
While there is currently no data on health consequences of the lack of piping in rural Greenland [Citation15], the limited water use and resulting insufficient hygienic standards could expose the rural Greenlandic population to both physical and mental health hazards. Further research is needed to explore the extent of this effect. The main points identified in this study as requiring further research are water quality and its possible deterioration during household water storage and the use of shared basins for handwashing. Un-monitored alternative water sources from nature – also documented in Alaska and Canada [Citation47–50] – constitute an unknown in the system and could also be the topic of further research. In conclusion, the limited physical access to treated water in the settlements (from the low proportion of piped homes and the physical constraints of collecting water from taphouses) leads to an overall daily water consumption that is in theory too low to reliably sustain public health. Physical access can be improved by developing the rate of connection to the water supply, which could be supported by financial incentives. In the meantime, safe methods of water storage and handwashing facilities could reduce health impacts.
Data availability
A summary of the data supporting the results can be found in the supplementary materials 1, 2, 3 and 4. The data supporting the results can be obtained upon reasonable request.
Ethics and consent
All participants in interviews have given consent to the use of their answers in this research, and all results were anonymised in order to ensure that no participant could be identified through this paper.
Supplemental Material
Download Zip (220.3 KB)Acknowledgments
Sincere thanks to the residents of Itilleq, Nanortalik, Qaarsut, Saattut, Sarfannguit, Tasiusaq and Uummannaq for their patience and participation in the surveys and research-related events that took place in their communities.
For translation, facilitation and cultural advice during fieldwork, the authors would like to acknowledge the work of Casper Eliassen in Qeqqata and Kujalleq regions, Karina J. Filemonsen in Uummannaq district, and Johanne Ludvigsen Sarfannguit. For the translations of questionnaires: A. Pipaluk Hammeken, Orla Isaksen Mølgaard, Jane Østbjerg, Camilla Berthelsen, and Najattaaq Thomsen.
For their hospitality and logistical support, thanks go to our partner in the Uummannaq district, the Uummannaq Polar Institute, as well as to the staff and children of the Uummannaq children’s home for their unfailing warm welcome.
Deepest thanks also to the Eliassen family in Nanortalik and to the Olsen family in Sarfannguit, for their warm hospitality and invaluable help in the field, as well as to the Tobiassen family for accommodation in Qaarsut, and the school and kindergarten in Sarfannguit for their hospitality.
The authors would also like to thank Mads Albæk Sørensen, Mike Hjuler Schmidt, Knud Dalager, and Inaluk Groth from Nukissiorfiit, as well as the Nukissiorfiit office in Uummannaq, for taking the time to provide data and clarifications.
Disclosure statement
No potential conflict of interest was reported by the author(s).
Supplemental data
Supplemental data for this article can be accessed online at https://doi.org/10.1080/22423982.2022.2138095
Additional information
Funding
References
- Howard G, Bartram J, Williams A, et al. Domestic water quantity service level and health. second edition ed. Licence: CC BY-NC-SA 3.0 IGO. Geneva: World Health Organization; 2020.
- UN. General Assembly (64th Sess.: 2009-2010). The human right to water and sanitation: resolution / adopted by the General Assembly, Accessed on 28 July 2010 2. A/RES/64/292, Agenda item 48. 2010.
- SDG UN 6. https://sdgs.un.org/, accessed on 25 July 2022.
- UN. General Assembly (70 th sess.: 2015-2016). The human rights to safe drinking water and sanitation: resolution / adopted by the General Assembly on 17 December 2015 A/RES/70/169, Agenda item 72 (b), 4.
- United Nations Department of Economic and Social Affairs The Sustainable Development Goals Report 2021. The Sustainable Development Goals Report. 2021; 13: . DOI:10.18356/9789210056083.
- Penn H, Loring PA, Schnabel WE. Diagnosing water security in the rural North with an environmental security framework. J Environ Manage. 2017;199:91–15.
- Hendriksen K, Hoffmann B. Greenlandic water and sanitation-a context oriented analysis of system challenges towards local sustainable development. Environ Sci Pollut Res Int. 2018a;25(33):33014–33024.
- Sohns A, Ford JD, Riva M, et al. Water vulnerability in arctic households. Arctic. 2019;72(3):300–316.
- Dudarev AA. Public health practice report: water supply and sanitation in Chukotka and Yakutia, Russian Arctic. Int J Circumpolar Health. 2018;77(1):1423826.
- Eichelberger LP. Living in utility scarcity: energy and water insecurity in Northwest Alaska. Am J Public Health. 2010;100(6):1010–1018.
- Daley K, Castleden H, Jamieson R, et al. Municipal water quantities and health in Nunavut households: an exploratory case study in coral harbour, Nunavut, Canada. Int J Circumpolar Health. 2014;73(1):1–10.
- Hennessy TW, Bressler JM. Improving health in the Arctic region through safe and affordable access to household running water and sewer services: an Arctic Council initiative. Int J Circumpolar Health. 2016;75:31149.
- WHO/UNICEF 2021, https://washdata.org/data/household#!/dashboard/new, accessed 2021 Dec 13.
- Bressler JM, Hennessy TW. Results of an Arctic Council survey on water and sanitation services in the Arctic. Int J Circumpolar Health. 2018;77(1):1421368.
- Hendriksen K, Hoffmann B. Greenlandic water and sanitation systems-identifying system constellation and challenges. Environ Sci Pollut Res Int. 2018b;25(33):32964–32974.
- Eichelberger L. Household water insecurity and its cultural dimensions: preliminary results from Newtok, Alaska. Environ Sci Pollut Res Int. 2018;25(33):32938–32951.
- Marino E, White D, Schweitzer P, et al. Drinking water in northwestern Alaska: using or not using centralized water systems in two rural communities. Arctic. 2009;62(1):75–82.
- Ritter TL, Lopez ED, Goldberger R, et al. Consuming untreated water in four southwestern Alaska native communities: reasons revealed and recommendations for change. J Environ Health. 2014;77(5):8–52.
- Stefanelli R, Castleden H, Harper S, et al. Experiences with integrative Indigenous and Western knowledge in water research and management: a systematic realist review of literature from Canada, Australia, New Zealand, and the USA. Environ. Rev. 2017;25.
- Wright CJ, Sargeant JM, Edge VL, et al. How are perceptions associated with water consumption in Canadian Inuit? A cross-sectional survey in rigolet, labrador. Sci Total Environ. 2018a;618:369–378.
- Eichelberger L, Hickel K, Thomas TK. A community approach to promote household water security: combining centralized and decentralized access in remote Alaskan communities. Water Security. 2020;10(2020):100066.
- Wright CJ, Sargeant JM, Edge VL, et al. Water quality and health in northern Canada: stored drinking water and acute gastrointestinal illness in Labrador Inuit. Environ Sci Pollut Res Int. 2018b;25(33):32975–32987.
- Thomas TK, Hickel K, Heavener M, et al. Extreme water conservation in Alaska: limitations in access to water and consequences to health. Public health. 2016;137, 59–61. DOI:10.1016/j.puhe.2016.06.002.
- Alessa (Na’ia) L, Kliskey (Anaru) A, Williams P. Forgetting Freshwater: technology, values, and distancing in remote arctic communities. Society and Natural Resources. 2010;23(3):254–268.
- StatBank Greenland. Accessed 10 June 2021. www.bank.stat.gl
- Malterud K, Siersma VD, Guassora AD. Sample size in qualitative interview studies: guided by Information Power. Qual Health Res. 2016;26(13):1753–1760.
- Zuur AF, Ieno EN, Elphick CS. A protocol for data exploration to avoid common statistical problems. Meth Ecol Evolut. 2010;1(1):3–14.
- Zuur AF, Ieno EN. A protocol for conducting and presenting results of regression‐type analyses. Meth Ecol Evolut. 2016;7(6):636–645.
- R Core Team. 2021. R: A language and environment for statistical computing. R Foundation for Statistical Computing. https://www.R-project.org/
- Daley K, Truelstrup Hansen L, Jamieson RC, et al. Chemical and microbial characteristics of municipal drinking water supply systems in the Canadian Arctic. Environ Sci Pollut Res Int. 2018;25(33):32926–32937.
- Højrup A, Therkildsen L, Winther A , et al. Vand i Tal (Water in Figures) Dansk Vand- og Spildevandsforening (the Danish Water and Wastewater Association). 2020;4:.
- Dieter CA, Maupin MA, Caldwell RR, et al. Estimated use of water in the USA in 2015: u.S. [Supersedes USGS Open-File Report 2017–1131]. Geological Survey Circular. 2018;1441:65.
- Eichelberger L. Spoiling and sustainability: technology, water insecurity, and visibility in Arctic Alaska. Med Anthropol. 2014;33(6):478–496.
- Ritter TL. Sharing environmental health practice in the North American Arctic: a focus on water and wastewater service. J Environ Health. 2007;69(8):50–58.
- Gessner BD. Lack of piped water and sewage services is associated with pediatric lower respiratory tract infection in Alaska. J Pediatr. 2008;152(5):666–670.
- Harper S, Edge V, Shuster-Wallace C, et al. Weather, water quality and infectious gastrointestinal illness in two Inuit communities in Nunatsiavut, Canada: potential implications for climate change. Ecohealth 8. 2011: 93–108
- Hennessy TW, Ritter T, Holman RC, et al. The relationship between in-home water service and the risk of respiratory tract, skin, and gastrointestinal tract infections among rural Alaska natives. Am J Public Health. 2008;98(11):2072–2078.
- Koch A, Sørensen P, Homøe P, et al. Population-based study of acute respiratory infections in children, Greenland. Emerg Infect Dis. 2002;8(6):586–593.
- Luby S, Agboatwalla M, Feikin D, et al. Effect of handwashing on child health: a randomised controlled trial. Lancet. 2005 [2005 Jul 16-22];366(9481):225–233.
- Mosites E, Lefferts B, Seeman S, et al. Community water service and incidence of respiratory, skin, and gastrointestinal infections in rural Alaska, 2013-2015. Int J Hyg Environ Health. 2020;225:113475.
- Wenger JD, Zulz T, Bruden D, et al. Invasive pneumococcal disease in Alaskan children: impact of the seven-valent pneumococcal conjugate vaccine and the role of water supply. Pediatr Infect Dis J. 2010;29(3):251–256.
- Brubaker M, Berner J, Chavan R, et al. Climate change and health effects in Northwest Alaska. Glob Health Action. 2011;4(1). DOI:10.3402/gha.v4i0.8445.
- Sarkar A, Hanrahan M, Hudson A. Water insecurity in Canadian Indigenous communities: some inconvenient truths. Rural and remote health. 2015;15(4):3354.
- Eichelberger LP. Sustainability and the politics of calculation: technologies of ‘safe water’, subject-making, and domination in Alaska. Journal of Political Ecology. 2012;19:145–161.
- Hanrahan M, Sarkar A, Hudson A. Exploring water insecurity in a northern Indigenous community in Canada: the “never-ending job” of the southern Inuit of Black tickle, labrador. Arct Anthropol. 2014;51(2):9–22.
- Chambers MK, Ford MR, White DM, et al. Distribution and transport of fecal bacteria at spring thaw in a rural Alaskan community. Journal of Cold Regions Engineering. 2008;22(1). DOI:10.1061/ASCE0887-381X200822:116.
- Mattos KJ, Eichelberger L, Warren J, et al. Household water, sanitation, and hygiene practices impact pathogen exposure in remote, rural, unpiped communities. Environ Eng Sci. 2021;38(5):355–366.
- Martin D, Bélanger D, Gosselin P, et al. Drinking water and potential threats to human health in Nunavik: adaptation strategies under climate change conditions. Arctic. 2007;60(2):195–202.
- Wilson NJ. Indigenous water governance: insights from the hydrosocial relations of the Koyukon Athabascan village of Ruby, Alaska. Geoforum. 2014;57:1–11.
- Daley K, Castleden H, Jamieson R, et al. Water systems, sanitation, and public health risks in remote communities: Inuit resident perspectives from the Canadian Arctic. Soc sci med. 2015;135:124–132. DOI:10.1016/j.socscimed.2015.04.017.