
ABSTRACT
This paper presents an evaluation on strategies for rubber plantation mapping employing SAR data coupled with Random Forest (RF) and Support Vector Machine (SVM). Linear backscatter coefficients achieved saturation point at about 10 years, making this form of polarimetric data being robust only for young to mature stands. This research found that the performance of both algorithms was comparable. The addition of texture features gave substantial impact to the overall accuracy. As indicated by the analysis of variable importance, only some texture features have contributed to higher overall accuracy. Classification using a subset of texture features pointed out that accuracy could be improved using dual polarimetric data, while trivial enhancement was seen in combined HH, HV and VV backscatter intensities. The research showed that classification accuracy could be further augmented by setting proper classification parameters. Nonetheless, it is argued that the level of improvement would greatly depend on selecting a proper dataset fed into classifier, rather than tuning classifier parameters.
Introduction
With addition of frequent haze and smoke, clouds and rainfall limit the exploitation of multi-spectral data as the data source for remotely-sensed environmental monitoring in the tropics. Benefited from its longer wavelength and day or night capability, Synthetic Aperture Radar (SAR) is therefore vital to capture ever-changing land utilizations, as an individual dataset or in conjunction with other multi-spectral data through data fusion techniques. To date, various wavelengths have been used in spaceborne SAR platforms. Short wavelength SAR sensors, such as X- or C-band sensors used by Cosmo-SkyMed and Radarsat satellites, have been profoundly useful for agriculture applications [Fontanelli et al., Citation2013]. However, paucity of their ability in probing sub-canopy scattering objects, such as branches and stems, bounds their implementation in complex terrain cover such as found in tropical forests. In this domain, longer wavelengths, for example P- or L-band SAR are particularly needed.
Literature survey showed that majority of L-band SAR utilizations in tropical areas have been devoted to forestry-related applications [Englhart et al., Citation2011; Reiche et al., Citation2013; Thapa et al. Citation2014]. It can be associated to the efforts to demonstrate the capability of L-band SAR to support monitoring one of the richest biodiversity regions in the World. As boundary of the monitoring project is generally needed, categorical (land use or land cover) maps are primarily required and have been a focus for scientific experiments. Mapping tropical rain forests and their surrounding environment have been demonstrated [Longepe et al., Citation2011; Laurin et al., Citation2013; Reiche et al., Citation2013; Thapa et al., Citation2014; Jebur et al., Citation2015; Trisasongko, Citation2015], which suggested that L-band wavelength plays a significant role in the provision of up-to-date Earth surface condition. To support carbon accounting programs and conventions, L-band SAR data were also found valuable to estimate tropical forest biomass [Hamdan et al., Citation2011]. However, with depleting tropical forest cover around the world, the extension of aforementioned experiments is needed to include woody vegetation outside forest areas (known as trees outside forests, TOF [Schnell, Citation2015; Seidel et al., Citation2015; Rossi and Rousselet, Citation2016]). This is to ensure that climate studies can be reinforced by a more comprehensive dataset as TOF may have significant contribution to biomass accounting at regional level.
In Indonesia, majority of tropical forest conversion are due to the expansion of plantations, particularly oil palm, rubber and acacia. Generally, identifying and mapping these types of plantations among other land use classes have been fairly successful, especially when polarimetric SAR data are employed [Kobayashi et al., Citation2012; Kobayashi et al., Citation2015; Trisasongko, Citation2015]. Nonetheless, since variations in single woody vegetation category exist due to different planting year, detailed land cover mapping to further distinguish diversity of plantation’s stand age needs to be addressed. Knowledge on the stand age is also useful to estimate the biomass since the level of biomass is known proportional to stand age [Morel et al., Citation2011]. Nonetheless, very limited reports have been presented in the discrimination of stand age in rubber plantation using polarimetric SAR data. The information is especially critical for young stands as improper management would likely affect their future production. Hence, knowing variations when they are in juvenile (less than 5 years) and maturing (5−7 years) phase would be beneficial in plantation management perspective.
Mapping stand age generally involves supervised classification to build the spatial extent in categorical fashion. Several supervised classification techniques have been proposed, generally categorized into parametric (including likelihood-based techniques) or non-parametric approaches, as used in decision trees and neural networks. Recent literature, however, tend to focus on the latter, especially SVM and RF [Chabrier et al., Citation2012; Naidoo et al. Citation2014; Sonobe et al., Citation2014; Clewley et al. Citation2015]. Both approaches have known being consistently superior than conventional methods such as maximum likelihood classification or decision trees [Rodriguez-Galiano and Chica-Rivas, Citation2014; He et al., Citation2015; Low et al. Citation2015].
Support Vector Machine [Vapnik, Citation2000] has been acknowledged for its versatility to adapt on small datasets. This characteristic is particularly important to remote sensing since ground data are usually limited due to accessibility problems and remoteness of sample sites. The prime issue in the implementation of SVM, however, is associated to parameter setting and kernel selection. Cost parameter (C) is used to regulate penalties when training samples are falsely located in areas beyond their decision boundary. Large cost exposes the model to precisely fit only to the training set. Nonetheless, if statistical variations are fairly large, the model cannot easily adapt the deviation. Initial SVM documentation suggested C = 1 [Vapnik, Citation2000], which then was also adopted in earlier SVM implementation in remote sensing [Foody and Mathur, Citation2004]. Recent paper indicated that lower cost setting was found optimal in the case of agricultural classification using TerraSAR-X data [Sonobe et al., Citation2014]. Meanwhile, Bagan et al. [Citation2012] suggested setting cost parameter between 120 and 150 for a combined multi-spectral and SAR dataset. Nonetheless, it appears that concrete guidance on viable C parameter has yet to be formulated; hence further experimentation on tuning C parameter is therefore suggested.
Another issue related to the implementation of SVM is the selection of kernel type. Majority of earlier research has paid much attention to using non-linear kernel for projecting raw digital number or other data representation into higher forms in order to gain linearity of decision boundaries. Additional SVM parameter associated to non-linear kernel is γ. Analogous to cost parameter, γ contributes to handling overfitting; hence, its large value would excessively fit for training data but may not be valid for testing dataset. A report by Huang et al. [Citation2002] concluded that the accuracy improvement was insignificant if γ exceeded 7.5. Using a combined Radial Basis Function (RBF) kernel and C = 5000, Pal and Mather [Citation2005] suggested γ = 2 to gain the best accuracy. In another case study, Foody and Mathur [Citation2004] showed that optimal γ was in range between 0.005 and 0.08. Bigger gamma setting was found being a reason for decreasing accuracy for more than 20%. Comparable to the report, Bagan et al. [Citation2012] concluded that the suitable γ value was 0.1 ‒ 0.2. It should be noted, however, that very big γ value (64) was found valuable for classification [Sonobe et al., Citation2014]. Similar case also applies with kernel selection. RBF kernel has been extensively tested, but results appear to be inconclusive. Drawback of using RBF kernel was reported by Chabrier et al. [Citation2012], which resulted accuracies consistently below the ones provided by polynomial kernels. It gained comparable accuracy to linear kernel at certain iteration levels. At present, dearth guidance on setting SVM parameters and kernel selection exists, leading to necessity of further trials on tuning SVM parameters.
Random Forest proposed by Breiman [Citation2001] has some advantages compared to SVM, including limited parameters to adapt. Two main parameter settings for RF are the number of trees developed in the forest (“ntree”) and the number of possible splitting variables for each node (“mtry”). The latter is generally set by an initial trial value (usually a squared root of total input variables), with some minor variation such as reported by Clewley et al. [Citation2015] with mtry = 4. Unfortunately, there has also been an inconclusive result in finding feasible ntree value, which varies in hundreds [Naidoo et al., Citation2014]. Additional parameter used to exploit the performance of RF is the maximum depth of the tree (“maxdepth”), which has been left unexplored to some extent.
It is argued that one of the main roots of uncertainty in classification using SVM and RF is data source. As limitations of partial polarimetric SAR data have been evident [Rosenqvist Citation1996; Trisasongko et al., Citation2015], further research employing multi-polarization data can contribute to a complete understanding on the contribution of SAR data to efficient mapping of rubber plantation. In particular, this paper attempts to evaluate the performance of backscatter coefficients, the primary form of polarimetric data as a source of information and the extent of their contribution. In addition, it also assesses the contribution of texture features derived from different polarization states to the overall accuracy. As previous research often use default parameters [Foody and Mathur, Citation2004; Naidoo et al., Citation2014], the role of tuning classifier has been least understood. Hence, this paper also examines the role of fine tuning SVM and RF parameters to understand variability of overall accuracy due to changing parameter settings of classifiers.
Methodology
Test site
The research was situated in Subang, West Java, Indonesia (). The area hosts one of the most productive rubber estates owned by central government enterprise, PTPN 8 Kebun Jalupang. The estate is located in fairly flat terrain, with some blocks situated in undulating terrain in southern part of the site. Typical soil of the area is Inceptisols, with some inclusions of Entisols and Alfisols. Climate classification based on Köppen criteria is A, indicated by high to very high rainfall, especially between November to March.
Figure 1. Test site of Subang region, Java, Indonesia. Shuttle Radar Topography Mission (SRTM) data are used to illustrate the terrain. Color composite image is shown as VV, VH and HH in red, green and blue respectively. ALOS-2 data © JAXA.
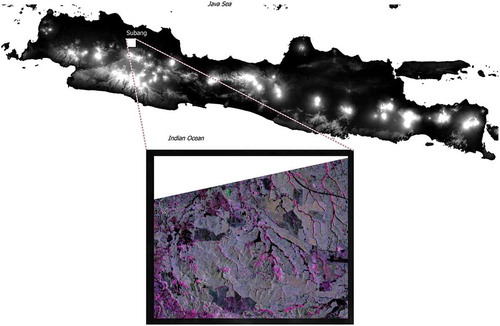
In color composite above, man-made structures are presented in very bright color due to the dominance of double bounce scattering at all linear polarization states. This type of scattering returns incoming waves at high level. Bare surface is shown in reddish, indicating dominant contribution of VV polarization, with some additions from HH. Woody vegetation appears green, indicating foremost contribution of cross (HV) polarization. Two types of woody vegetation exist in the scene, i.e. mixed garden and rubber plantation. The former can be indicated by slightly coarse texture, while rubber stands are pictured in a smoother texture.
Datasets
Fully polarimetric Advanced Land Observing Satellite 2 (ALOS-2) data, acquired by Japan Aerospace Exploration Agency (JAXA) in 15 April 2015, served as the primary data for this research. The data were available in Committee on Earth Observation Satellites (CEOS) format at level 1.1, indicating that the data were provided in single look complex (SLC) image representation. The data were taken in ascending (night-time) mode. Selecting this mode has an advantage since night-time mode would have least inherent problem due to Faraday rotation (FR). Based on the assumption, the Scattering matrix of the data was not FR corrected.
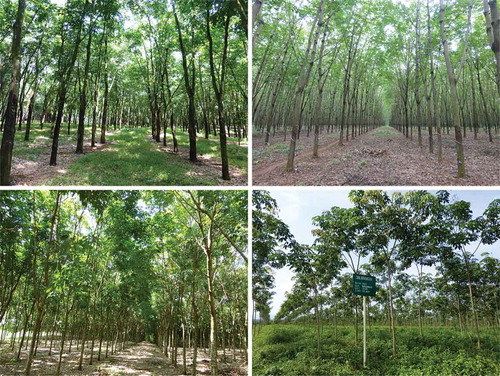
For comparison, ground datasets were collected during a survey conducted in December 2015 - January 2016 period. Time deviation (about 10 months) was assumed to be insignificant for observation of woody vegetation. This research also collected additional information from division (afdeling) managers who have been responsible for selected areas in order to understand the situation when the image was acquired. A plantation map was collected to obtain further information on planting year for each block and its rubber cultivar (known as kloon). Every blocks with crops other than rubber, including banana and mahoni (Swietenia mahagoni (L.) Jacq.), were therefore masked from the analysis. About 25 blocks were visited during the survey to collect field photographs (especially stand information or plang kebun), individual tree height and diameter at breast height (dbh). Stand age spans between 3 and 32 years old. shows rubber stands at various planting year and plang kebun describing block name, the afdeling, planting year and the kloon.
Figure 2. Field photograph of young and mature rubber. Clockwise from upper left corner: rubber planted in 1997, 2008, 2013 and 2010. Some blocks were equipped with stand information (plang kebun) as shown in lower right picture.
Pre-processing
SAR data delivered by JAXA were calibrated to obtain backscatter coefficients using Sentinel Application Platform (SNAP) version 2.0 toolbox provided by European Space Agency (ESA), freely available at http://step.esa.int/main/download. Following the convention, obtained backscatter coefficient at HH, HV and VV linear polarization were stored in decibel (db) unit to allow comparison to previously published works. To be able to visualize the data correctly, multi-looking procedure was conducted. This research used range-to-azimuth ratio of 1:2 to obtain ~ 5.8m pixel spacing in ground range geometry. This was subsequently followed by speckle filtering using Gamma MAP with 7 × 7 kernel size, after some trials using lower and higher kernel dimensions. The final pre-processing was geometric correction to fit existing base map. ALOS-2 data were corrected using Range-Doppler Terrain Correction method with 7.5 m pixel spacing employing global SRTM 1 arc-second DEM.
High spatial resolution imageries as shown by ALOS-2 data possess additional information such as texture. In this research, texture features were retrieved through Grey-Level Co-occurrence Matrix (GLCM) method proposed by Haralick et al. [Citation1973], with kernel size 11 × 11. Large kernel effect was studied by Longépé et al. [Citation2011] which found kernel size of 13 was advisable for achieving a better result. In this research, however, a slightly lower kernel was implemented to avoid the inclusion of pixels from different stands as the stand size is generally small and not uniform in shape and size. Lag distance of 4 was used in this research as shorter distance lag was shown prominent in the detection of rubber plantation [Longépé et al. Citation2011]. In addition to conventional mean (MEA) and variance (VAR), following texture features were also computed: angular second moment (ASM), energy (ENE), maximum probability (MAX), contrast (CON), dissimilarity (DIS), homogeneity (HOM), entropy (ENT) and correlation (COR). GLCM was applied to all backscatter coefficients to simulate data analysis on single-, dual- and multiple polarization.
Analysis
Supervised classification was adopted in this research since training and validation datasets were sufficiently available. These datasets were constructed through selection of information collected during field survey and confirmed by the estate manager. In this research, training and validation datasets were built from point-wise ground truth data. Although block map was available for some afdelings, point-wise was used to avoid canopy gaps existed within blocks. During the survey, many gaps were observed due to several causes, including diseases (especially white root disease) and natural hazards (wind-thrown or lightning). The gaps made homogeneity within block degraded, especially in old stands. Each point was then transformed into polygon through buffering with 50 m radius using QGIS software (www.qgis.org) version 2.12 (Lyon). This setting gives more than 100 pixels for each designated class, i.e. an amount which was suggested by Foody and Mathur [Citation2004].
Classification procedure was done in Orfeo Toolbox (OTB) environment version 5, freely available at https://www.orfeo-toolbox.org. Only SVM (with multi-class LibSVM implementation [Chang and Lin, Citation2011]) and RF were used in this research as they have gained more attention and are considered robust for land cover classification. Default parameter settings adopted by OTB for SVM and RF, as well as their tuned values, are presented in .
Table 1. Classifier parameters, their default values used by OTB and tuned parameters.
Each classification result was then examined by calculating confusion matrix with validation dataset as the reference. Classification accuracies were measured for individual classes as well as the overall accuracy. In addition, contribution of GLCM texture to the overall accuracy was evaluated using Multivariate Adaptive Regression Splines (MARS) and RF approaches. MARS, introduced by Friedman [Citation1991], investigates the interactions between variables through non-parametric regression technique. Hence, it is useful to study how SAR intensities and their GLCM texture derivatives interrelate and contribute to land cover discrimination. Similarly, RF [Breiman, Citation2001] can be used in classification and the analysis of importance among candidate variables. This research employed “earth” and “party” package to respectively implements MARS and RF in R statistical computing environment (https://cran.r-project.org/) version 3.2.3.
Results and Discussion
Saturation, the limiting factor
Electromagnetic waves and surface objects have strong relationship at certain level, leading to the eminent use of remote sensing in biophysical applications such as biomass estimation. SAR has a unique advantage due to its ability to penetrate the canopy and probing information under the canopy layer. However, all wavelengths used by SAR remote sensing have convinced limitation, where electromagnetic signals are no longer be able to detect the changing biomass. This level is generally recognized as the saturation level. Since stand age is generally related to biomass level, the ability of SAR in distinguishing stand age is also restricted.
It appears that saturation level is highly dependent to the type of vegetation and the forms of remotely-sensed data used to predict. Imhoff [Citation1995] found similarity of saturation level of SAR data at various frequencies at sub-tropical Hawaiian and North American coniferous forest, i.e. ~100 tons/ha, ~40 tons/ha and ~20 tons/ha for P-, L- and C-band respectively. In tropical forest, Ho Tong Minh et al. [Citation2014] argued that there is a possibility to identify very high biomass level (up to 450 ton/ha) with P-band SAR. Despite being considered inferior to fully polarimetry, dual polarized C-band SAR data were found capable to estimate sub-tropical biomass up to 360 ton/ha, when textural data were ingested into the model [Sarker et al., Citation2013]. These papers suggested that determining saturation level of specific woody vegetation is crucial for biomass estimation. Since the biomass is directly linked to stand age, the knowledge of stand age retrieval should be constructed to bound the biophysical analysis.
As shown in , initial assessment indicates that saturation is visually observed after 10 years. Point of saturation for rubber stands appears similar to the general model developed for mixed broadleaf forests [Karam et al., Citation1995]. Based on dual polarization HH+HV, Avtar et al. [Citation2011] indicated the similar level of saturation. Modeling using power function as indicated by b coefficient () suggests that HV and VV are rapidly saturated, while HH has a delayed saturation to some extent. Details on the statistical properties of the models are presented in .
Figure 3. Saturation of backscatter coefficients over rubber plantation.
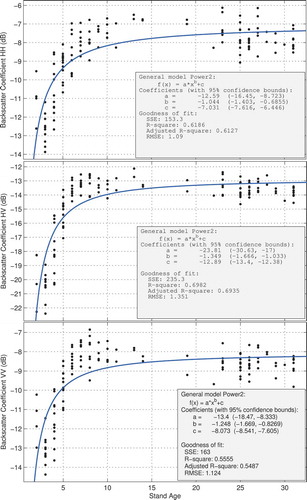
Vector radiative transfer modeling suggested that co-polarization channels have a shorter dynamic range [Karam et al., Citation1995]. They found that dynamic range of cross polarization was about 9 dB, in contrast to co-polarization with only about 4 – 5 dB. In this research, the cross-polarization behavior was in line to the model and also similar to previous research using dual polarization [Avtar et al., Citation2011]. Specifically in HH polarization, this research confirmed Avtar et al. [Citation2011] findings where rubber plantation exposed a slightly longer dynamic range (about 7 dB) than the one modeled by Karam et al. [Citation1995], i.e. 5 dB. Additionally, it appears that about 2 dB wider span than the model was indicated in VV polarization. These findings suggested that rubber exhibits sufficiently great dynamic range and therefore backscatter coefficients may have potential for rubber stands identification and biophysical assessments, especially in early growths.
According to Karam et al, [Citation1995] model, which was also confirmed by Rosenqvist [Citation1996], mechanisms related to surface roughness, local topography and ground vegetation (especially the existence and thickness of cover crop) gave substantial influence to backscatter coefficients in juvenile trees. Branches in young plants are responsible for single-bounce scattering, while double-bounce is due to the existence of ground-trunk interaction with incoming waves [Karam et al., Citation1995]. When rubber tree grows and reaches their maturity, contribution of soil backgrounds weakens and total backscatter in all polarization is then dominated by returning waves from trunks and branches. These tree components strongly attenuate L-band waves, therefore similarity endured between mature stands and old-growths. Although polarization ratios have been reported being useful for studying relationship between woody vegetation parameters and SAR properties [Mougin et al., Citation1999], this research discovered that coefficients of determination were severely low, i.e. 0.1785, 0.1727 and 0.0208 respectively for co-polarization ratio (VV/HH) and depolarization ratios HH/HV and VV/HV. The coefficients indicated that ratios were least feasible than conventional backscatter coefficients in the characterization of rubber stand age.
Since this research found that L-band SAR waves tended to saturate at certain point, further attempts to classify stand age were therefore made only to areas within age span of maximum 10 years. This limitation led to a geographical subset of the region with age distributions of 3 – 8 years old. In the following sections, discussions are limitedly applied to the detached data.
Classification
As indicated by , backscatter coefficients have limitation when dealing with similar features. At juvenile age (~3 years old), where canopy is less developed, the distribution of the data is clearly distinctive, especially in HH polarization. This polarization was also the best candidate for distinguishing 4 years old rubber stand from the rests. In the following years, however, linear polarization’s ability tended to decline along with full development of canopy. It may be attributed to the similarity between L-band main scatterers such as twigs and branches () among maturing stands. Separation, however, may be contributed from VV polarization to some extent.
Figure 4. Statistical distribution taken from combined training and testing samples.
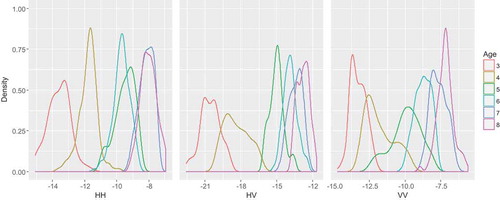
The figure illustrates the importance of full polarization data in distinguishing various rubber stands. Lacking of single linear component (HH, HV or VV) may initiate a drawback. Nonetheless, space-borne fully polarimetric data have been severely limited, which leads to further exploration on the best dual polarization out of three existing linear polarization combinations. To date, this type of data has been serving as one of few basic forms of SAR data in operational mode. As shown, HV has universal capability in discriminating all class targets with good sensitivity to variation in vegetation structure, especially twigs and branches as the main scatterers at L-band. In the case of dual polarimetry, any combination involving cross-polarization may have a better chance to obtain a good separability. However, preference may be given to HV+VV since HH has intrinsic problem in distinguishing stand ages in maturing stages.
In , overall accuracy for each single, dual and fully polarimetric dataset is presented. As expected, multiple polarimetric data consistently produced uppermost accuracy, either using RF or SVM. Individually, cross-polarization was able to produce a comparable result to those of dual and multi-polarization datasets. This research suggested that although single polarimetric may no longer be a focus for classification problem, it may be exploited to some extent. As indicated in , dual like-polarization (HH+VV) did not perform well in comparison to any options involving cross-polarization (HV). Dual polarization HV+VV provided highest accuracy in dual polarization group, comparable to fully polarimetric data.
Table 2. Overall classification accuracy. Bold typeface indicates a better accuracy among classifier results.
also suggests that there are insignificant deviations in overall accuracy between two contemporary classifiers, although there is one occasion that RF surpassed SVM significantly. Over 7 tests using different datasets, 4 winning vote went to SVM. This result is similar to a previous report by Nitze et al. [Citation2012] where majority votes were gained by SVM.
As shown in , accuracy for each designated class varies since overlaps clearly exist between stand age classes, which in turn leading to lower individual class accuracy. Details on individual class-based accuracy are presented in . It summarizes that imbalance in accuracy was present. Three years old rubber stands were severely confused with 4 years stands. By evaluating field data, this is clearly understood since both young juvenile classes have relatively open canopy, with strong influence of soil background. Both dual and multi polarization backscatter data were unable to fully resolve the discrimination. Availability of all linearly polarized data, however, gave a slightly better accuracy to distinguish these classes. Young juvenile classes (3 – 4 years old) were completely separable to either older juvenile (5 – 6 years) or mature (7 – 8 years) stands. Separation between older juvenile stages was fairly successful to both dual and fully polarimetric data. Nonetheless, confusion again occurred within mature stands. Higher deviation indicates widespread imbalance in overall accuracy between classes, which should be avoided in classification or mapping. The research indicated that fully polarimetric SAR data produced an improved class accuracy, although the overall accuracy is fairly comparable to the one provided by dual polarization HV+VV.
Table 3. Percentage of correctly-classified stand age computed from two best datasets.
At this stage, backscatter data classified using default RF and SVM parameter gave a slightly poor overall accuracy. In the following sections, amendment of dataset through derivation of textural features and finding proper parameter settings for each classifier are discussed as an effort to improve the overall accuracy.
The role of texture
Texture has often been used as an additional data to enhance overall accuracy. Taking an example in French temperate pine plantation, Champion et al. [Citation2008] showed that fully-polarimetric data combined with texture delivered significant detection of stand age. For mapping purpose, coupled backscatter-texture dataset was examined in land cover classification [Kourgli et al., Citation2012].
presents the degree of accuracy improvement based on single, dual and full polarization using RF and SVM default parameters used by OTB. In general, almost all polarization reacted positively to the addition of texture features. Only two cases, each associated with RF and SVM however, gave a slight decrease in overall accuracy. Those were related to HH polarization, perhaps because of its inherent limitation to distinguish mature classes as shown in the previous section. – indicate that almost every class responded well to the inclusion of textural information. It is observable that coupled textural features and backscatter data were able to elevate individual class accuracy especially in maturing stands. By comparing and , positive trends were shown by RF outweighing SVM at this case; where up to 30% improvement was gained in older juvenile rubber (ages 5 – 6). In mature stands (7 – 8 years old), up to 23% enhancement of accuracy was shown. While SVM has gained major votes in the preceding discussion, it is clear that RF surpassed SVM capability when additional information was embedded into the original dataset.
Figure 5. Improvement of overall accuracy by adding all GLCM texture features.
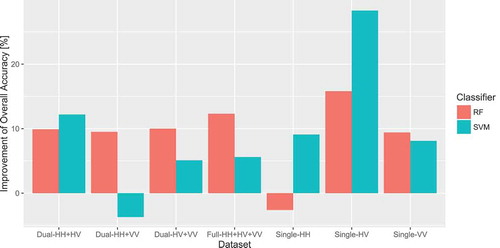
Table 4. Individual class accuracy using texture-enriched data.
In few cases, however, all classifiers did not return a significant improvement, for instance in almost all cases in 4 years old stands. It appears that separating 4 years old rubber stands remains problematic and therefore warrants a future investigation. While this research indicated that RF was favorable in terms of individual class accuracy, it should be noted that disagreement to select a better classifier between RF and SVM exists in the literature [Gong et al., Citation2013; Adam et al., Citation2014; Lawrence and Moran, Citation2015]. This may be sourced from various causes, including site-specific condition, datasets used, selection of targeted class, etc.
Analysis of variable importance was conducted using MARS and RF modules to investigate robust parts of GLCM texture features. indicates that several features of GLCM may be useful for classification. In addition to backscatter coefficient, only MEA and VAR were considered important to classification in a consistent way.
Figure 6. Feature importance of backscatter coefficient and texture features detected by MARS and RF approaches.
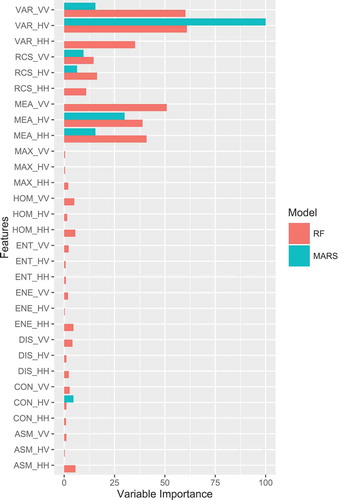
When subsets of the data (backscatter coefficients and MEA and VAR texture features) were re-classified using default parameters of RF and SVM, the improvement of the overall accuracy was fairly significant. In the case of dual polarimetric HV+VV, backscatter-based classification obtained only 64.0% accuracy, while adding all GLCM texture features gave 74.0% accuracy with RF classifier and 71.7% using SVM. With addition only a subset of texture features (MEA and VAR), the overall accuracy of backscatter coefficient inclined to 79.7% and 75.6% using RF and SVM respectively. The improvement indicates that selecting only robust variables holds a key importance in successful classification procedure or mapping. It comes into view that classifiers were substantially confused with large inputs. Reducing variables also speeds up the computation; hence it is beneficial for large tasks. It should be noted, however, that improvement was insignificant in the case of fully polarimetric data. Reduced texture dataset only produced about 1% improvement over combined backscatter coefficients and whole GLCM dataset when SVM was applied. RF, in the other hand, provided a negative impact. The classifier produced only 72.7% accuracy.
Simple texture features such as demonstrated in this research are beneficial in terms of computation. They were also selected as robust descriptors in previous research [Ma et al., Citation2009; Schmidt et al., Citation2010; Liu et al., Citation2015]. A previous study indicated that robustness of single texture feature was unable to be maintained in single date dual polarization data with various tone-texture combination [Attarchi and Gloaguen, Citation2014]. This warrants that detailed investigations on textural properties are required, which may be linked to issues such as the complexity of landscape and pixel resolution used in the research.
Tuning classification parameters
Although contemporary classification approaches have been successfully implemented in many applications, their utilization requires substantial knowledge about parameters settings. Unfortunately, there has been a paucity of publication serving as a guide to select proper parameters. In many occasions, one has made decision by using default values set by specific software, or preferably using several trials to seek proper parameters.
This research showed that linear SVM kernel delivered a better overall accuracy than widely-used RBF (Gaussian) kernel, with an accuracy gap about 20%. This finding suggested that if linear kernel was sufficiently obtained, further attempts to use non-linear kernels may cause a drawback. This argument is also supported by Hsu et al. [Citation2010] which recommended initial evaluation using linear kernel. If the overall accuracy is found reliable, then cost parameter can be further adjusted. A reason for the sufficiency of linear kernel is maybe due to adequately large predictor for designated class targets. Hence, it was unnecessary for SVM algorithm to map to an even higher dimensional feature space before actual classification. The use of linear kernel is also efficient in computation since it requires a lesser time to produce the results. Highest overall accuracy achieved by linear kernel was 66% (at C=4), with only 2% accuracy reduction obtained by the default (C=1). Similar to the case of backscatter coefficient data, tuning cost parameter did not improve significantly on a combined texture and backscatter coefficient data. The highest overall accuracy was provided by SVM linear kernel with C=1 (the default, 76.3%), with only about 3% deviations to the lowest.
On backscatter coefficient data, RF appeared irresponsive to tuning. In the case of tuning ntree parameter, highest overall accuracy was 64.1%, achieved at ntree = 500. This level of accuracy was fairly insignificant to the default value (ntree = 100) which produced an accuracy of 63.8%. Trials with other values gave similar results. Testing variations of maxdepth value was also found trivial, with only about 2% gaps from the highest (76% on maxdepth = 10). This was also the case of mtry parameter, where mtry equivalent to squared root of number of variables was found optimal, with accuracy around 63.8%, similar to mtry = 1.
Results of tuning RF parameters on texture-combined data did not vary much, similar to an experiment on backscatter data. This suggests that default RF values used by OTB has been fairly optimal for implementation without further tuning experiment, except on mtry. If mtry was set according to the default (squared root of number of predictor, in texture-coupled backscatter equals to ~4.5), the accuracy was about 73.7%. In this research, optimal mtry was 2, with the overall accuracy of 80.9%.
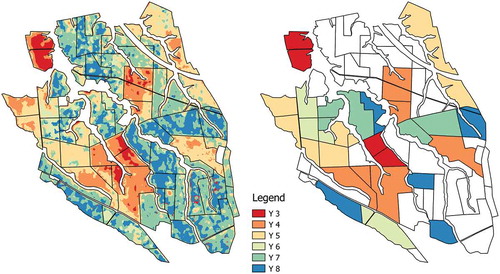
presents stand age map with the finest accuracy using aforementioned tuning parameters. The map shows that year 3 class was identified with high degree of confidence. Nonetheless, mixed results were evident in year 4 and 5. Similarly, years 6 – 8 were also confused. Although the statistics were not fairly robust, it should be noted, however, that the degree of similarity between each tree within the same block (age) can be impartially low. This is due to various sources including local soil characteristics, competition to light, individual tree-growth factor and canopy gaps due to lightning strikes or diseases.
Figure 7. Stand age map derived from RF model in comparison to stand information.
Unfortunately, due to limited number of publication specifically dealing with the role of tuning, this result could not be directly linked to the others in order to make a conclusive summary on the best practice of using modern classifiers. In the future, similar tests should be replicated to give a better outline on the importance of tuning RF and SVM parameters.
Conclusion
Along with tropical forests, there has been a growing interest to assess TOF as an improved dataset for global change studies. While remotely-sensed imageries have been used for TOF study to some extent, paucity of similar research using SAR data is evident. Mentioning advantageous characteristics over multi-spectral data in tropical areas, this research presented a demonstration of usability of fully polarimetric SAR data in order to distinguish stand age of rubber plantation.
This research indicated that stand age mapping can only be applicable within the first 10 years, far below the rubber planting cycle of 30 – 35 years. After this level, L-band waves at all possible linear polarizations were saturated. Although the limitation is evident, capability to distinguish stand age in the first 10 years is crucial for plantation management to make a better growth projection and yield estimation. This research showed that complete backscatter coefficients were favorable, not only to achieve a substantial overall accuracy but also to provide a more balanced individual class accuracy. Highest overall accuracies were obtained using SVM on fully polarimetric and dual polarimetric HV+VV datasets. In terms of accuracy balance between classes, SVM almost consistently surpassed RF. The difference in overall accuracy between dual polarization HV+VV and fully polarimetric was low, suggesting dual polarization has an opportunity in operational basis. Nonetheless, it should be noted that despite this insignificant deviation, fully polarimetric data delivered a more reliable balance in terms of individual class accuracies.
Adding texture was shown substantial to increase overall accuracy with an average of 10%, except on some minor cases. In the case of datasets with highest overall accuracies, adding textural data gave a more significant impact on RF than SVM. It should also be noted that single polarization HV, when adjoined with texture on SVM, produced significant rise in overall accuracy. Experiments on parameter tuning did not deliver much variation in overall accuracy, i.e. only about 2 – 3 % rises.
While this research provided an update for previous research by exploiting backscatter coefficient in full polarimetric states, paucity of recent studies on the use of polarimetric SAR data inhibited complete understanding on the ability of SAR data for rubber plantation monitoring. Similar study, applied to different geographical location and terrain, should be taken to further examine applicability of L-band SAR data to provide additional information in TOF areas. The future studies should also consider various tuning parameters to enhance current understanding on the role of those parameters in developing a better classification result.
Acknowledgements
The author would like to thank Japan Aerospace Exploration Agency (JAXA) for ALOS-2 data provision through RA4-1029 and RA6-3004 projects, and to the University of New South Wales, Australia through UIPA scholarship for financial support. Additional support during the research from Drs. D. Paull, X. Jia and A. Griffin (UNSW Canberra) is greatly acknowledged. The author also thanks Dyah Panuju for her help during field work and some suggestions on data analysis. Finally, Ir. H. Dinni (estate manager) and Ir. M. Helmi (chief of plantation division) of Jalupang estate were thanked for their permission and fruitful discussion during the survey.
References
- Adam E., Mutanga O., Odindi J., Abdel-Rahman E. M. (2014) - Land-use/cover classification in a heterogeneous coastal landscape using RapidEye imagery: evaluating the performance of random forest and support vector machines classifiers. International Journal of Remote Sensing, 35 (10): 3440–3458. doi: 10.1080/01431161.2014.903435
- Attarchi S., Gloaguen R. (2014) - Improving the estimation of above ground biomass using dual polarimetric PALSAR and ETM+ data in the Hyrcanian mountain forest (Iran). Remote Sensing, 6 (5): 3693–3715. doi: 10.3390/rs6053693.
- Avtar R., Takeuchi W., Sawada H. (2011) - Assessment of cashew and rubber plants biophysical parameters based on ALOS/PALSAR data. Seisan Kenkyu, 63: 443–446. doi:10.11188/seisankenkyu.63.443.
- Bagan H., Kinoshita T., Yamagata Y. (2012) - Combination of AVNIR-2, PALSAR, and polarimetric parameters for land cover classification. IEEE Transactions on Geoscience and Remote Sensing, 50 (4): 1318–1328. doi:10.1109/TGRS.2011.2164806.
- Breiman L. (2001) - Random Forests. Machine Learning, 45 (1): 5–32. doi:10.1023/A:1010933404324.
- Chabrier S., Stoll B., Goujon J. B. (2012) - SVM texture classification for tropical vegetation mapping. Proceedings SPIE 8527, Multispectral, Hyperspectral, and Ultraspectral Remote Sensing Technology, Techniques and Applications IV, Kyoto, Japan, 29 October 2012, 8527: 85270E. doi:10.1117/12.977182.
- Champion I., Dubois-Fernandez P., Guyon D., Cottrel M. (2008) - Radar image texture as a function of forest stand age. International Journal of Remote Sensing, 29 (6): 1795–1800. doi:10.1080/01431160701730128.
- Chang C-C., Lin C-J. (2011) - LIBSVM: a library for support vector machines. ACM Transactions on Intelligent Systems and Technology, 2 (3): 27: 1-27:27. doi:10.1145/1961189.1961199
- Clewley D., Whitcomb J., Moghaddam M., McDonald K., Chapman B., Bunting P. (2015) - Evaluation of ALOS PALSAR data for high-resolution mapping of vegetated wetlands in Alaska. Remote Sensing, 7 (6): 7272–7297. doi:10.3390/rs70607272.
- Englhardt S., Keuck V., Siegert F. (2011) - Aboveground biomass retrieval in tropical forests — The potential of combined X- and L-band SAR data use. Remote Sensing of Environment, 115 (5): 1260–1271. doi: 10.1016/j.rse.2011.01.008.
- Fontanelli G., Paloscia S., Pampaloni P, Pettinato S, Santi E, Montomoli F, Brogioni M, Macelloni G. (2013) – HydroCosmo: the monitoring of hydrological parameters on agricultural areas by using Cosmo-Skymed images. European Journal of Remote Sensing, 46: 875–889. doi: 10.5721/EuJRS20134652
- Foody G. M., Mathur A. (2004) - A relative evaluation of multiclass image classification by support vector machines. IEEE Transactions on Geoscience and Remote Sensing, 42 (6): 1335–1343. doi:10.1109/TGRS.2004.827257.
- Friedman J. H. (1991) - Multivariate Adaptive Regression Splines. The Annals of Statistics, 19 (1): 1–67. doi: 10.1214/aos/1176347963.
- Gong P., Wang J., Yu L., Zhao Y., Zhao Y., Liang L., Niu Z., Huang X., Fu H., Liu S., Li C., Li X., Fu W., Liu C., Xu Y., Wang X., Cheng Q., Hu L., Yao W., Zhang H., Zhu P., Zhao Z., Zhang H., Zheng Y., Ji L., Zhang Y., Chen H., Yan A., Guo J., Yu L., Wang L., Liu X., Shi T., Zhu M., Chen Y., Yang G., Tang P., Xu B., Giri C., Clinton N., Zhu Z., Chen J., Chen J. (2013) - Finer resolution observation and monitoring of global land cover: first mapping results with Landsat TM and ETM+ data. International Journal of Remote Sensing, 34 (7): 2607–2654. doi: 10.1080/01431161.2012.748992.
- Hamdan O., Khali Aziz H., Abd Rahman K. (2011) - Remotely sensed L-band SAR data for tropical forest biomass estimation. Journal of Tropical Forest Science, 23(3),318–327.
- Haralick R. M., Shanmugam K., Dinstein I. (1973) - Textural features for image classification. IEEE Transactions on Systems, Man and Cybernetics, SMC-3 (6): 610-621. doi:10.1109/TSMC.1973.4309314.
- J. He, J.R. Harris, M. Sawada & P. Behnia. (2015) - A comparison of classification algorithms using Landsat-7 and Landsat-8 data for mapping lithology in Canada’s Arctic. International Journal of Remote Sensing, 36 (8): 2252–2276. doi: 10.1080/01431161.2015.1035410
- Ho Tong Minh D., Le Toan T., Rocca F., Tebaldini S., D’Alessandro M. M., Villard L. (2014) - Relating P-band synthetic aperture radar tomography to tropical forest biomass. IEEE Transactions on Geoscience and Remote Sensing, 52 (2): 967–979. doi:10.1109/TGRS.2013.2246170.
- Hsu C.-W., Chang C.-C., Lin C.-J. (2010) - A practical guide to Support Vector Machine. National Taiwan University, Taiwan.
- Huang C., Davis L. S., Townshend J. R. G. (2002) - An assessment of support vector machines for land cover classification. International Journal of Remote Sensing, 23 (4): 725–749. doi:10.1080/01431160110040323.
- Imhoff M. L. (1995) - Radar backscatter and biomass saturation: ramifications for global biomass inventory. IEEE Transactions on Geoscience and Remote Sensing, 33 (2): 511–518. doi:10.1109/36.377953.
- Jebur M. N., Pradhan B., Tehrany M. S. (2015) - Using ALOS PALSAR derived high-resolution DInSAR to detect slow-moving landslides in tropical forest: Cameron Highlands, Malaysia. Geomatics, Natural Hazards and Risk. 6 (8): 741–759. doi: 10.1080/19475705.2013.860407
- Karam M. A., Amar F., Fung A. K., Mougin E., Lopes A., Le Vine D. M., Beaudoin A. (1995) - A microwave polarimetric scattering model for forest canopies based on vector radiative transfer theory. Remote Sensing of Environment, 53 (1): 16–30. doi:10.1016/0034-4257(95)00048-6.
- Kobayashi S., Omura Y., Sanga-Ngoie K., Widyorini R., Kawai S., Supriadi B., Yamaguchi Y. (2012) - Characteristics of decomposition powers of L-band multi-polarimetric SAR in assessing tree growth of industrial plantation forests in the tropics. Remote Sensing, 4(10): 3058–3077. doi:10.3390/rs4103058
- Kobayashi S., Omura Y., Sanga-Ngoie K., Yamaguchi Y., Widyorini R., Fujita M. S., Supriadi B., Kawai S. (2015) - Yearly variation of acacia plantation forests obtained by polarimetric analysis of ALOS PALSAR data. IEEE Journal of Selected Topics in Applied Earth Observations and Remote Sensing, 8 (11): 5294–5304. doi: 10.1109/JSTARS.2015.2487503.
- Kourgli A., Ouarzeddine M., Oukil Y., Belhadj-Aissa A. (2012) - Texture modelling for land cover classification of fully polarimetric SAR images. International Journal of Image and Data Fusion, 3 (2): 129–148. doi:10.1080/19479832.2010.551521.
- Laurin G. V., Liesenberg V., Chen Q., Guerriero L., Del Frate F., Bartolini A., Coomes D., Wilebore B., Lindsell J., Valentini R. (2013) - Optical and SAR sensor synergies for forest and land cover mapping in a tropical site in West Africa. International Journal of Applied Earth Observation and Geoinformation, 21: 7–16. doi: 10.1016/j.jag.2012.08.002.
- Lawrence R. L., Moran C. J. (2015) - The AmericaView classification methods accuracy comparison project: A rigorous approach for model selection. Remote Sensing of Environment, 170: 115–120. doi: 10.1016/j.rse.2015.09.008.
- Liu H., Guo H., Zhang L. (2015) – SVM-based sea ice classification using textural features and concentration from RADARSAT-2 dual-pol ScanSAR data. IEEE Journal of Selected Topics in Applied Earth Observations and Remote Sensing, 8 (4):1601–1613. doi: 10.1109/JSTARS.2014.2365215.
- Longépé N., Rakwatin P., Isoguchi O., Shimada M., Uryu Y., Yulianto K. (2011) - Assessment of ALOS PALSAR 50 m orthorectified FBD data for regional land cover classification by Support Vector Machines. IEEE Transactions on Geoscience and Remote Sensing, 49 (6): 2135–2150. doi:10.1109/TGRS.2010.2102041.
- Löw F., Conrad C., Michel U. (2015) - Decision fusion and non-parametric classifiers for land use mapping using multi-temporal RapidEye data. ISPRS Journal of Photogrammetry and Remote Sensing, 108: 191–204. doi: 10.1016/j.isprsjprs.2015.07.001.
- Ma L., Li Y., Zhang B., Liu Y., Gao C., Yu S. (2009) – Research on oil spill identification based on texture features – a case study of Hebei Spirit accident. Proceedings of International Geoscience and Remote Sensing Symposium, 3:377–380. doi: 10.1109/IGARSS.2009.5417781.
- Morel A. C., Saatchi S. S., Malhi Y., Berry N. J., Banin L., Burslem D., Nilus R., Ong, R. C. (2011) - Estimating aboveground biomass in forest and oil palm plantation in Sabah, Malaysian Borneo using ALOS PALSAR data. Forest Ecology and Management, 262 (9): 1786–1798.
- Mougin E., Proisy C., Marty G., Fromard F., Puig H., Betoulle J. L., Rudant J. P. (1999) - Multifrequency and multipolarization radar backscattering from mangrove forests. IEEE Transactions on Geoscience and Remote Sensing, 37 (1 PART 1): 94–102. doi:10.1109/36.739128.
- Naidoo L., Mathieu R., Main R., Kleynhans W., Wessels K., Asner G. P., Leblon B. (2014) - The assessment of data mining algorithms for modelling Savannah Woody cover using multi-frequency (X-, C- and L-band) synthetic aperture radar (SAR) datasets. Proceedings of International Geoscience and Remote Sensing Symposium (IGARSS), Quebec City, Canada, 13-18 July 2014: 1049–1052. doi:10.1109/IGARSS.2014.6946608.
- Nitze I., Schulthess U., Asche H. (2012) - Comparison of machine learning algorithms Random Forest, Artificial Neural Networks and Support Vector Machine to Maximum Likelihood for supervised crop type classification. Proceedings GEOBIA 4, Rio de Janeiro, Brazil, 7-9 May 2012: 35–40.
- Pal M., Mather P. M. (2005) - Support vector machines for classification in remote sensing. International Journal of Remote Sensing, 26 (5): 1007–1011. doi:10.1080/01431160512331314083.
- Reiche J., Souza C. M.; Hoekman D. H., Verbesselt J., Persaud H., Herold M. (2013) - Feature level fusion of multi-temporal ALOS PALSAR and Landsat data for mapping and monitoring of tropical deforestation and forest degradation. IEEE Journal of Selected Topics in Applied Earth Observations and Remote Sensing, 6 (5): 2159–2173. doi: 10.1109/JSTARS.2013.2245101.
- Rodriguez-Galiano V. F., Chica-Rivas M. (2014) - Evaluation of different machine learning methods for land cover mapping of a Mediterranean area using multi-seasonal Landsat images and Digital Terrain Models. International Journal of Digital Earth, 7 (6): 492–509. doi: 10.1080/17538947.2012.748848.
- Rosenqvist A. (1996) - Evaluation of JERS-1, ERS-1 and Almaz SAR backscatter for rubber and oil palm stands in West Malaysia. International Journal of Remote Sensing, 17 (16): 3219–3231. doi:10.1080/01431169608949140.
- Rossi J-P., Rousselet J. (2016) - The spatial distribution of trees outside forests in a large open-field region and its potential impact on habitat connectivity for forest insects. Turkish Journal of Forestry, 17: 62-64. doi: 10.18182/tjf.28744
- Sarker M. L. R., Nichol J., Iz H. B., Ahmad B. B., Rahman A. A. (2013) - Forest biomass estimation using texture measurements of high-resolution dual-polarization C-band SAR data. IEEE Transactions on Geoscience and Remote Sensing, 51 (6): 3371–3384. doi:10.1109/TGRS.2012.2219872.
- Schmidt M., Esch T., Klein D., Thiel M., Dech S. (2010) – Estimation of building density using TerraSAR-X data. Proceedings of International Geoscience and Remote Sensing Symposium, 1936–1939. doi: 10.1109/IGARSS.2010.5649543.
- Schnell S. (2015) - Integrating trees outside forests into national forest inventories. Dissertation, Swedish University of Agricultural Sciences. ISBN 978-91-576-8272-7.
- Seidel D., Busch G., Krause B., Bade C., Fessel C., Kleinn C. (2015) - Quantification of Biomass Production Potentials from Trees Outside Forests—A Case Study from Central Germany. BioEnergy Research, 8 (3): 1344–1351. doi: 10.1007/s12155-015-9596-z.
- Sonobe R., Tani H., Wang X., Kobayashi N., Shimamura H. (2014) - Parameter tuning in the support vector machine and random forest and their performances in cross- and same-year crop classification using TerraSAR-X. International Journal of Remote Sensing, 35 (23): 7898–7909. doi:10.1080/01431161.2014.978038.
- Thapa R. B., Itoh T., Shimada M., Watanabe M., Takeshi M., Shiraishi T. (2014) - Evaluation of ALOS PALSAR sensitivity for characterizing natural forest cover in wider tropical areas. Remote Sensing of Environment, 155: 32–41. doi: 10.1016/j.rse.2013.04.025
- Trisasongko B. H. (2015) - Evaluating compact SAR polarimetry for tropical forest monitoring. Proceedings of International Seminar on Photonics, Optics and its Applications, Denpasar, Indonesia, 14-15 October 2014 (Vol. 9444). doi:10.1117/12.2075177.
- Trisasongko B. H., Paull D. J., Panuju D. R. (2015) - Interferometric processing of C-band SAR data for the improvement of stand age estimation in rubber plantation. Proceedings of International Seminar on Photonics, Optics and its Applications, Denpasar, 14-15 October 2014 (Vol. 9444). doi:10.1117/12.2074773.
- Vapnik V. N. (2000) - The nature of statistical learning theory (Second edition ed.). Springer Verlag, New York.