
ABSTRACT
Fuel moisture content (FMC) is a critical parameter in fire behavior prediction. Although remote sensing is an efficient way to estimate the spatial and temporal variations of FMC, most of the existing spectral indices are oriented to live fuels. Estimation of dead fuels is commonly done using weather indices instead. In this study, dehydration experiments were designed for both live and dead fallen litter leaves in order to determine the best hyperspectral indices for different fuel types by tracking the time-varying water contents of both fuel materials. The identified best index for FMC including both fuel types was a derivative spectra-based normalized index (dND) of dND(1900, 2095) with an R2 of 0.85 and an RMSE of 32%. Estimation of FMC in both fuel types were well separated by normalizing dND(1900, 2095) combined with NDVI ((dND-NDVI)/(dND+NDVI)). In addition, new indices were also identified for practical large scale applications when atmospheric water vapor absorption must be taken into account. All the recommend indices should be validated with more plant species in the future.
1. Introduction
Fuel moisture content (FMC) has an overwhelming importance in understanding different eco-physiological processes and wildfire behavior prediction among all the forest fuel properties as it significantly affects wildfire ignition and propagation and CO2 emission from the combustion of organic materials [Rothermel, Citation1972; Viegas et al., Citation1992; Chuvieco et al., Citation2004a; van der Werf et al., Citation2004; Yebra et al., Citation2008; Yebra et al., Citation2013]. FMC can be categorized into two different components based on fuel type: the water content in dead fuels, which are most easily to ignite (e.g. dry leaves, litter and fallen branches), and that in live fuels (e.g. live leaves).
Direct measurements of FMC are severely limited by the available reliable data obtained from field sampling, particularly for large areas where such sampling is generally not feasible. Thus, FMC in dead fuels has often been computed by models associated with meteorological variables over the past several decades, because it is mainly controlled by changes in atmospheric conditions [Viney, Citation1991; Viegas et al., Citation2001; Camia et al., Citation2003; Aguado et al., Citation2007; Nieto et al., Citation2010]. However, meteorological indices are not satisfactory for estimating FMC in live fuels due to the complex water-use strategies of live plants, which are regulated by plant physiological processes, e.g. water loss by leaf transpiration and water uptake by roots, although certain relationships between live FMC and meteorological data have been noted for some specific species [Carlson and Burgan, Citation2003; Dimitrakopoulos and Bemmerzouk, Citation2003]. In addition, hardly any meteorological data may be obtained from sparse regions where no meteorological stations are available. Hence, there is a great need for an alternative approach that can provide temporal and spatial information on FMC.
Remote sensing approaches, which provide spectral information on plant water and dry matter content on multiple scales, may overcome some of the above mentioned challenges [Tucker, Citation1980; Hunt et al., Citation1987; Wang et al., Citation2011; Wang et al., Citation2011b; Zarco-Tejada et al., Citation2003; Yebra et al., Citation2013]. Currently, equivalent water thickness (EWT) is a commonly estimated water status parameter, since it is directly related to leaf absorption [Jacquemoud and Baret, Citation1990; Jacquemoud et al., Citation1996; Jacquemoud et al., Citation2009; Ceccato et al., Citation2001; Ceccato et al., Citation2002a; Ceccato et al., Citation2002b]. While FMC can be linked to EWT via leaf dry mass area (LMA), in contrast to the popularly retrieved EWT, estimating FMC is proving to be more difficult due to the masking effect of leaf water content on dry matter, which makes it hard to effectively distinguish the spectral information of leaf dry matter from leaf water content [Riaño et al., Citation2005; Romero et al., Citation2012; Wang et al., Citation2012; Yebra et al., Citation2013].
Even so, a number of studies have attempted to retrieve FMC using reflected spectra. These studies mainly focus on three aspects, as follows: 1) empirical methods based on spectral indices that are physically related with leaf water content or dry matter content (several indices are listed in ) [Dennison et al., Citation2005; Roberts et al., Citation2006; Wang and Li, Citation2012; Wang et al., Citation2012]; 2) combining meteorological data and spectral data to estimate FMC [Chuvieco et al., Citation2004b; Chuvieco et al., Citation2004c; García et al., Citation2008; Nieto et al., Citation2010]; 3) generalizing from simulated datasets because EWT and LMA are two important input parameters for commonly used leaf and canopy radiative transfer models (e.g. PROSPECT and SAIL) [Bowyer and Danson, Citation2004; Danson and Bowyer, Citation2004; Riaño et al., Citation2005; Yebra and Chuvieco, Citation2009; Wang and Li, Citation2012]. Although inverse retrieval from radiative transfer models is a mechanism-based approach, challenges still exist and might be even greater than for empirical methods since the approach not only requires plant physiological and structural inputs that are frequently unavailable in nature but also faces a serious ill-posed problem [Bowyer and Danson, Citation2004; Yebra and Chuvieco, Citation2009; Li and Wang, Citation2011; Yebra et al., Citation2013]. On the contrary, the spectral index approach is a rapid and simple way to estimate FMC. Its estimation accuracy may further be improved if indices are made up of bands whose absorption features are sensitive to EWT and LMA and insensitive to background effects [Dennison et al., Citation2005; Roberts et al., Citation2006; Wang and Li, Citation2012; Wang et al., Citation2012]
Table 1. Published spectral indices for plant water and dry matter.
However, most of the previous studies were always oriented toward live FMC with only water indices or dry matter indices from satellite data, like NOAA-AVHRR and Terra/Aqua MODIS [Yebra et al., Citation2008; Yebra et al., Citation2013]. For instance, Dennison et al. [Citation2005] estimated live FMC using NDVI and NDWI from MODIS reflectance data, while Roberts et al. [Citation2006] used WI and NDWI from AVIRIS and MODIS data. Furthermore, Chuvieco et al. [Citation2004c] combined NDVI and surface temperature to estimate live FMC with NOAA-AVHRR data. Although empirical relationships were found between live FMC and these selected indices, the spectral information of dry matter remains unclear.
Riaño et al. [Citation2005] suggested that measurements of dry leaf samples were necessary to accurately estimate FMC because dry matter can only be accurately estimated when leaf material is dry. Leaf dehydration processes can clearly track the changes of leaf state transition from the fresh live situation to the dry dead situation, with leaf reflectance increasing significantly in the domain from 400 to 2500 nm [Carter, Citation1991; Foley et al., Citation2006; Seelig et al., Citation2008], which may simultaneously provide more spectral details about leaf water and dry matter. Wang et al. [Citation2012] demonstrated that NDII/NDMI was significantly correlated with FMC based on the hypothesis that FMC could be estimated by the indices combining the water index and the dry matter index calculated from hyperspectral data using both fresh and drying green leaves. However, the wavelengths in both the numerator and the denominator of NDII/NDMI are not only affected by water or dry matter content as hypothesized by the authors [Wang et al., Citation2012]. Moreover, most existing indices for estimating FMC are usually based on original reflectance, but few studies have ever concentrated on the first derivative spectra, which provide more information on key spectral locations since it can eliminate other background noises, such as the red edge and water absorption peaks [Horler et al., Citation1983; Filella and Penuelas, Citation1994]. Furthermore, there is only a little knowledge about the estimation of FMC for dead fuel types such as litter using spectral indices, although usually being masked by overstory vegetation, the widespread drought-induced tree mortality has leaded to much higher exposure rate of litter on the regional scale. Therefore, new types of spectral indices suitable for separate estimation of different fuels’ FMCs are expected.
The objectives of this study were: 1) to compare the variations of leaf reflectance and first derivative spectra in two different fuel types during dehydration processes: green live leaves and litter fallen from different broadleaved species in the temperate climate zone; 2) to validate existing spectral indices for estimating the FMC of both green live and fallen litter fuels; and 3) to determine the best hyperspectral indices for FMC based on different types of indices with an attempt to separate FMC estimation in the two fuel materials.
2. Materials and methods
2.1. Leaf dehydration and fallen litter leaf refreshing experiments
Two fuel materials, green live leaves and fallen litter leaves, were used for the leaf dehydration experiment and litter leaf refreshing experiment, respectively. Green leaves of five deciduous species were collected, namely Zelkova serrata (Thunb.) Makino, Idesia polycarpa Maxim., Liquidambar styraciflua L., and Cerasus x yedoensis (Matsum.) A.V.Vassil. ‘Somei-yoshino’ from the campus of Shizuoka University and Fagus crenata Blume from Mount Naeba, Japan. All branches with target green leaf samples were first cut pre-dawn and then re-cut under water, which can make the measurements of leaf reflectance accurate and reliable under non-in-situ conditions [Richardson and Berlyn, Citation2002; Foley et al., Citation2006]. After that, all samples were covered by plastic bags and quickly transported to the laboratory. The samples were stored under high humidity, dim light, and cool temperatures before reflectance measurements were taken. Four to five green mature leaves for each species, making a total of 24 samples, were used for the next experiments. Five fallen litter leaf samples of each of the same species, with no broken holes on the surface, making a total of 25 samples, were collected as well. The colors of all litter samples were brown and there were no visible indications for the presence of leaf chlorophyll.
Leaf mass was measured with an electronic balance and leaf areas were obtained using a scanner. Spectral reflectance (350–2500 nm) was measured with a field spectroradiometer (ASD FR, USA) equipped with a leaf clip, in which a light source of a tungsten quartz halogen lamp was embedded. The spectral resolution was 3 nm at 700 nm and 30 nm at both 1400 nm and 2100 nm. A white reference scan was made for the calibration before taking the reflectance measurement in the leaf clip with matched openings for non-destructive contact measurements.
Reflected spectra of green leaf samples were measured after samples were taken back to the laboratory. Then, the leaves were cut with scissors and leaf masses were measured immediately. After that, the leaves were placed on an experimental bench for dehydration, and leaf reflectance and masses were measured synchronously at progressive time intervals of 30 min, 1 h, 2h, 4h and 6h during the entire dehydration period until the leaf sample was air-dried to a stable weight. Finally, the air-dried samples were oven-dried at 70°C for 72 h and then weighed again. A total of 224 measurements were made for 24 green leaves.
All fallen litter leaf samples were first soaked in water for 48 hours at 20°C to refresh them and to ensure there was sufficient water in the samples for dehydration. Then, water on the sample surface was wiped off and all samples were placed on an experimental bench for dehydration. Leaf reflectance and mass were measured synchronously at progressive time intervals of 10 min, 30 min, 1 h, and 2 h until all samples were air-dried. Finally, air-dried samples were oven-dried at 70°C for 72 h and then reweighed. The total number of measurements was 299 for all 25 litter samples.
2.2. Calculation of FMC and reported spectral indices for FMC estimation
FMC is normally expressed by the ratio of the leaf water content to the leaf dry weight:
where Wf was the leaf mass during the dehydration processes for green leaf and fallen litter samples. Wd and A were the leaf dry mass, and leaf area, respectively.
A wide range of spectral indices for estimating plant water and dry matter content have been devised based on different combinations of wavelengths. Among them, five water indices [WI, SR(1300, 1450), SRWI, NDWI, and NDII] [Hardisky et al., Citation1983; Peñuelas et al., Citation1993; Gao, Citation1996; Zarco-Tejada et al., Citation2003; Seelig et al., Citation2008], four dry matter indices [NDMI, ND(2309, 1495), LCA, and CAI] [Nagler et al., Citation2000; Daughtry et al., Citation2005; Wang et al., Citation2011b; Romero et al., Citation2012], and one ratio of water to dry matter index [Wang et al., Citation2012] were selected to test their performance in monitoring FMC during the dehydration process. The details of all selected indices are shown in .
2.3. Determination of the best indices
Four commonly used types of indices [le Maire et al., Citation2008] based on both the original reflectance and the first derivatives of reflectance were used to determine the best indices for FMC. The equations of the four types of indices for original reflectance are as follows:
where R, D, SR, and ND are the reflectance at a given single wavelength, wavelength difference, simple ratio, and normalized ratio, respectively. Rλ1 and Rλ2 are the wavelengths at λ1 and λ2, respectively. Indices based on the first derivative of reflectance are termed dR, dD, dSR, and dND, respectively. And the calculations of the indices based on the derivative spectra are analogous in their computation to the non-derivative spectral indices.
Two different datasets, the green dataset and the litter dataset, were used to determine the best hyperspectral indices for FMC estimation. The determination of indices was carried out based on linear regression between FMC and a given index which covered all possible combinations of wavelengths from 400 to 2500 nm with a wavelength interval of 5 nm. The root mean square error (RMSE) and the coefficient of determination (R2) were used as statistical criteria to evaluate the performance of published/identified indices.
3. Results
3.1. Changes of leaf reflectance during leaf dehydration
and show the changes of reflectance and first derivative of reflectance for green leaf and litter samples of each plant species attributed to progressive dehydration, respectively. The reflectance of green leaf samples generally increased in the range from 400 to 2500 nm as FMC decreased for all the studied species, particularly around the two water absorption bands of 1450 and 1940 nm (). Meanwhile, new peaks near 2000 and 2400 nm gradually appeared and differences in reflectance among species were very clearly observed from 400 to 1200 nm. The reflectance of litters showed increasing trends similar to those of green leaves, and new peaks appeared near 2000 and 2400 nm as well. The most apparent difference in reflectance between green leaves and litter samples is within the wavelength domain from 400 to 1200 nm. For instance, there were no chlorophyll absorption bands in the litter samples, and therefore the slopes around 750 nm were much steeper for green leaves than for litters, which can also be clearly noted in the corresponding wavelengths of the first derivative spectra
Figure 1. Variations in reflectance and first-derivative reflectance for green leaves of different plant species attributed to progressive dehydration within 36 hours.
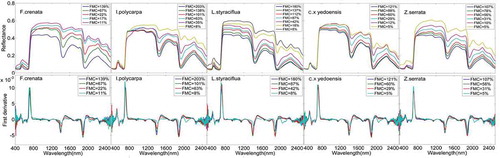
Figure 2. Variations in reflectance and first-derivative reflectance for litter leaves of different plant species attributed to progressive dehydration within 36 hours.
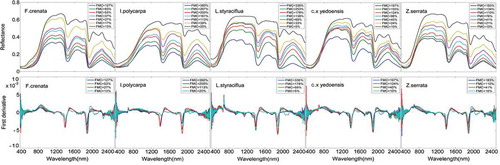
A common characteristic of the first derivative spectra for both materials was that there is a shift towards longer wavelengths on the left side edges near to water absorption troughs centered at 1450 and 1940 nm, corresponding to the decrease of FMC ( and ). Moreover, a “blue shift” in the red edge was found for green leaves. Further, the absorption troughs of the first derivative spectra near 2050–2100 nm and 2250–2300 nm were observed, in agreement with the variations of original reflectance near to both 2000 and 2400 nm.
3.2. Performance of reported indices for estimating FMC
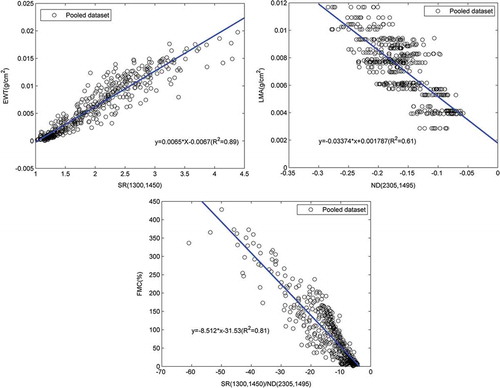
Five water indices were all significantly correlated with FMC and EWT in the green leaf dataset, but these correlations were very weak for the litter dataset, except for SR (1300, 1450), which had the highest R2 and lowest RMSE for FMC and EWT in different datasets (). There were no significant relationships between all five water indices and LMA (). In contrast to water indices, dry matter indices had smaller correlations with FMC for all datasets, and only CAI showed significant correlations with EWT, while the ND (2305, 1495) was well correlated with LMA when using different datasets. NDII/NDMI was significantly correlated with FMC and EWT in the green leaf dataset, but failed for litters, and its correlation with LMA was also insignificant (). As a result, SR (1300, 1450) was the most sensitive index to FMC and EWT but was insensitive to LMA, while ND (2305, 1495) was most sensitive to LMA but insensitive to EWT and FMC
Table 2. Published spectral indices for the estimation of FMC, EWT, and LMA based on different datasets.
3.3. Identified best indices for FMC estimation
The identified best indices based on both original reflectance and first derivative spectra for estimating FMC are presented in and . Among all selected indices of original reflectance, the ND (1630, 1680) was the best one for estimating FMC across different datasets, with an R2 of 0.79 and an RMSE of 37.69% when all datasets were pooled. The SR (1820, 1830) had similarly high values of R2, but the two wavelengths used were too close to each other given the spectra resolution. Furthermore, the performance of ND (1630, 1680) with EWT was significant as well, with an R2 of 0.78 and an RMSE of 0.0023 g/cm2. However, none of the identified indices had significant correlations with LMA
Table 3. Evaluation of four types of indices with original reflectance for FMC, EWT, and LMA.
Table 4. Evaluation of four types of indices with first derivative of reflectance for FMC, EWT, and LMA.
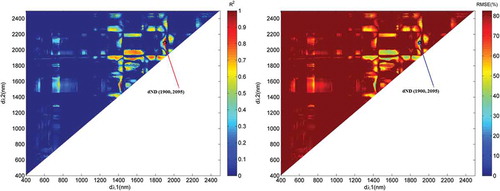
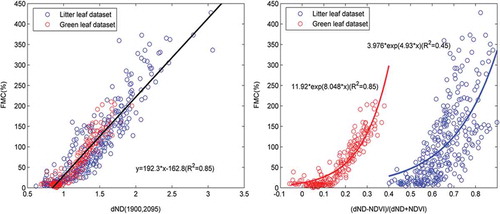
On the other hand, the best identified indices using first derivative spectra were the dND (1900, 2095) (see and ), for both green leaves and litters, with an R2 of 0.87 and an RMSE of 19.33% for the green leaf dataset and an R2 of 0.83 and an RMSE of 38.19% for litters. The overall R2 reached 0.85 when all datasets were pooled and the RMSE was 31.53%. The dND (1900, 2095) was also closely correlated with EWT but had no significant correlation with LMA. Compared with the original reflectance based indices, the first derivative spectra based dND (1900, 2095) is apparently superior to SR (1300, 1450) and ND (1630, 1680), with higher R2 and lower RMSE when estimating FMC for different datasets
Figure 3. R2 and RMSE of FMC estimation with dND type indices (pooled dataset). The positions with black circles in the figures are the selected dND (1900, 2095).
4. Discussion
4.1. FMC estimation with spectral indices
Retrieval of FMC based on spectral indices has been attempted in many former studies [Yebra et al., Citation2013]. However, those indices are usually designed based on the absorption features of leaf water or leaf dry matter only but having ignored the fact that FMC is regulated by both parameters, although several indices were found to be correlated with FMC (). Our results clearly indicated that only SR (1300, 1450) [Seelig et al., Citation2008] and CAI [Nagler et al., Citation2000] were satisfactory for estimating FMC and EWT simultaneously for both green and litter fuel types among all published indices, and both had insignificant relations with LMA (). A high R2 with EWT () but low R2 with LMA of the FMC index suggested that the leaf dry matter information in FMC was mostly suppressed by leaf water content. In addition, statistically much stronger relationships with leaf EWT than with FMC were also found by Danson and Bowyer [Citation2004] using different spectral vegetation indices.
The most likely reason for the failure of the other published indices examined may be primarily due to the big difference in the reflected spectra within the domain of 400 to 1200 nm for both fuel types ( and ). Most reported indices selected in this study used wavelengths in this domain, such as 970 nm in WI [Peñuelas et al., Citation1993] and 860 nm in NDWI [Gao, Citation1996], SRWI [Zarco-Tejada et al., Citation2003], and NDII [Hardisky et al., Citation1983]. Furthermore, these water indices were designed solely on a physical basis with leaf water content, such as 1240 nm in NDWI and SRWI and 1650 nm in NDII. Similarly, the wavelengths in NDMI [Wang et al., Citation2011b], ND (2305, 1495) [Romero et al., Citation2012], and LCA [Daughtry et al., Citation2005] were only determined by dry matter content. To solve this problem, Wang et al. [Citation2012] proposed an index ratio of NDII/NDMI for correlation with FMC, in which NDII was only correlated with leaf water content and uncorrelated with leaf dry matter content while NDMI was only correlated with leaf dry matter content and uncorrelated with leaf water content. However, the performance of NDII/NDMI for the litter dataset failed (), mainly due to the applied wavelength of 860 nm in NDII. Therefore, new types of indices need to be designed for FMC estimation for different fuels.
Leaf reflectance progressively increased and dry matter bands gradually appeared in association with the process of leaf dehydration, hence providing an opportunity to couple the spectral information of both leaf water and dry matter ( and ). These increasing trends were also observed in other plant species in response to dehydration [Carter, Citation1991; Peñuelas et al., Citation1993; Foley et al., Citation2006; Seelig et al., Citation2008]. Our results revealed that the most evident positions that appeared as a result of dry matter wavebands were near to 2100 and 2300 nm, which were similar to the dry matter bands such as cellulose, lignin, and proteins found by former studies [Romero et al., Citation2012; Cheng et al., Citation2011; Cheng et al.,Citation2012]. Most importantly, the reflectance changes from 1200 to 2500 nm of both green leaves and litter materials were similar during the entire dehydration ( and ), suggesting that FMC in both materials could be estimated by the same index in this wavelength range.
In order to identify the most sensitive combinations of different wavelengths to FMC, four common types of indices based on either original reflectance or first derivative spectra were used in the current study. The dND (1900, 2095) was determined as the best index to estimate FMC for both green leaves and litters (), and was better than all published indices examined or the best performing indices based on original reflectance (). Moreover, unlike that of SR (1300,1450), the correlation coefficient between dND (1900, 2095) and FMC was higher (R2=0.85) than that for EWT (R2=0.76), probably ue to the high relationship between the d2095 and dry matter content, which changed from positive to negative due to the appearance of dry matter bands near 2100 nm (). The variation of d1900 was largely caused by the decreasing depth of the water absorption band near 1940 nm (, , and ). Therefore, dND (1900, 2095) has accurately coupled information reflecting both leaf water and dry matter. As a comparison, other reported indices such as SR (1300, 1450) were only correlated with EWT while ND (2305, 1495) was only correlated to LMA (). The synthetic index proposed by Wang et al. [Citation2012], the ratio of SR (1300, 1450) to ND (2305, 1495), was also tested for FMC estimation. The smaller R2(=0.81) together with a larger RMSE (=35.38%) compared to those of dND(1900, 2095) for the pooled dataset () indicated that such a straightforward combination might not be the best, although both ratios were the best for individual parameters
Figure 4. Variations in first derivative spectra at 1900nm (d1900) and 2095 nm (d2095) with dehydration time.
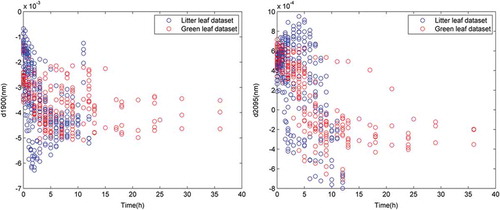
Figure 5. Regressions of SR (1300, 1450) and EWT, ND (2305, 1495) and LMA, and SR (1300, 1450)/ND (2305, 1495) and FMC.
4.2. Separately estimating FMC for different fuel types
As the biochemical compositions differ greatly between green leaves and litter and both fuels usually mixed up inside canopy, it might be necessary to separate them from each other in reality although litter is usually masked by overstore vegetation, and hence the approach of Wang et al [Citation2012] might be a good choice. The apparent difference in reflected spectra from 400 to 1200 nm could help to solve this issue. We therefore designed a synthetic index by combining the dND (1900, 2095) with NDVI (800,680), which is a vegetation index commonly used to estimate the degree of greenness [Carlson and Ripley, Citation1997]. The result indicated that the synthetic index could decouple green leaves from litters in FMC estimation, with an R2 of 0.85 and an RMSE of 21.25% for the green leaf dataset and an R2 of 0.45 and an RMSE of 69.26% for litters (fitted by exponential curves, see ). The poorer performance of the litter dataset was caused by the different NDVI values of individual species, suggesting that the indices needed to be validated with more plant species and the state of litter decomposition should also be considered since leaf spectral properties will continue to change as a function of litter age, and ultimately converge on a uniform spectrum representative of organic soil. For instance, NDVI is usually affected by the soil background when applied to green vegetation cover. Hence, although satisfactory results were obtained for the synthetic index, it needs thorough validations in future studies
Figure 6. Regressions of dND (1900, 2095) and FMC, and (dND-NDVI)/(dND+NDVI) and FMC.
4.3. New indices for applications at large scale
The proposed dND (1900, 2095), however, uses the band of 1900 nm falling in an atmospheric water vapor absorption window, which might hence limit the use of it with airborne or satellite-borne hyperspectral data. To solve it, we have further identified new indices that could potentially be applicable at large scale by excluding those three noisy spectrum domains resulting from high absorption of atmospheric water vapor (1350-1450 nm, 1800-1950 nm and 2200-2500 nm). The best indices identified in this way for FMC estimation are ND (1630, 1680) (R2=0.79, RMSE = 37.69%) and dSR (1655, 1965) (R2=0.80, RMSE = 36.93%). But the underlying mechanism of spectral wavelengths used in both indices is unclear if compared with that of dND (1900, 2095), in which incorporates principally both the information of leaf water and dry mass that most other reported indices usually ignored. Furthermore, their applications at large scale may not be so straightforward, since a number of newly emerged factors (e.g. canopy structure, atmospheric conditions, vegetation fraction etc.) need to be explicitly dealt with at pixel scale when using airborne or satellite-borne hyperspectral data. Extensive validations shall be carried out in future studies before they can be applied widely.
5. Conclusions
In this study, four commonly used types of indices (R, D, SR, ND) and two treatments of reflectance (original reflectance and first derivative of reflectance) were used to estimate FMC for both green and litter fuels based on leaf dehydration experiments. dND(1900, 2095) was identified as the best index to estimate FMC, which performed much better than previously reported indices. The superiority of the index lies in that the two derivative wavelengths of d1900 nm and d2095 nm used by it were closely related to leaf water content and leaf dry matter content, respectively. Furthermore, by applying NDVI, which can indicate the differences between green leaves and litters, a synthetic index which normalized dND (1900, 2095) with NDVI had effectively separated green leaves from litters during FMC estimation. However, the wavelength of 1900 nm falls in an atmospheric water vapor absorption window, which might hence limit the use of the index with airborne or satellite-borne hyperspectral data. Alternatively, ND (1630, 1680) and dSR (1655, 1965) are recommended for potential large scale applications when atmospheric water vapor absorption must be taken into account. However, extensive validations shall be carried out in future studies before they can be applied widely.
Acknowledgment
We thank the members of the Laboratory of Macroecology and the Institute of Silviculture, Shizuoka University, for their support in both field work and laboratory analyses. This study was partially supported by the JSPS project (Grant No. 25302001).
References
- Aguado, I., Chuvieco, E., Borén, R., Nieto, H. (2007) - Estimation of dead fuel moisture content from meteorological data in Mediterranean areas. Applications in fire danger assessment. International Journal of Wildland Fire, 16(4): 390–397. doi: 10.1071/WF06136.
- Bowyer, P., Danson, F. (2004) - Sensitivity of spectral reflectance to variation in live fuel moisture content at leaf and canopy level. Remote Sensing of Environment, 92(3): 297–308. doi: 10.1016/j.rse.2004.05.020.
- Camia, A., Leblon, B., Cruz, M., Carlson, J., Aguado, I. (2003) - Methods used to estimate moisture content of dead wildland fuels, In E. Chuvieco ( Ed.), Wildland fire danger estimation and mapping: The role of remote sensing data. World Scientific Publishing, Singapore, 4: 91–113.
- Carlson, J., Burgan, R. (2003) - Review of users' needs in operational fire danger estimation: the Oklahoma example. International Journal of Remote Sensing, 24(8): 1601–1620. doi: 10.1080/01431160210144651.
- Carlson, T.N., Ripley, D.A. (1997) - Onthe relation between NDVI, fractional vegetation cover, and leaf area index. Remote sensing of Environment, 62(3): 241–252. doi: 10.1016/S0034-4257(97)00104-1.
- Carter, G.A. (1991) - Primary and secondary effects of water content on the spectral reflectance of leaves. American Journal of Botany, 78(7): 916–924.
- Ceccato, P., Flasse, S., Gregoire, J.M. (2002a) - Designing a spectral index to estimate vegetation water content from remote sensing data: Part 2. Validation and applications. Remote Sensing of Environment, 82(2): 198–207. doi: 10.1016/S0034-4257(02)00036-6.
- Ceccato, P., Flasse, S., Tarantola, S., Jacquemoud, S., Grégoire, J.M. (2001) - Detecting vegetation leaf water content using reflectance in the optical domain. Remote sensing of environment, 77(1): 22–33. doi: 10.1016/S0034-4257(01)00191-2.
- Ceccato, P., Gobron, N., Flasse, S., Pinty, B., Tarantola, S. (2002b) - Designing a spectral index to estimate vegetation water content from remote sensing data: Part 1: Theoretical approach. Remote Sensing of Environment, 82(2): 188–197. doi: 10.1016/S0034-4257(02)00037-8.
- Cheng, T., Rivard, B., Sánchez-Azofeifa, A.G., Féret, J.B., Jacquemoud, S., Ustin, S.L. (2012) - Predicting leaf gravimetric water content from foliar reflectance across a range of plant species using continuous wavelet analysis. Journal of plant physiology, 169(12): 1134–1142. doi: 10.1016/j.jplph.2012.04.006.
- Cheng, T., Rivard, B., Sanchez-Azofeifa, A. (2011) - Spectroscopic determination of leaf water content using continuous wavelet analysis. Remote Sensing of Environment, 115(2): 659–670. doi: 10.1016/j.rse.2010.11.001.
- Chuvieco, E., Aguado, I., Dimitrakopoulos, A.P. (2004a) - Conversion of fuel moisture content values to ignition potential for integrated fire danger assessment. Canadian Journal of Forest Research, 34(11): 2284–2293. doi: 10.1139/x04-101.
- Chuvieco, E., Cocero, D., Aguado, I., Palacios, A., Prado, E. (2004b) –Improving burning efficiency estimates through satellite assessment of fuel moisture content. Journal of Geophysical Research: Atmospheres (1984–2012), 109 (D14): 1-8. doi: 10.1029/2003JD003467.
- Chuvieco, E., Cocero, D., Riano, D., Martin, P., Martınez-Vega, J., de la Riva, J., Pérez, F. (2004c) - Combining NDVI and surface temperature for the estimation of live fuel moisture content in forest fire danger rating. Remote Sensing of Environment, 92(3): 322–331. doi: 10.1016/j.rse.2004.01.019.
- Danson, F., Bowyer, P. (2004) - Estimatinglive fuel moisture content from remotely sensed reflectance. Remote Sensing of Environment, 92(3): 309–321. doi: 10.1016/j.rse.2004.03.017.
- Daughtry, C., Hunt, E., Doraiswamy, P., McMurtrey, J. (2005) - Remote sensing the spatial distribution of crop residues. Agronomy Journal, 97(3): 864–871. doi: 10.2134/agronj2003.0291.
- Dennison, P., Roberts, D., Peterson, S., Rechel, J. (2005) - Use of normalized difference water index for monitoring live fuel moisture. International Journal of Remote Sensing, 26(5): 1035–1042. doi: 10.1080/0143116042000273998.
- Dimitrakopoulos, A., Bemmerzouk, A. (2003) - Predicting live herbaceous moisture content from a seasonal drought index. International Journal of Biometeorology, 47(2): 73–79. doi: 10.1007/s00484-002-0151-1.
- Filella, I., Penuelas, J. (1994) - Thered edge position and shape as indicators of plant chlorophyll content, biomass and hydric status. International Journal of Remote Sensing, 15(7): 1459–1470. doi: 10.1080/01431169408954177.
- Foley, S., Rivard, B., Sanchez-Azofeifa, G.A., Calvo, J. (2006) - Foliar spectral properties following leaf clipping and implications for handling techniques. Remote Sensing of Environment, 103(3): 265–275. doi: 10.1016/j.rse.2005.06.014.
- Gao, B.C. (1996) - NDWI—anormalized difference water index for remote sensing of vegetation liquid water from space. Remote sensing of environment, 58(3): 257–266. doi: 10.1016/S0034-4257(96)00067-3.
- García, M., Chuvieco, E., Nieto, H., Aguado, I. (2008) - Combining AVHRR and meteorological data for estimating live fuel moisture content. Remote Sensing of Environment, 112(9): 3618–3627. doi: 10.1016/j.rse.2008.05.002.
- Hardisky M., Klemas V., Smart M. (1983) - The influence of soil salinity, growth form, and leaf moisture on the spectral radiance of Spartina alterniflora canopies. Photogrammetric Engineering and Remote Sensing 48, 77–84.
- Horler, D., DOCKRAY, M., Barber, J. (1983) - The red edge of plant leaf reflectance. International Journal of Remote Sensing, 4(2): 273–288. doi: 10.1080/01431168308948546.
- Hunt Jr, R., Rock, B.N., Nobel, P.S. (1987) - Measurement of leaf relative water content by infrared reflectance. Remote sensing of environment, 22(3): 429–435. doi: 10.1016/0034-4257(87)90094-0.
- le Maire, G., François, C., Soudani, K., Berveiller, D., Pontailler, J.Y., Bréda, N., Genet, H., Davi, H., Dufrêne, E. (2008) - Calibration and validation of hyperspectral indices for the estimation of broadleaved forest leaf chlorophyll content, leaf mass per area, leaf area index and leaf canopy biomass. Remote Sensing of Environment, 112(10): 3846–3864. doi: 10.1016/j.rse.2008.06.005.
- Li, P., Wang, Q. (2011) - Retrieval of leaf biochemical parameters using PROSPECT inversion: A new approach for alleviating ill-posed problems. Geoscience and Remote Sensing, IEEE Transactions on, 49(7): 2499–2506. doi: 10.1109/TGRS.2011.2109390.
- Jacquemoud, S., Baret, F. (1990) - PROSPECT: A model of leaf optical properties spectra. Remote sensing of environment, 34(2): 75–91. doi: 10.1016/0034-4257(90)90100-Z.
- Jacquemoud, S., Ustin, S., Verdebout, J., Schmuck, G., Andreoli, G., Hosgood, B. (1996) - Estimating leaf biochemistry using the PROSPECT leaf optical properties model. Remote sensing of environment, 56(3): 194–202. doi: 10.1016/0034-4257(95)00238-3.
- Jacquemoud, S., Verhoef, W., Baret, F., Bacour, C., Zarco-Tejada, P.J., Asner, G.P., François, C., Ustin, S.L. (2009) - PROSPECT+SAIL models: A review of use for vegetation characterization. Remote Sensing of Environment, 113: S56–S66. doi: 10.1016/j.rse.2008.01.026.
- Nagler, P., Daughtry, C., Goward, S. (2000) - Plant litter and soil reflectance. Remote Sensing of Environment, 71(2): 207–215. doi: 10.1016/S0034-4257(99)00082-6.
- Nieto, H., Aguado, I., Chuvieco, E., Sandholt, I. (2010) - Dead fuel moisture estimation with MSG–SEVIRI data. Retrieval of meteorological data for the calculation of the equilibrium moisture content. Agricultural and Forest Meteorology, 150(7): 861–870. doi: 10.1016/j.agrformet.2010.02.007.
- Peñuelas, J., Filella, I., Biel, C., Serrano, L., Save, R. (1993) - The reflectance at the 950–970 nm region as an indicator of plant water status. International journal of remote sensing, 14(10): 1887–1905. doi: 10.1080/01431169308954010.
- Riaño, D., Vaughan, P., Chuvieco, E., Zarco-Tejada, P.J., Ustin, S.L. (2005) - Estimation of fuel moisture content by inversion of radiative transfer models to simulate equivalent water thickness and dry matter content: analysis at leaf and canopy level. Geoscience and Remote Sensing, IEEE Transactions on, 43(4): 819–826. doi: 10.1109/TGRS.2005.843316.
- Richardson, A.D., Berlyn, G.P. (2002) - Changes in foliar spectral reflectance and chlorophyll fluorescence of four temperate species following branch cutting. Tree Physiology, 22(7): 499–506. doi: 10.1093/treephys/22.7.499.
- Roberts, D., Dennison, P., Peterson, S., Sweeney, S., Rechel, J. (2006) - Evaluation of Airborne Visible/Infrared Imaging Spectrometer (AVIRIS) and Moderate Resolution Imaging Spectrometer (MODIS) measures of live fuel moisture and fuel condition in a shrubland ecosystem in southern California. Journal of Geophysical Research: Biogeosciences (2005–2012), 111(G4). doi: 10.1029/2005JG000113.
- Romero, A., Aguado, I., Yebra, M. (2012) - Estimation of dry matter content in leaves using normalized indexes and PROSPECT model inversion. International Journal of Remote Sensing, 33(2): 396–414. doi: 10.1080/01431161.2010.532819.
- Rothermel, R.C. (1972) - A mathematical model for predicting fire spread in wildland fuels. USDA Forest Service, Intermountain Forest and Range Experiment Station Research Paper, INT-115, Ogden, UT, 1–40.
- Seelig, H.D., Hoehn, A., Stodieck, L., Klaus, D., Adams I. ii, Emery, W. (2008) - The assessment of leaf water content using leaf reflectance ratios in the visible, near-, and short-wave-infrared. International Journal of Remote Sensing, 29(13): 3701–3713. doi: 10.1080/01431160701772500.
- Tucker, C.J. (1980) - Remote sensing of leaf water content in the near infrared. Remote sensing of Environment, 10(1): 23–32. doi: 10.1016/0034-4257(80)90096-6.
- van der Werf, G.R., Randerson, J.T., Collatz, G.J., Giglio, L., Kasibhatla, P.S., Arellano, A.F., Olsen, S.C., Kasischke, E.S. (2004) - Continental-scale partitioning of fire emissions during the 1997 to 2001 El Nino/La Nina period. Science, 303(5654): 73–76. doi: 10.1126/science.1090753.
- Viegas, D., Piñol, J., Viegas, M., Ogaya, R. (2001) - Estimating live fine fuels moisture content using meteorologically-based indices. International Journal of Wildland Fire, 10(2): 223–240. doi: 10.1071/WF01022.
- Viegas, D., Viegas, M., Ferreira, A. (1992) - Moisture content of fine forest fuels and fire occurrence in central Portugal. International Journal of Wildland Fire, 2(2): 69–86. doi: 10.1071/WF9920069.
- Viney, N.R. (1991) - A review of fine fuel moisture modelling. International Journal of Wildland Fire, 1(4): 215–234. doi: 10.1071/WF9910215.
- Wang, L., Hunt Jr, E.R., Qu, J.J., Hao, X., Daughtry, C.S. (2011a) - Towards estimation of canopy foliar biomass with spectral reflectance measurements. Remote Sensing of Environment, 115(3): 836–840. doi: 10.1016/j.rse.2010.11.011.
- Wang, L., Hunt Jr, E.R., Qu, J.J., Hao, X., Daughtry, C.S. (2013) - Remote sensing of fuel moisture content from ratios of narrow-band vegetation water and dry-matter indices. Remote Sensing of Environment, 129: 103-110. doi: 10.1016/j.rse.2012.10.027.
- Wang, L., Qu, J.J., Hao, X., Hunt Jr, E.R. (2011b) - Estimating dry matter content from spectral reflectance for green leaves of different species. International Journal of Remote Sensing, 32(22): 7097–7109. doi: 10.1080/01431161.2010.494641.
- Wang, Q., Li, P. (2012) - Identification of robust hyperspectral indices on forest leaf water content using PROSPECT simulated dataset and field reflectance measurements. Hydrological Processes, 26(8): 1230–1241. doi: 10.1002/hyp.8221.
- Yebra, M., Chuvieco, E. (2009) - Linking ecological information and radiative transfer models to estimate fuel moisture content in the Mediterranean region of Spain: Solving the ill-posed inverse problem. Remote Sensing of Environment, 113(11): 2403–2411. doi: 10.1016/j.rse.2009.07.001.
- Yebra, M., Chuvieco, E., Riaño, D. (2008) - Estimation of live fuel moisture content from MODIS images for fire risk assessment. Agricultural and Forest Meteorology, 148(4): 523–536. doi: 10.1016/j.agrformet.2007.12.005.
- Yebra, M., Dennison, P.E., Chuvieco, E., Riano, D., Zylstra, P., Hunt Jr, E.R., Danson, F.M., Qi, Y., Jurdao, S. (2013) - A global review of remote sensing of live fuel moisture content for fire danger assessment: Moving towards operational products. Remote Sensing of Environment, 136: 455–468. doi: 10.1016/j.rse.2013.05.029.
- Zarco-Tejada, P.J., Rueda, C., Ustin, S. (2003) - Water content estimation in vegetation with MODIS reflectance data and model inversion methods. Remote Sensing of Environment, 85(1): 109–124. doi: 10.1016/S0034-4257(02)00197-9.