
ABSTRACT
The increased availability of mapped environmental data calls for better tools to analyze the spatial characteristics and information contained in those maps. Publicly available, user-friendly and universal tools are needed to foster the interdisciplinary development and application of methodologies for the extraction of image object information properties contained in digital raster maps. That is the overarching goal of GuidosToolbox, which is a set of customized, thematically grouped raster image analysis methodologies provided in a graphical user interface and for all popular operating systems. The Toolbox contains a wide selection of dedicated algorithms and tools, which are complemented by batch-processing and pre- and post-processing routines, all designed to objectively describe and quantify various spatial properties of image objects in digital raster data. While first developed for the analysis of remote sensing data in environmental applications, the Toolbox now provides a generic framework that is applicable to image analysis at any scale and for any kind of digital raster data.
Software availability
Name of the software: GuidosToolbox
Developer: Peter Vogt
Availability and cost: http://forest.jrc.ec.europa.eu/download/software/guidos/ Free for any kind of use. Commercial use requires signing a dedicated license; please contact the developer for further information.
Year first available: 2008 (upgrades detailed in the changelog of the software)
Hardware required: PC or Mac.
Operating system and software required: MS-Windows (32/64bit: XP SP3 and newer), Linux (64 bit); Mac OS (64 bit: requiring free XQuartz: http://www.xquartz.org and free GDAL Complete: http://www.kyngchaos.com/software/frameworks).
Programming language: IDL (IDL software/license not needed to run the program).
Program size: Linux/MacOS: ~50 MB; MS-Windows: ~70 MB.
Workshop material: ~110 MB, optional, available from within the software, more info at: http://forest.jrc.ec.europa.eu/download/software/guidos/workshops/
Introduction
In the past decades, human activities have imposed increasing pressure on our environment (Steffen et al., Citation2004). Urbanization, land conversion to agriculture and large-scale monocultures, deforestation, climate change and the increased amount of fires and pest outbreaks are just a few examples highlighting the urgent need for a systematic landscape-monitoring scheme to support efficient mitigation measures (Carpenter et al., Citation2006). Spaceborne observations are now widely available, providing essential and harmonized information for different thematic questions, across political boundaries, and at multiple scales (O’Neill et al., Citation1997; Turner et al., Citation2007). They are a cost-efficient and consistent data source suitable for mapping and monitoring landscape changes (Rose et al., Citation2014; Roy et al., Citation2014). However, understanding the observed changes requires knowledge of a variety of landscape attributes such as composition, pattern and connectivity (Chetkiewicz et al., Citation2006; Gustafson, Citation1998; Lausch et al., Citation2015; Turner, Citation2005). Some of these attributes are often obvious to the human eye, but automated methods and tools are required when using those data to monitor, quantify and compare the impacts of human activities on our environment in a consistent way over large regions (Riitters, Wickham, Vogelmann, & Jones, Citation2000). Knowledge of the patterns of change and not just the locations of change is a prerequisite for sustainable, multifunctional landscape management, as well as the design of effective resource management policies (Pickett & Cadenasso, Citation1995).
This paper describes a free software package that provides an integrative framework for a series of generic digital image analysis schemes tailored to locate, measure and create maps of essential image pattern and object attributes in a universal and consistent way. The Graphical User Interface for the Description of Objects and their Shapes Toolbox (GuidosToolbox) provides user-friendly access to a variety of dedicated morphological spatial analysis procedures (Soille, Citation1994, Citation2004; Soille & Vogt, Citation2009, Citation2007b; Vogt et al., Citation2007a), which are not available in any other software. Additional routines, similar to those provided in other free software, such as QGIS [http://qgis.org/en/site/], GRASS [http://grass.osgeo.org/], GDAL [http://www.gdal.org/], R [https://www.r-project.org/], Conefor (Saura & Torné, Citation2009) and FRAGSTATS (McGarigal, Cushman, & Ene, Citation2012), have been fine-tuned to provide direct answers for end users in a variety of thematic application fields, requiring the analysis of image attributes such as pattern, fragmentation, connectivity and change. The provision of GuidosToolbox as a stand-alone application in a self-contained directory allows for maximum portability: it is easy to use the application from an external USB-drive. GuidosToolbox can be installed without administrator rights on the three main operating systems, permitting use of the software even in restricted computing environments. We anticipate this brief introduction will encourage readers to examine the related documentation included in the software and further detailed in the optional workshop material.
Program description
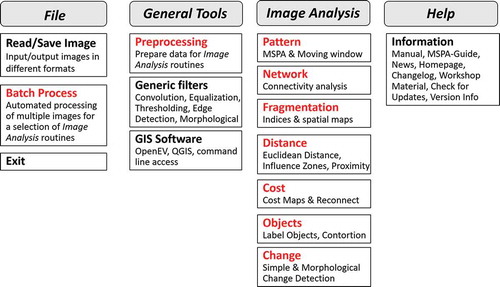
GuidosToolbox is structured in four pillars (see ) with pillar 3 containing custom containers for specific thematic applications and other pillars containing generic image processing tasks.
Figure 1. Schematic outline of the four pillars in GuidosToolbox. The core modules are Batch Process, Preprocessing, and all Image Analysis modules. They provide access to thematically grouped custom routines, which are unique to GuidosToolbox.
Pillar 1 (File) contains a series of GUI-driven routines to read and export images in various data formats, including setting up kml-formatted raster image overlays for display in Google Earth (examples and instructions for visualization can be found at http://forest.jrc.ec.europa.eu/download/data/google-earth-overlays/). This kml option enhances the interpretation of the results by fusing it to the additional data layers provided within the Google Earth desktop application. In addition to analyzing individual images, the Batch menu entry provides a GUI-driven setup for automated processing of a series of images. Batch processing options include most routines from pillar 3 (Image Analysis).
Pillar 2 (General Tools) provides a series of routines for preprocessing including recoding, thresholding, byte-shifting and projecting GeoTiff images to WGS84 to set up Google Earth raster image overlays. The next set of tools address generic digital image processing tasks including a series of filters for convolution, equalization, thresholding, edge detection and a small morphological toolbox to illustrate the effect of different types and structuring elements of morphological operators. The last set of tools contains external software packages to facilitate further analysis in the field of geospatial data processing using the geospatial libraries GDAL (Warmerdam, Citation2009). Upon startup, GuidosToolbox will add a launcher to QGIS, a free and powerful GIS application, if it is present on the user’s system.
Pillar 4 (Help) provides access to the following GuidosToolbox-related information: a detailed user manual; a dedicated guide to the Morphological Spatial Pattern Analysis (MSPA) input requirements, processing settings and output features; links to the project homepage and program news; information about and installation of the optional GuidosToolbox workshop material containing additional information, sample data and exercises; and options to check for and install updates.
Pillar 3 (Image Analysis) is the core of the GuidosToolbox software collection, featuring custom routines grouped in a modular structure to address specific thematic aspects of image processing. All routines within these thematic containers are unique to GuidosToolbox and not available in any other image processing software. For maximum applicability on any kind of digital image analysis, all routines are based on geometric principles exclusively. To facilitate the interpretation of the results, the user can apply custom grouping of the pixel values to highlight low, medium and high value ranges for a variety of attributes. The following sections describe the thematic containers in Pillar 3.
Pattern
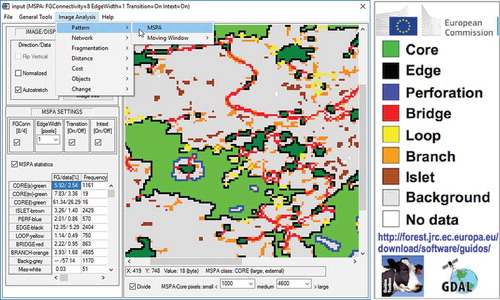
Concepts of mathematical morphology are widely used in digital image analysis (Soille, Citation2004) and they form the foundation of GuidosToolbox. A custom sequence of morphological operators provides a generic and universal pattern analysis framework named MSPA (Soille & Vogt, Citation2009). MSPA conducts a segmentation on a binary image to detect and localize mutually exclusive morphometric feature classes describing the shape, connectivity and spatial arrangement of image objects on a categorical map (see ).
Figure 2. The GuidosToolbox software interface showing a selection of thematic containers in Pillar 3 (Image Analysis) and the MSPA pattern analysis in the viewport illustrating different morphological feature classes of a forest map: Small Core areas (dark green); large Core areas (green); Core area boundaries (Edge/external – black, Perforation/internal – blue); connecting pathways between different Core areas (Bridge – red) and returning back to the same Core area (Loop – yellow); isolated forest patches and too small to contain Core area (Islet – brown); and Branches (orange). The MSPA Settings and class statistics are summarized in the left column of the interface.
A set of moving window routines (Riitters, O’Neill, & Jones, Citation1997, Citation2000, Citation2002) allows for quantifying aggregation, contagion, texture and deriving the landscape mosaic (Riitters et al., Citation2000; Wickham & Norton, Citation1994), which is a tripolar classification of a location accounting for the relative proportions of three (land cover) classes in a window surrounding that location.
Network
A unique feature of MSPA is the automatic detection of connecting pathways between core areas of image objects. Once found, the logical next point of interest is to rank those detected pathways with respect to their relative importance of each component, node and link in a given network. This task is achieved by applying concepts and metrics of graph theory (Saura & Rubio, Citation2010; Saura, Vogt, Velázquez, Hernando, & Tejera, Citation2011a). In addition, GuidosToolbox provides custom tools to set up dedicated input files for additional detailed investigations of network properties within a graph-theory application, i.e. the Conefor software package (Saura & Torné, Citation2009) available at http://www.conefor.org
Fragmentation
The routines in this section use holistic and purely geometric concepts such as spatial entropy and contagion to quantify spatial heterogeneity and to provide normalized per-pixel values on a map as well as a summary index for the entire image. The methodologies in this section were developed specifically to go beyond describing fragmentation as perceived by faunal species and instead providing quantitative, normalized measures as well as spatial details for various aspects of fragmentation. Further details on these methodologies are explained in Vogt (Citation2015) and GOFC-GOLD (Citation2017).
Distance
The routines in this section will create maps of objects of interest and showing the Euclidean distance map inside and outside those objects. This type of analysis may be further pursued to illustrate the Influence Zones of each object and to derive the pairwise proximity between neighboring image objects. The concept of Influence Zones could be of interest to map potential areas of risk for insect diseases. Proximity may be used to locate close encounters of existing objects for the establishment of cost-efficient reconnecting pathways in restoration planning.
Cost
Cost analysis can be seen as a generalized distance analysis where the pixels along a given path are counted by a weighted sum of resistance and distance along the path. Here, we use the concept of generalized geodesy via geodesic time (Soille, Citation1994): We start with two maps, a resistance map showing the normalized value of resistance for each pixel, and a marker map showing the location and extent of the start object. With these two maps, we then calculate the travel time from the start object boundaries to arrive at any other pixel in the map, resulting in the cost map for the start object. When repeating the same process for a target object, the two cost maps can then be added to a combined cost map for travelling from the start to the target object. The least cost path between start and target object is the skeleton of the pixels having the minimum cost value in the combined cost map. An animated sequence illustrating this idea is provided at the project homepage: http://forest.jrc.ec.europa.eu/download/software/guidos/
The Reconnect module provides an interactive interface to detect and investigate a minimum cost path between any two user-selectable image objects. The potential efficiency of such a path is then quantified by the price (number of pixels to establish this path) in relation to the connected area gained in the network by creating that path, with the connectivity gain quantified as the increase in the value of the ECA metric (ECA=Equivalent Connected Area, see Saura, Mouton, & Rodríguez-Freire, Citation2011b). The Reconnect module may also be used in conservation programs to detect important stepping stones between existing habitat patches.
Objects
The routines in this section are dedicated to describe individual image object attributes. One option is to label objects for a predefined minimum size and 8- or 4-connectivity. Contortion measures the degree of regularity of a given image object. Its value is derived by following the object perimeter and counting the number of changes in the x- and y-directions. In raster data, regularly shaped objects such as buildings and agricultural fields will have low contortion values, while natural objects are more likely to be non-regular with higher contortion values.
Change
A custom morphological change analysis (Seebach, Strobl, Vogt, Mehl, & San-Miguel-Ayanz, Citation2013) is available, with the focus to neglect spurious changes and provide essential change areas of loss and gain only. Besides the spatial distribution of the change areas, this methodology will also calculate the elasticity value (Riitters, Wickham, Costanza, & Vogt, Citation2015), which is the ratio of the percent change in interior area to the overall percent change. For example, in the case of forest loss, larger elasticity indicates changes with relatively proportion of loss of interior forest creating larger fragmenting effects.
Application examples
All image analysis schemes in GuidosToolbox are based on geometric principles only. This choice was taken in order to set up a generic, neutral analysis framework, which can be applied to any kind of digital data and at any scale or spatial resolution. This section provides some examples to illustrate the additional benefit of the GuidosToolbox-specific image analysis schemes in a variety of thematic applications. Additional examples can be found in the workshop material.
One of the key components in GuidosToolbox is the spatial pattern analysis MSPA (Soille & Vogt, Citation2009). MSPA detects and describes the morphometric aspects of the foreground objects on a categorical map. The result is a copy of the input map, where the foreground objects are segmented into a set of mutually exclusive morphometric feature classes. In short, this process can be applied to detect and measure protrusions into intact areas, distinguish between core areas and boundaries, and in particular to automatically find connecting pathways.
shows MSPA of a forest map highlighting several morphometric aspects and a statistical summary of the forest patches in a given landscape. This type of information may be useful in forest inventories, landscape and conservation studies designed to protect connecting pathways (Bridges) and guarantee the integrity of the forest network. In addition to connecting pathways, the MSPA-detected perforations are of key interest in biodiversity applications, such as species-specific habitat assessment schemes. Since perforations are holes in otherwise core habitat, they strongly alter habitat quality by introducing edge effects deeper into previously core habitat. In contrast to commonly used landscape indices, the MSPA map product provides the additional benefit to find and provide the geographic location of local hot spots in connecting pathways, perforations, intact habitat areas and other forest patch attributes.
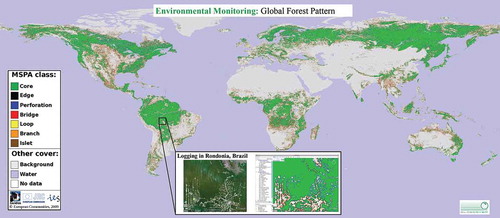
shows a global MSPA forest map saved as a Google Earth image overlay. This image format may be used to display any geospatial information obtained from GuidosToolbox together with the additional data layers available from the Google Earth interface. The image overlay archive can be directly provided to the end user or stored on a web-server. The user can then load the archive into Google Earth and interactively browse to any part in the world and visualize the corresponding forest pattern distribution via the Transparency slider in the left panel of the Google Earth desktop application. Additional examples are available at http://forest.jrc.ec.europa.eu/download/data/google-earth-overlays/.
Figure 3. Global forest pattern (MSPA) derived from Globcover (Citation2005–2006, 300 m resolution) and converted to a Google Earth image overlay (http://forest.jrc.ec.europa.eu/download/data/google-earth-overlays/). The zoomed area shows forest coverage in Rondônia, Brazil (left) and the corresponding forest pattern as an overlay in Google Earth (right). With permission from P. Vogt, EC-JRC.
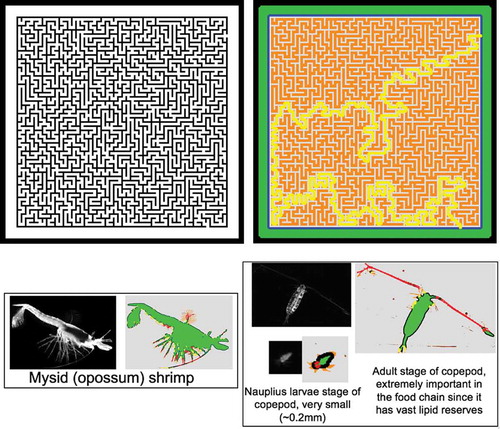
The images in illustrate the benefit of using a purely geometric assessment framework, applicable to any scale and thematic nature of the input data. Since any kind of digital data can be analyzed, we illustrate the automatic detection of connecting pathways on the classic example of a maze. The top row shows a photograph of a maze having an entry and an exit point in the outer surrounding white area. The MSPA will map this outer area as core and detect the searched connecting pathway as a loop reconnecting back to the same core area. The bottom row shows examples of pattern analysis on macroscopic images of zooplankton. Here, MSPA was used to investigate the presence and proportions of MSPA pattern classes (corresponding to e.g. maxillipeds, antennae) of different type and evolution stages in zooplankton image data. The results were then ingested into a machine-learning algorithm for automatic identification of key zooplankton taxa in the Canadian Arctic (Schmid, Aubry, Grigor, & Fortier, Citation2016).
Figure 4. Generic use of MSPA pattern analysis: Top row – Geometry: Automatic detection of connecting pathways, for example the pathway (yellow) between entry and exit point of a maze. Bottom row – Oceanography: MSPA classes characterizing different zooplankton structures.
By analogy to describing structural features on a structural map, MSPA can equally be applied to functional maps and then locate functional patterns. This concept was demonstrated through the analysis of a species movement (functional) map with the detection of stepping stones, represented as a functional connecting pathway (Vogt et al., Citation2009).
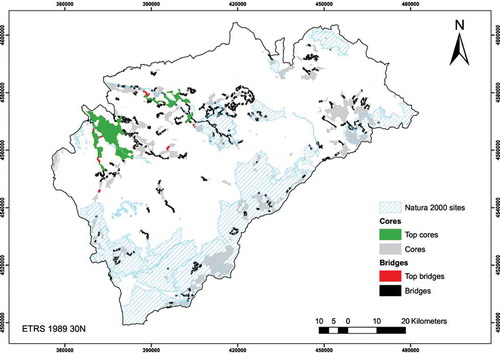
A key issue in any graph-theoretic application is the preparation of the input data. Here, connectivity is defined by stipulating the actual structural or functional connections between different nodes, which is particularly difficult when dealing with images having a multitude of nodes. In many cases, a human interpreter will conduct this time-consuming and error-prone task. In this case, MSPA provides an automatic, reliable and repeatable methodology to set up the network description via the analogy of the MSPA pattern class: core representing network nodes and the MSPA class Bridge representing network links. This intersection of graph-theory and MSPA pattern analysis is mutually beneficial: The graph-theory input data can be set up reliably in an automatic way, and MSPA can take advantage of graph-theory algorithms, for example to provide a ranking of the importance of the MSPA-detected set of Bridges. This concept is demonstrated in by Saura et al. (Citation2011a), highlighting the additional benefit of merging the two analysis frameworks for detecting and prioritizing conservation hot spots in the province of Segovia, Spain.
Figure 5. Combining pattern and connectivity analysis for efficient forest conservation management in the province of Segovia, Spain: Detection and ranking of most important forest core areas (green) and connecting pathways (red).
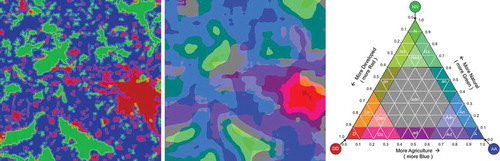
The human impact on our landscape is a primary concern for landscape planning, climate change analysis and risk assessment studies. By analogy to the familiar soil triangle that classifies soil type based on the relative proportions of sand, silt and clay in a soil sample, land cover types can be decomposed into the three main components: Agriculture, Natural and Developed (Riitters et al., Citation2000; Wickham & Norton, Citation1994). The relative proportion of these three components can then be investigated in a moving window analysis, which produces a map of human influences measured by the landscape mosaic type. The spatial dimension of the moving window can be set by the user and in this way, which essentially samples landscapes at higher or lower spatial frequencies and allows the user to visualize the landscape mosaic at different spatial scales. This is illustrated in , where the landscape mosaic has been calculated on the same input data but with moving window sizes of 1 × 1 km and 10 × 10 km. This feature may be used or interpreted to find dominant land cover types and human–natural interface zones at different spatial scales. Over time, or in simulation studies, this type of analysis has the potential to detect tipping points, where local landscapes change from one landscape mosaic type to another, and to visualize the geographic movement of shifting mosaics over time.
Figure 6. Landscape Mosaic: Dominant land cover observed at 1 km (left) and 10 km (center) spatial resolution west of Hanover, Germany (data source: CORINE (Citation2006) land cover, 25 m). The right panel shows the tripolar domain and color-coded proportions of the three land cover components: Developed (red), Agriculture (blue) and Natural (green).
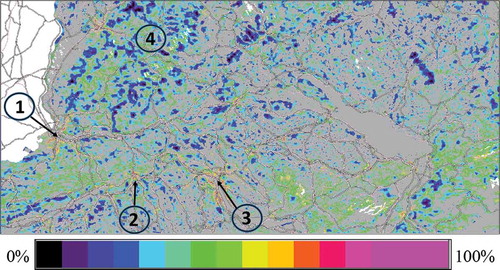
The increase in road networks, conversion to agriculture and human activity in general has led to increased landscape fragmentation. GuidosToolbox provides a set of different fragmentation assessment schemes, focusing on specific aspects of fragmentation (Vogt, Citation2015). In contrast to the usual species-specific assessment schemes, the GuidosToolbox provided routines have the advantage to provide spatially explicit, normalized, species-independent fragmentation indices. These attributes are mandatory in order to locate hot spots, measure fragmentation at different scales and places, as well as to measure changes in fragmentation over time. For example, in , the normalized per-pixel indices of forest fragmentation are retrieved. Running the same analysis over the same area at a different time will immediately display hot spots of changes and quantify per-pixel changes. Quantification and mapping of changing fragmentation is of particular interest for decision and policy makers because it allows measuring the progress and/or the success of land management programs and their impacts on our environment.
Figure 7. Spatial distribution of normalized forest fragmentation of a forest mask in the southwest of Germany (data source: COPERNICUS, Citation2012, 20 m resolution): Higher fragmentation in the vicinity of cities, i.e. Basel (1), Aarau (2) and Zurich (3), and low fragmentation in the Black Forest area (4). With permission from P. Vogt, EC-JRC.
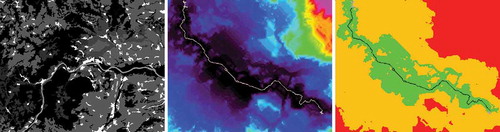
Landscape changes and fragmentation may have a strong impact on the permeability of the landscape for protected species and/or the accessibility of different habitat patches. Different types of land cover exhibit species-specific resistance values to traverse a given land cover (Vogt et al., Citation2009). Cost analysis studies evaluate the aggregated resistance over space and/or along movement routes. A commonly known measure is the so-called least cost path, indicating the path of least aggregated resistance, equivalent to the shortest travel time, between two habitat patches. shows a land cover map, the cost or travel time map distribution for a given start and target object, and the least cost path between the two. Within GuidosToolbox, the user can interactively set thresholds to group the cost map into zones of low, medium and high cost. The provision of the full cost map, instead of the least cost path only, and the cost grouping option allows for a richer, spatially explicit assessment. This feature is important for the evaluation of simulated or real local land cover changes and their impact on, for example, the movement capability of protected species, the spread potential of an insect disease, fire or pollination.
Figure 8. Cost analysis on a landscape: Left: Map of land cover classes with corresponding normalized movement resistance indices. Center: Map of cost or travel time between start and target object (gray) including least cost path (white). Right: User selected cost thresholds to group the cost map into zones of small, medium and high cost.
Discussion
The aim of GuidosToolbox is to provide a user-friendly interface to a series of geometric and hence fully generic tools, resulting in objective, quantitative measures and clearly defined morphometric feature classes. Generic applicability of all image analysis methodologies is the key idea behind the software development of GuidosToolbox. The focus on applying geometric concepts provides a framework for routines, which can be equally applied to any spatial resolution as well as any thematic kind of raster data. For example, the MSPA algorithm has already been applied in a wide variety of application fields. shows how MSPA can detect a structural connecting pathway in a maze puzzle, or helps at microscale in an automatic zooplankton identification model (Schmid et al., Citation2016). In addition to structural patterns, the same methodology describes functional movement patterns of squirrels (Vogt et al., Citation2009). MSPA detected phase changes in neutral model analysis (Citation2009; Riitters, Vogt, Soille, Kozak, & Estreguil, Citation2007). MSPA was used at continental scale to assess green infrastructure (Wickham, Riitters, Wade, & Vogt, Citation2010), to analyze the scale dependence of forest patterns (Ostapowicz, Vogt, Riitters, Kozak, & Estreguil, Citation2008) and to investigate European regions as providers of structural riparian corridors (Clerici & Vogt, Citation2012).
Fragmentation is a key aspect in landscape planning and forest management, but many approaches are purely descriptive and focused on individual faunal species, resulting in different species-specific assessments for the same landscape. In contrast, we use uniform morphometric concepts to measure the actual degree of landscape fragmentation in a generic way. This approach allows for highlighting areas of high fragmentation (hot spots), directly comparing different sites, but also to quantify and thus measure the progress and the outcome of political directives.
Contortion permits evaluating the degree of naturalness and the presence and impact of human activities in a given landscape. Methodologies to locate and measure the impact of human activity may constitute an important component to assess land cover change over large regions, to quantify direct and indirect measures of ecological conditions within human-dominated landscapes and to evaluate the effectiveness of environmental projects. These topics are often linked to planning scenarios in the field of environmental conservation and landscape restoration. Here, the GuidosToolbox provided assessment schemes – Influence Zones, Proximity and the Reconnect module – that may be of use to highlight potential areas of interest in landscape management; simulate and compare different landscape planning schemes; evaluate the impact of climate change; or to locate, prioritize and evaluate sites for efficient restoration efforts.
Thus, the illustrated tools are potentially valuable as operational techniques capable of transferring scientific expertise to inform critical environmental challenges to national and international political agendas.
Conclusion
GuidosToolbox contains a variety of image processing routines designed to extract different types of information from digital raster data. All routines are based on geometric concepts only and thus provide maximum applicability to any kind of thematic data and at any spatial resolution. Additional pre- and post-processing routines, batch mode and command line utilities complement the tool set into a turnkey solution for visualization and quantitative analysis of individual images as well as in operational conditions.
The included manual and in particular the optional workshop material contains many details and examples to illustrate the usage and functionality of the built-in processing options. The modular structure of the toolbox should facilitate finding appropriate routines as well as including future innovative and interdisciplinary research methodologies into the exiting thematic containers. With this conceptual setup, GuidosToolbox can serve as an interesting addition to an existing GIS installation or as a stand-alone framework providing alternative universal analysis schemes in environmental modeling or any other field requiring digital image analysis.
Acknowledgments
This research did not receive any specific grant from funding agencies in the public, commercial, or not-for-profit sectors. MSPA and GGEO (Generalized Geodesic Distance Function, Soille 1994) was developed and programmed by Peter Vogt in collaboration with Pierre Soille. The concept of contortion was proposed by Pierre Soille. Kurt Riitters provided the code for the spatcon and recode package. Santiago Saura provided advice and implementation help for adapting and including some of the Conefor metrics into the assessment of the importance of MSPA connections (Bridges) and other connectivity analyses included in GuidosToolbox. Frank Warmerdam permitted inclusion of the excellent FWTools package in the Linux version of GuidosToolbox. Dario Simonetti provided advice and help with the GDAL implementation in the MS-Windows version of GuidosToolbox.
Disclosure statement
No potential conflict of interest was reported by the authors.
References
- Carpenter, S.R., DeFries, R., Dietz, T., Mooney, H.A., Polasky, S., Reid, W.V., & Scholes, R.J. (2006). Millennium ecosystem assessment: Research needs. Science, 314, 257–361. doi:10.1126/science.1131946
- Chetkiewicz C-L, B., St. Clair, C.C., & Boyce, M.S. (2006). Corridors for conservation: Integrating pattern and process. Annual Review of Ecology, Evolution, and Systematics, 37, 317–342. doi:10.1146/annurev.ecolsys.37.091305.110050
- Clerici, N., & Vogt, P. (2012). Ranking European regions as providers of structural riparian corridors for conservation and management purposes. International Journal of Applied Earth Observation and Geoinformation, 21, 477–483. doi:10.1016/j.jag.2012.07.001
- COPERNICUS. (2012). High Resolution Layer Forest Type (FTY) 2012. Retrieved from http://land.copernicus.eu/pan-european/high-resolution-layers/forests/forest-type/
- CORINE. (2006). Corine Land Cover (CLC) 2006. Retrieved from http://land.copernicus.eu/pan-european/corine-land-cover/clc-2006/
- GLOBCOVER (2005-2006). Global Land Cover Product (Source Data: © ESA/ESA Globcover 2005 Project, led by MEDIAS-France/POSTEL). Retrieved from http://due.esrin.esa.int/page_globcover.php
- GOFC-GOLD. (2017). A sourcebook of methods and procedures for monitoring essential biodiversity variables in tropical forests with remote sensing. Eds: GOFC-GOLD & GEO BON (Report version UNCBD COP-13, GOFC-GOLD Land Cover Project Office). Wageningen University, The Netherlands. ISSN: 2542-6729. Retrieved from http://www.gofcgold.wur.nl/sites/gofcgold-geobon_biodiversitysourcebook.php
- Gustafson, E.J. (1998). Quantifying landscape spatial pattern: What is the state of the art? Ecosystems, 1, 143–156. doi:10.1007/s100219900011
- Lausch, A., Blaschke, T., Haase, D., Herzog, F., Syrbe, R.-U., Tischendorf, L., & Walz, U. (2015). Understanding and quantifying landscape structure – A review on relevant process characteristics, data models and landscape metrics. Ecological Modelling, 295, 31–41. doi:10.1016/j.ecolmodel.2014.08.018
- McGarigal, K., Cushman, S.A., & Ene, E. (2012). FRAGSTATS v4: Spatial Pattern Analysis Program for Categorical and Continuous Maps. Computer software program produced by the authors at the University of Massachusetts, Amherst. Retrieved from http://www.umass.edu/landeco/research/fragstats/fragstats.html
- O’Neill, R.V., Hunsaker, C.T., Jones, K.B., Riitters, K.H., Wickham, J.D., Schwartz, P.M., … Baillargeon, W.S. (1997). Monitoring environmental quality at the landscape scale. BioScience, 47, 513–519. doi:10.2307/1313119
- Ostapowicz, K., Vogt, P., Riitters, K.H., Kozak, J., & Estreguil, C. (2008). Impact of scale on morphological spatial pattern of forest. Landscape Ecology, 23, 1107–1117. doi:10.1007/s10980-008-9271-2
- Pickett, S.T.A., & Cadenasso, M.L. (1995). Landscape ecology: Spatial heterogeneity in ecological systems. Science, 269, 331–334. doi:10.1126/science.269.5222.331
- Riitters, K., Wickham, J., Costanza, J.K., & Vogt, P. (2015). A global evaluation of forest interior area dynamics using tree cover data from 2000 to 2012. Landscape Ecology, 31, 137–148. doi:10.1007/s10980-015-0270-9
- Riitters, K.H., O’Neill, R.V., & Jones, K.B. (1997). Assessing habitat suitability at multiple scales: A landscape-level approach. Biological Conservation, 81, 191–202. doi:10.1016/S0006-3207(96)00145-0
- Riitters, K.H., Vogt, P., Soille, P., & Estreguil, C. (2009). Landscape patterns from mathematical morphology on maps with contagion. Landscape Ecology, 24, 699–709. doi:10.1007/s10980-009-9344-x
- Riitters, K.H., Vogt, P., Soille, P., Kozak, J., & Estreguil, C. (2007). Neutral model analysis of landscape patterns from mathematical morphology. Landscape Ecology, 22, 1033–1043. doi:10.1007/s10980-007-9089-3
- Riitters, K.H., Wickham, J.D., O’Neill, R.V., Jones, K.B., Smith, E.R., Coulston, J.W., … Smith, J.H. (2002). Fragmentation of continental United States forests. Ecosystems, 5, 815–822. doi:10.1007/s10021-002-0209-2
- Riitters, K.H., Wickham, J.D., Vogelmann, J.E., & Jones, K.B. (2000). National land-cover pattern data. Ecology, 81, 604. doi:10.1890/0012-9658(2000)081[0604:NLCPD]2.0.CO;2
- Rose, R.A., Byler, D., Eastman, J.R., Fleishman, E., Geller, G., Goetz, S., … Wilson, C. (2014). Ten ways remote sensing can contribute to conservation. Conservation Biology, 29(2), 350–359. doi:10.1111/cobi.12397
- Roy, D.P., Wulder, M.A., Loveland, T.R., Woodcock, C.E., Allen, R.G., Anderson, M.C., … Zhu, Z. (2014). Landsat-8: Science and product vision for terrestrial global change research. Remote Sensing of Environment, 145, 154–172. doi:10.1016/j.rse.2014.02.001
- Saura, S., Estreguil, C., Mouton, C., & Rodríguez-Freire, M. (2011b). Network analysis to assess landscape connectivity trends: Application to European forests (1990-2000). Ecological Indicators, 11, 407–416. doi:10.1016/j.ecolind.2010.06.011
- Saura, S., & Rubio, L. (2010). A common currency for the different ways in which patches and links can contribute to habitat availability and connectivity in the landscape. Ecography, 33, 523–537. doi:10.1111/j.1600-0587.2009.05760.x
- Saura, S., & Torné, J. (2009). Conefor Sensinode 2.2: A software package for quantifying the importance of habitat patches for landscape connectivity. Environmental Modelling & Software, 24, 135–139. doi:10.1016/j.envsoft.2008.05.005
- Saura, S., Vogt, P., Velázquez, J., Hernando, A., & Tejera, R. (2011a). Key structural forest connectors can be identified by combining landscape spatial pattern and network analyses. Forest Ecology and Management, 262, 150–160. doi:10.1016/j.foreco.2011.03.017
- Schmid, M.S., Aubry, C., Grigor, J., & Fortier, L. (2016). The LOKI underwater imaging system and an automatic identification model for the detection of zooplankton taxa in the Arctic Ocean. Methods in Oceanography, 15-16(129–160). doi:10.1016/j.mio.2016.03.003
- Seebach, L., Strobl, P., Vogt, P., Mehl, W., & San-Miguel-Ayanz, J. (2013). Enhancing post-classification change detection through morphological post- processing – a sensitivity analysis. International Journal of Remote Sensing, 34(20), 7145–7162. doi:10.1080/01431161.2013.815382
- Soille, P. (1994). Generalized geodesy via geodesic time. Pattern Recognition Letters, 15(12), 1235–1240. doi:10.1016/0167-8655(94)90113-9
- Soille, P. (2004). Morphological image analysis: Principles and applications (2nd ed.). Berlin: Springer-Verlag. doi:10.1007/978-3-662-05088-0
- Soille, P., & Vogt, P. (2009). Morphological segmentation of binary patterns. Pattern Recognition Letters, 30, 456–459. doi:10.1016/j.patrec.2008.10.015
- Steffen, W., Sanderson, A., Tyson, P., Jäger, J., Matson, P., Moore, B., III, … Wasson, R. (2004). Global change and the earth system: A planet under pressure. ISBN 91-631-5380-7. Springer, Berlin.
- Turner II, B.L., Lambin, E.F., & Reenberg, A. (2007). The emergence of land change science for global environmental change and sustainability. Proceedings of the National Academy of Sciences, 104, 20666–20671. doi:10.1073/pnas.0704119104
- Turner, M.G. (2005). Landscape ecology: What is the state of the science? Annual Review of Ecology, Evolution, and Systematics, 36, 319–344. doi:10.1146/annurev.ecolsys.36.102003.152614
- Vogt, P. (2015). Quantifying landscape fragmentation. In A. João Pessoa (Eds.), Simpósio brasileiro de sensoriamento remoto, 17. (SBSR), 2015 (pp. 1239–1246). São José dos Campos: INPE. Internet. ISBN 978-85-17-0076-8. Retrieved from http://urlib.net/8JMKD3MGP6W34M/3JM47SP
- Vogt, P., Ferrari, J.R., Lookingbill, T.R., Gardner, R.H., Riitters, K.H., & Ostapowicz, K. (2009). Mapping functional connectivity. Ecological Indicators, 9, 64–71. doi:10.1016/j.ecolind.2008.01.011
- Vogt, P., Riitters, K.H., Estreguil, C., Kozak, J., Wade, T.G., & Wickham, J.D. (2007b). Mapping spatial patterns with morphological image processing. Landscape Ecology, 22, 171–177. doi:10.1007/s10980-006-9013-2
- Vogt, P., Riitters, K.H., Iwanowski, M., Estreguil, C., Kozak, J., & Soille, P. (2007a). Mapping landscape corridors. Ecological Indicators, 7, 481–488. doi:10.1016/j.ecolind.2006.11.001
- Warmerdam, F. (2009). FWTools: Open source GIS binary kit for Windows and Linux. Retrieved from http://fwtools.maptools.org
- Wickham, J.D., & Norton, D.J. (1994). Mapping and analyzing landscape patterns. Landscape Ecology, 9, 7–23. doi:10.1007/BF00135075
- Wickham, J.D., Riitters, K.H., Wade, T.G., & Vogt, P. (2010). A national assessment of green infrastructure and change for the conterminous United States using morphological image processing. Landscape and Urban Planning, 94, 186–195. doi:10.1016/j.landurbplan.2009.10.003