
ABSTRACT
Multi-sensor data fusion has become more and more popular for classification applications. The fusion of multisource remote-sensing data can provide more information about the same observed site results in a superior comprehension of the scene. In this field of study, a combination of very high-resolution data collected by a digital color camera and a new coarse resolution hyperspectral data in the long-wave infrared range for urban land-cover classification has been extensively enticed much consideration and turned into a research hot spot in image analysis and data fusion research community. In this paper, a decision-based multi-sensor classification system is proposed to completely use the advantages of both sensors to attain enhanced land-cover classification results. In this context, spectral, textural and spatial features are extracted for the proposed multilevel classification. Then, a land-cover separability preprocessing is employed to identify how the proposed method can fully utilize the sensor advantages. Next, a support vector machine is applied to classify road classes by using thermal hyperspectral image data; plants, roofs and bare soils are classified by the joint use of sensors via Dempster–Shafer classifier fusion. Finally, an object-based post-processing is employed to improve the classification results. Experiments carried out on the dataset of 2014 IEEE GRSS data fusion contest indicate the superiority of the proposed methodology for the potentialities and possibilities of the joint utilization of sensors and refine the classification outcomes when evaluated against single sensor data. Meanwhile, the obtained classification accuracy can be a competitor against the results issued by the 2014 IEEE GRSS data fusion contest.
Introduction
With recent technological advances in remote-sensing systems and the accessibility of multi-sensor information, the research community has motivated an increasing utilization of well-defined features measured by various sensors to obtain an improved classification accuracy of remotely sensed data (S. Bigdeli, Samadzadegan, & Reinartz, Citation2013; Li, Wu, Wan, & Zhu, Citation2011; Lu, Zhang, Li, & Zhang, Citation2015). Fusion of multi-sensor data provides complementary data from the same observed site results in a superior comprehension of the scene which is impossible with single sensor data (Bigdeli, Samadzadegan, & Reinartz, Citation2014; Du, Liu, Xia, & Zhao, Citation2013; Lu et al., Citation2015). In this regard, image analysis and data fusion play several roles in image pansharpening (Guo, Zhang, Li, Zhang, & Shen, Citation2014; Thomas, Ranchin, Wald, & Chanussot, Citation2008; Wald, Citation1999), classification (Camps-Valls, Tuia, Bruzzone, & Benediktsson, Citation2014; Fauvel, Tarabalka, Benediktsson, Chanussot, & Tilton, Citation2013; Plaza et al., Citation2009; Huang & Zhang, Citation2012a), change detection (Bruzzone & Bovolo, Citation2013; Huang, Zhang, & Zhu, Citation2014; Tian & Reinartz, Citation2011), large-scale processing (Blanchart, Ferecatu, Cui, & Datcu, Citation2014; Espinoza-Molina & Datcu, Citation2013), multiple resolution (Voisin, Krylov, Moser, Serpico, & Zerubia, Citation2014; Wemmert, Puissant, Forestier, & Gancarski, Citation2009), domain adaption (Bruzzone & Marconcini, Citation2009; Persello & Bruzzone, Citation2012; Tuia, Volpi, Trolliet, & Camps-Valls, Citation2014), interactive systems (Crawford, Tuia, & Yang, Citation2013; Tuia, Volpi, Copa, Kanevski, & Munoz-Mari, Citation2011) and signal modalities fusion with different meaning and features (Moser, Serpico, & Benediktsson, Citation2013). Among the mentioned fusion tasks, urban area classification is one of the most challenging issues due to land-cover kinds’ complexity and diversity of man-made objects and therefore attracts a lot of research interests (Lu et al., Citation2015; J. Li et al., Citation2015). Remotely sensed data fusion can be conducted at signal, pixel, feature and decision levels. Signal level fusion combines various signal modalities to make an enhanced signal with a superior signal-to-noise ratio (SNR). At pixel level fusion, pixel information is fused to refine image analysis potentialities. Feature level fusion integrates distinctly extracted descriptors into a concatenated feature vector to be used by a conventional classifier. At decision level fusion, numerous classifiers are fused regardless of data types and data misalignment errors (Du et al., Citation2013).
With recent technological advances in remote-sensing systems, fusion of very high-resolution data collected by a digital color camera and a new coarse resolution hyperspectral data in the long-wave infrared (LWIR) range for urban land-cover classification has been extensively enticed much consideration and turned into a research hot spot in image analysis and data fusion research community (Liao et al., Citation2015; Lu et al., Citation2015; Eslami & Mohammadzadeh, Citation2015; J. Li et al., Citation2015). In this context, thermal infrared hyperspectral (TIR HS) data represent extremely challenging remotely sensed data with numerous potentialities in target recognition and material classification irrespective of illumination conditions (Liao et al., Citation2015); these data show very high potentialities in many circumstances, e.g. for remote-sensing and non-destructive technologies which provide an exhaustive discrimination of similar ground entities (Lu et al., Citation2015; Wang, Wu, Nerry, Li, & Li, Citation2011). Nevertheless, low energy, low SNR, high inter-band correlation, spectral variation and ambiguous object boundaries are the most challenging problems which can seriously affect the classification efficiency (S. Li et al., Citation2011; Rodríguez-Galiano, Ghimire, Pardo-Igúzquiza, Chica-Olmo, & Congalton, Citation2012 ; Miliaresis, Citation2014; J. Li et al., Citation2015). On the other hand, visible image data provide detailed spatial features and clarity. However, low distinctive spectral features result in an inability to distinguish homogeneous spectral objects.
The physical background of the LWIR HS data is the basic spectral absorption features of silicate minerals, which are the most constituent of the terrestrial surface and man-made construction objects. The silicon–oxygen bonds of the silicate minerals (Si–O) cannot exhibit spectral features in the visible-to-shortwave infrared region of the spectrum, while the Si–O bonds’ stretching vibrations expand strong significant features in the LWIR spectral wavelengths. Man-made objects additionally emit a greater extent polarized infrared radiation than naturally derived background materials (i.e. tree, soil and vegetation), because they have relatively smooth surface features compared to most naturally occurring surfaces. In this context, the emissivity can parametrically suffice if surface irregularities are large compared to the emitted radiation’s wavelength. However, if surface irregularities are small compared to the emission wavelength, the surface may be more specular and an observable induced polarization occurs in the emitted thermal radiation. The basic principles can be employed for the development of spectral-based urban classification/un-mixing of man-made objects by LWIR HS data (Liao et al., Citation2015).
In this paper, a decision-based multi-sensor classification system is proposed to completely use the advantages of both sensors to attain enhanced land-cover classification results. In this context, spectral, textural and spatial (STS) features are extracted for the proposed multilevel classification. Then, a land-cover separability preprocessing is employed to identify how the proposed method can fully utilize the sensor advantages. Next, a support vector machine (SVM) is applied to classify road classes by using TIR HS image data; plants, roofs and bare soils are classified by the joint use of sensors via Dempster–Shafer (D–S) classifier fusion. Finally, an object-based post-processing (OBPP) is employed to improve the classification results.
The rest of the paper is organized as follows: After a literature review, the concept of the proposed decision-based multi-sensor fusion system is presented, followed by experiments, obtained results, discussion and conclusion.
Literature review
The image analysis and data fusion technical committee of the geoscience and remote-sensing society (GRSS) is an international network of scientists who are active in multi-temporal, multisource, multi-resolution and multimodal remote-sensing image analysis fields, released two airborne datasets collected at various spectral and spatial modalities with a concise temporal interval to deal with two open image analysis and data fusion research community problems comprising of handling multiple source and multiple resolution data in two parallel identical validity tracks. The classification contest concentrated on classification performance outcome at the highest spatial modalities with recent kinds of sensors, while the paper contest was regarded as new ideas of the multi-resolution data processing and analysis of the new TIR HS imagery. In this context, the classification contest’s winning manuscript was focused on maximizing the land-cover mapping’s accuracy for a particular dataset. In this study, both datasets were resampled to 0.5-m spatial resolution. A principal component analysis (PCA) was employed on TIR HS image data to reduce redundancy and computation time for image classification. Then, textural features, vegetation index and morphological building index were extracted to identify successively required classes using a binary SVM (Huang & Zhang, Citation2012b). Finally, the obtained pixel-based land-cover classification map was refined by majority voting (MV), adaptive mean shift segmentation and multiple semantic rule. On the other side, the paper contest’s winning manuscript was focused on the novel development for mutually taking profits from both datasets. In this respect, morphological features were extracted from the visible imagery; the visible image was utilized as a part of a guided filtering scheme to increase the LWIR image’s spatial separability in the PCA domain. Then, the extracted features and enhanced LWIR data were integrated by using a graph-based method. Finally, the feature combination was used to generate the final land-cover classification map with an SVM classifier. As the last point, the classification contest’s winner modified the primary land-cover classification map using impressive production-like points and obtained maximal classification accuracy, while the paper contest winner’s focus turned into the novel development with less emphasis on the land-cover classification map’s geometrical precision (Liao et al., Citation2015).
After the contest, the data remain publicly available for further experimental analysis;Footnote1 Lu et al. (Citation2015) proposed a synergetic decision-based classification method to estimate a thematic classification map for the mentioned datasets. First, a set of preprocessing steps was carried out on both datasets. Next, a semi-supervised local discriminant analysis was applied to identify distinguish descriptors for an SVM classifier. A combination of texture and spectral features was used for visible image classification. Finally, the outcomes of both SVM classifiers were fused to estimate the thematic classification map. The obtained results of the study confirmed an enhancement of the proposed synergic decision-based classification method against the standard classifiers or any single sensor’s classification outcome.
Eslami and Mohammadzadeh (Citation2015) proposed an integration method to classify urban objects for the 2014 IEEE GRSS data fusion contest datasets. First, TIR HS image’s atmospheric effects were removed by the in-scene atmospheric compensation as described in (Winter, Citation2004). Then, the sequential parametric projection pursuit dimension reduction (DR) operator was used to achieve multispectral TIR image data at 20-cm spatial resolution. An SVM classifier was employed to classify integrated visible and multispectral TIR images. Finally, an object rule-based post-processing was applied to generate the final classification map. The obtained results of this study proved the advantages of the proposed method against the standard classifiers or any single sensor’s classification outcome.
Li et al. (Citation2015) proposed another fusion approach for the mentioned datasets to attain enhanced urban land-cover classification map. In this study, the proposed method was composed of data preprocessing, road extraction and remaining classes classification. In the preprocessing step, TIR HS data were de-noised by using a low-rank matrix recovery. In parallel, visible data gaps were predicted by utilizing the mapping relationship between the visible and LWIR HS data in a supervised fashion. In the road extraction step, a linear SVM classifier was employed to classify road pixels by the use of TIR HS imagery. A mean shift algorithm was applied to segment the visible image; further, a MV approach was utilized to achieve object-oriented fusion results guided by the clusters of the segmentation map. Finally, the morphological dilation operation was conducted to refine extracted road pixels of the TIR HS image. In the remaining class classification step, the fine spatial resolution visible data were used to be classified using a linear SVM classifier. After the classification, the segmentation map was utilized as an object-based decision fusion step to conduct the post-classification process. The obtained results of this study demonstrated the advantages of the proposed method.
In the above-described papers, different ways were proposed to combine the 2014 IEEE GRSS data fusion contest datasets; they considered fascinating innovations in terms of development novelty or urban land-cover mapping applications. The significant challenge was the contrivance of a combined classification architecture that is a trade-off between accuracy enhancement and land-cover classification solution’s reliability, complexity reduction and processing proficiency optimization. In addition, the architecture was extremely constrained by the demand to integrate data from multiple source and at multiple resolution. The interpretation of this new dataset combination remains quite challenging and therefore is still a focus of research activities. The most important challenges that should be considered in the integration architecture are as follows (J. Li et al., Citation2015): (a) the TIR HS image’s low energy and low SNR can hinder the extraction of distinctive descriptors; (b) excessive inter-band correlation of TIR HS image indicates considerable descriptor redundancy and a very time-consuming image classification process (S. Li et al., Citation2011); (c) various descriptors for identical land-cover objects collected by LWIR HS at different times are possible (Miliaresis, Citation2014); (d) TIR HS ambiguous object boundaries can severely affect the classification accuracy at the highest spatial resolution (Rodríguez-Galiano et al., Citation2012) and (e) visible data interpretation can also be difficult due to severe interclass variations (Liao et al., Citation2015).
In order to tackle the abovementioned challenges, a decision-based multi-sensor classification system is proposed to completely use the advantages of both sensors to attain enhanced urban land-cover classification results.
Proposed method
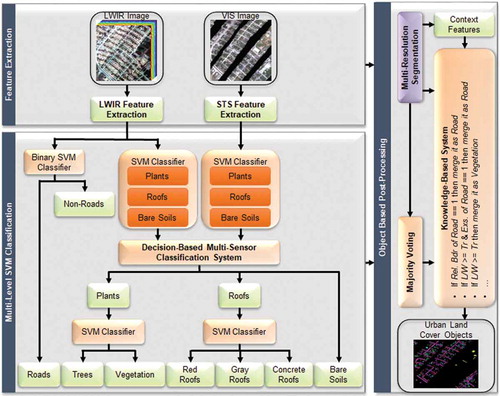
The proposed methodology is a combined architecture which can be valued as a trade-off between accuracy enhancement and land-cover classification solution’s reliability, complexity reduction and processing proficiency optimization (); preprocessing, feature extraction, multilevel SVM classification (MLSC) and OBPP are employed as shown in the following sections.
Figure 1. The proposed workflow for sensor fusion.
Preprocessing
The first step of the multilevel classification process is to analyze the land-cover spectral separability of the training dataset, as it can be used as a foundation to enhance the classification accuracy. In this context, the Jeffries–Matusita distance (JMD) and the transformed divergence (TD) indices, the most widely used discriminability evaluation indices, are estimated to identify how the proposed method can fully utilize the advantages of the 2014 IEEE GRSS data fusion contest datasets (). From , first, it can be observed that the road pixels can be easily classified by utilizing the TIR HS imagery due to the strong separability of the road and other land-cover classes. Second, plant (tree/vegetation), roof (red/gray/concrete roofs) and bare soil classes are discriminated by the fusion of both visible and TIR HS datasets. For the TIR HS image data, it can be observed that the internal plant classes (tree and vegetation) show weak separability, and similar observation can be made for the internal roof classes (red, gray and concrete roofs) as marked in ; in this context, tree and vegetation pixels are separated within the plant pixels by utilizing the visible image data and the same operation is employed to classify red, gray and concrete roofs within the roof pixels. As a summary, the proposed multilevel classification framework contains the following operations: (a) road pixels’ classification by utilizing the TIR HS imagery; (b) plant, roof and bare soil pixels’ discrimination by the fusion of both visible and TIR HS imageries and (c) land-cover pixels’ separation by utilizing the visible imagery. illustrates the procedure of utilizing the 2014 IEEE GRSS data fusion contest datasets to obtain maximum classification accuracy based on the spectral separability analysis.
Table 1. JMD/TD discriminability evaluation indices for the 2014 IEEE GRSS data fusion contest datasets.
Table 2. The procedure of utilizing the 2014 IEEE GRSS data fusion contest datasets.
Feature extraction
The next phase of the classification procedure for the multi-sensor data consists of extracting appropriate descriptors. The extracted features should comprise distinct descriptors to separate several objects (). Hyperspectral remote-sensing images consist of extremely narrow spectral bands that result in high inter-band correlation and time-consuming image analysis operations; excessive descriptors can lead to the curse of dimensionality problem, also called Hughes phenomenon, in case of using standard classifiers (S. Bigdeli et al., Citation2013; Li et al., Citation2011). In this context, DR is used to transform the data volume into a reduced dimensionality form with distinct descriptor information to overcome the mentioned phenomenon (Hasanlou, Samadzadegan, & Homayouni, Citation2015). In this regard, PCA, the most widely known linear technique for data volume reduction, is applied to reduce the high dimensionality of TIR HS imagery and the first five principal components (PCs) are extracted as spectral features on the TIR HS data. Furthermore, the gray value of the image and its spatial distribution in a local window can be used as spectral and textural descriptors of the visible data (Haralick & Shanmugam et al., Citation1973). After extraction of the above features, a multilevel classification framework is performed by considering the above-described land-cover spectral separability analysis.
Table 3. Basic mathematics of STS descriptors.
Multi-level SVM classification
In the proposed multilevel classification strategy, a progressive multiple procedure classification model is applied on the extracted features in order to be a trade-off between accuracy enhancement and land-cover classification reliability, complexity reduction and processing proficiency optimization; a progressive process composed of multiple step as described in the following sections.
In the first step, the road pixels are classified by using the first five PCs due to the strong separability of the road and other land-cover classes as described in the preprocessing step. Among the various supervised classifiers, an SVM is an encouraging and well-documented methodology because of its simple utilization, supreme efficiency and ability to handle different issues (Abe, Citation2010; Lu et al., Citation2015). An SVM maximizes the predefined classes’ discrepancy using optimal separating hyperplane estimation. A linear decision function is applied to transform nonlinearly separable data into a higher dimensional space using SVM kernel functions. In this paper, the most well-known SVM kernel function, radial basis function, is used to estimate inner products among any sample pairs in the feature space. As the SVM parameters, composed of regularization parameter (C), defines a trade-off between the training error and the model complexity minimization, and the kernel bandwidth parameters (γ), have strong effects on its classification efficiency, grid search is employed to automatically estimate the optimum regularization and kernel parameters (Chang & Lin, Citation2011).
In the next step, plants, roofs and bare soils are discriminated by the fusion of both data source information. In this paper, a multi-SVM system is applied to classify each data source features and then a multi-classifier system is taken on the decision level to integrate the SVM classification results. Decision level fusion is commonly determined as the procedure of combining single source data results in an enhanced classifier in comparison with any single classifiers that create the ensemble (Kuncheva, Citation2004). In this context, the proposed multiple SVM system uses one SVM classifier for each data source features which is adjusted according to the corresponding data information, while standard methods employ one SVM classifier for the series combination of the whole data source features that cannot be adjusted to the entire data. Among the various decision level fusion techniques, D–S theory can demonstrate and combine uncertain data, as it may integrate objective evidence for a hypothesis by the framework’s expectation of the significance of that evidence to the hypothesis (Lu et al., Citation2015). The following steps are carried out to illustrate how the D–S algorithm combines c individual classifiers (Kuncheva, Citation2004; Rogova, Citation1994):
The “proximity” Φ is calculated between DTi and the classifier’s output Di for the input x as
DTi is the ith decision template’s row DTj.
Di(x) is the ith decision profile’s row DP(x).
The following belief degrees are determined for each class, j = 1,…,c and for each classifier, i = 1,…,L as
The final degree of support is estimated as
K is a normalizing constant.
In the final step, land-cover classes are separated by using the visible data source features as described in the preprocessing step. In this context, an SVM classifier is applied to classify tree versus vegetation from the extracted plant pixels. The same procedure is used to classify red, gray and concrete roofs from the extracted roof pixels. Meanwhile, grid search is employed before the mentioned procedure to automatically estimate the optimum regularization and kernel SVM parameters.
Object-based post-processing
There can be several outlier pixels (wrongly classified pixels) and a spatial coherency deficiency caused by the problem of excessive heterogeneity in the standard pixel-based classification techniques. Image segmentation is used to eliminate the salt and pepper noise or points commonly created by “the same object but different spectrum” or “the same spectrum but different objects”. It makes utilization of the mentioned STS descriptors to split an image into spatially uninterrupted disjoint and un-overlapping alike zones (Lu et al., Citation2015). In this paper, multi-resolution segmentation technique is applied to segment the data into regions. The multi-resolution segmentation algorithm starts with one pixel as single image objects and frequently combines an image objects pair into larger single entities. The combination decision is based on a local homogeneity criterion, defining the likeness among contiguous image objects (Baatz and Schäpe Citation2000). After performing segmentation, a MV should be employed on each of the segmented regions to make the final label outputs decision (Kuncheva, Citation2004).
In the final step, the spatial relationship between classes is investigated and the following semantic rules are employed to refine the land-cover classification results ().
Table 4. Classification map refinement (CMR) semantic rules.
Experiments and results
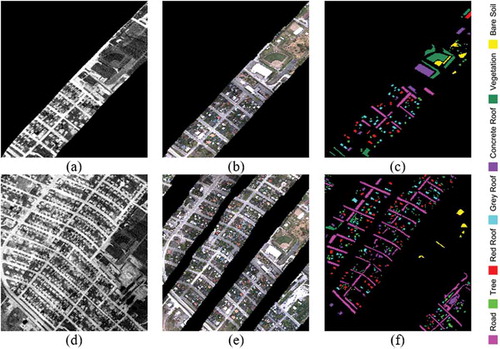
The proposed decision-based multi-sensor fusion system is evaluated using the released 2014 IEEE GRSS data fusion contest datasets comprising two airborne datasets collected at two spectral and spatial modalities with a concise temporal interval: (a) TIR HS imagery with approximately 1-m resolution; (b) visual data with approximately 0.1-m resolution that was spatially down-sampled into 0.2-m resolution to optimize multiple resolution ratio (). The contest datasets were acquired by two different fixed-wing aircrafts at approximately 800-m flight height on 21 May 2013 by Telops Inc., Québec, Canada.Footnote2 Furthermore, the flights were performed over an urban area at a short distance away from Thetford Mines in Québec, Canada, containing commercial and residential structures, gardens and roads.
Figure 2. The 2014 IEEE GRSS data fusion contest dataset: first row illustrates the subset of the data prepared for training: (a) LWIR image data (1-m resolution); (b) visible image data (20-cm resolution); (c) training labels. The second row denotes the data published for testing: (d) LWIR image data; (e) visible image data and (f) ground truth.
The TIR HS image was collected by utilizing the recent airborne LWIR HS imager “Hyper-Cam” which is a Fourier transform spectrometer (FTS) comprising 84 spectral narrow bands in the 7.8–11.5-µm wavelength range. The visible data were composed of un-calibrated digital data at the highest spatial resolution with sparse ground coverage over the same area as the LWIR HS imagery. The visible data were georeferenced to be aligned into the LWIR HS image’s coordinate system ().
The provided multi-sensor dataset presents some challenging problems which can seriously affect the classification efficiency, including (a) low energy, low SNR, high inter-band correlation, spectral variation and ambiguous object boundaries in TIR HS imagery; (b) spatial gaps in visible data.
As shown in ), the training samples represent obvious spatial correlation which reveal significant spatial redundancy causing over-fitting issues.
As can be seen in ), the ambiguous boundaries of land objects can affect thermal image interpretation at a fine spatial resolution.
The existing spatial gaps between the sequentially acquired visible data strips can decrease the spatial descriptors efficiency ()).
Furthermore, there are several outlier pixels and a spatial coherency deficiency caused by the problem of excessive heterogeneity due to “the same object but different spectrum” or “the same spectrum but different objects”.
) shows thermal mean spectra of each class where the horizontal axis indicates the number of thermal bands and the vertical axis represents the radiant energy. It can be seen that the maximum vertical value is less than 0.12, which illustrates extremely bounded radiant energy.
The excessive inter-band correlation indicates considerable descriptor redundancy in the thermal data.
As shown in ), there is a radiant energy discrepancy across the flight direction between the sequentially acquired thermal data strips due to environmental changes, while the visible data remain relatively stable as shown in ).
In the first step of the presented methodology, JMD/TD indices were estimated using Envi software to analyze the land-cover spectral separability of the training dataset (). Following that, STS features () were employed on both data to determine the feature space ().
Figure 3. The 2014 IEEE GRSS data fusion contest dataset: (a) thermal mean spectrum; (b) the 80th band of thermal data and (c) the 82th band of thermal data.
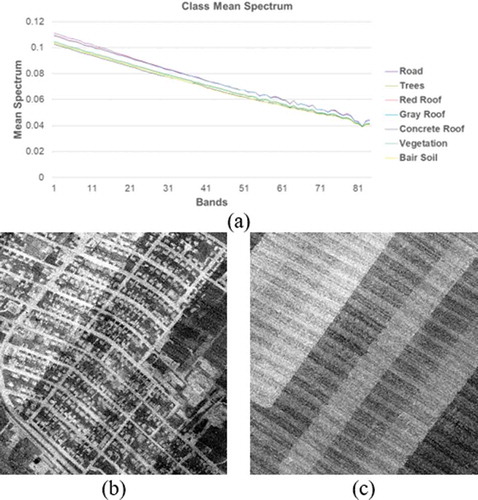
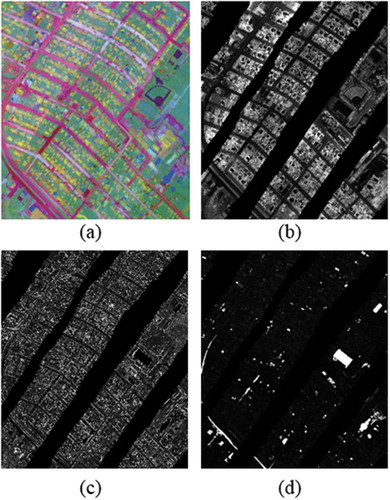
Figure 4. STS features on the 2014 IEEE GRSS data fusion contest dataset: (a) PCA-LWIR; (b) VI; (c) variance and (d) homogeneity.
After determination of abovementioned feature space, the proposed progressive processing model was used by considering the land-cover spectral separability analysis. Then, the multi-resolution segmentation algorithm was performed using eCognition software with the values 25, 0.3 and 0.5 for the scale, compactness and shape parameters. After that, MV was employed on each of the segmented regions to make the final label outputs decision. Finally, the spatial relationship among land covers () was considered to refine the classification results. In this section, the efficiency of the proposed method is assessed via a single experiment. The following objectives of the methodology are considered:
the effectiveness of STS features to enhance the classification accuracy,
the effectiveness of the multilevel classification method to utilize the pros of multi-sensor data,
the effectiveness of the knowledge-based system to tackle the common challenges of traditional pixel-based classification methods, and
the comparison of the obtained results with the methods evaluated in the 2014 IEEE GRSS data fusion contest.
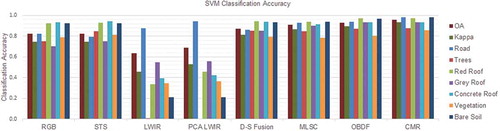
First, the effect of the extracted visible STS features is investigated through the visible data classification results ( and ). It can be seen that the classification performance coefficients are still identical (OA/kappa: 0.82/0.75) while the accuracies of most classes have been increased effectively; STS features can obtain much better accuracies of the plant (tree/vegetation: 0.85/0.82) and gray roof (0.75) classes via the generated distinguishing descriptors. presents the confusion matrix of the experiment using the extracted visible STS features to enhance land-cover classification.
Table 5. SVM classification accuracy.
Table 6. Confusion matrix of the STS-based classification – visible.
Figure 5. SVM classification accuracy.
After this step, the effect of the extracted LWIR STS features is investigated by the TIR HS data classification results ( and ). It can be summarized that the PCA-LWIR classification method improves the classification coefficients (OA/kappa: 0.69/0.53) via inter-band correlation reduction. Also, it can be observed that the accuracies of all classes have been increased effectively. displays the confusion matrix of the test by utilizing the PCA-LWIR features.
Table 7. Confusion matrix of the STS-based classification – PCA-LWIR.
Second, the effect of the MLSC method is investigated through the D–S combining STS-based classification results ( and ). From the classification accuracy viewpoint, the two strategies resulted in satisfactory accuracies when compared with individual classification results. In more detail, the overall results clearly demonstrate that the proposed progressive processing model outperforms the STS-based data fusion method in terms of classification accuracy; the MLSC strategy represents the best classification performance coefficients (OA/kappa: 0.91/0.87) that was caused by accuracy improvement of D–S fusion strategy with up to 4% for OA and 6% for kappa coefficient. The proposed MLSC method can improve the classification accuracies of the road (0.93) and gray roof (0.90) classes by considering the land-cover spectral separability analysis (). displays the confusion matrix of the experiment using the MLSC method.
Table 8. Confusion matrix of the MLSC method.
Third, the effect of the knowledge-based system is perused to investigate how the proposed strategy tackles the common challenges of traditional pixel-based classification methods ( and ). MV strategy leads to an even better classification accuracy (OA/kappa: 0.93/0.89) that represents an accuracy improvement of the MLSC strategy by up to 2% for the classification performance coefficients. Furthermore, it can be seen that the accuracies of all classes have been enhanced effectively via MV on multi-resolution segmented regions. As a consequence, the semantic rules can improve the classification accuracy (OA/kappa: 0.96/0.93) which still enhance MV strategy by up to 4% for the kappa coefficient. Hereby, the accuracies of all classes have been enhanced effectively via considering the spatial relationship between extracted classes. demonstrates the confusion matrix of the experiment using the OBPP.
Table 9. Confusion matrix of the OBPP method.
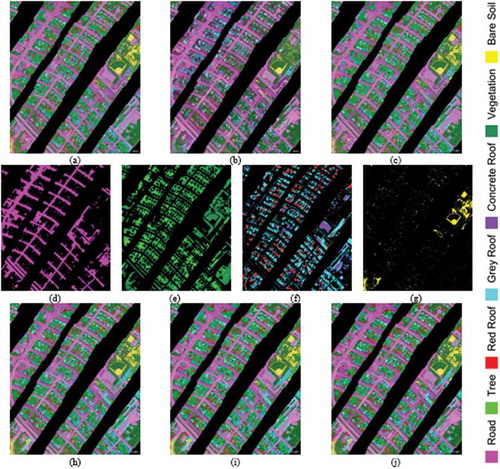
The obtained results confirm that the proposed decision-based multi-sensor classification system exhibits a superior performance compared to the conventional classification methods or any individual classification result. illustrates the obtained classification maps of the 2014 IEEE GRSS data fusion contest datasets.
Figure 6. SVM classification maps: (a) STS; (b) PCA-LWIR; (c) D–S fusion; (d) MLSC – roads; (e) MLSC – plants; (f) MLSC – roofs; (g) MLSC – bare soils; (h) MLSC; (i) MV and (j) CMR.
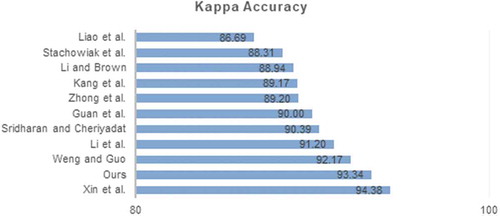
Fourth, the proposed classification method is in a higher rank place than the majority of the participating teams regarding the comparison of the obtained results with the top 10 papers presented in the 2014 IEEE GRSS data fusion contest. This comparison is performed under the same condition, i.e. same training and testing datasets prepared by Telops Inc. ().
Figure 7. Kappa comparison of the proposed method with the top 10 techniques evaluated in the 2014 IEEE GRSS data fusion contest.
Conclusion
This paper represents a decision-based multi-sensor classification system for LWIR HS and visible images to produce a classification map at the spatial resolution of the visible data. In the proposed method, a combination architecture is used to be a trade-off between accuracy enhancement and land-cover classification solution’s reliability, complexity reduction and processing proficiency optimization. In this context, STS features are extracted for the proposed multilevel classification. Then, a land-cover separability preprocessing is employed to identify how the proposed method can fully utilize the advantages of both sensors. Next, an SVM is applied to classify road classes by using thermal hyperspectral image data; plants, roofs and bare soils are classified by the joint use of both sensors via D–S classifier fusion. Finally, an OBPP is employed to improve the classification results. The proposed method is evaluated with respect to the potentiality of STS features to enhance the classification accuracy, the effectiveness of the multilevel classification methodology to utilize the pros of multi-sensor data, the effectiveness of the knowledge-based system to tackle the common challenges of traditional pixel-based classification methods and the comparison of the obtained results to the methods presented in the 2014 IEEE GRSS data fusion contest. As a conclusion, the decision-based multi-sensor fusion system yields a higher classification performance coefficient against single source images and is indicated to be an encouraging method against the top 10 techniques evaluated in the 2014 IEEE GRSS data fusion contest. Furthermore, the land-cover classification map shows a superior objective result and turns out to be more reliable toward human perception. Future studies will focus on the context-aware decision level fusion.
Acknowledgments
The authors would like to thank Telops Inc. (Québec, Canada) for acquiring and providing the data used in this study, the IEEE GRSS Image Analysis and Data Fusion Technical Committee and Dr. M. Shimoni (Signal and Image Centre, Royal Military Academy, Belgium) for organizing the 2014 Data Fusion Contest, the Centre de Recherche Public Gabriel Lippmann (CRPGL, Luxembourg) and Dr. M. Schlerf (CRPGL) for their contribution of the Hyper-Cam LWIR sensor and Dr. M. De Martino (University of Genoa, Italy) for her contribution in data preparation.
Disclosure statement
No potential conflict of interest was reported by the authors.
Notes
2 Available: http://www.telops.com.
References
- Abe, S. (2010). Support vector machines for pattern classification. Springer Science & Business Media. doi:10.1007/978-1-84996-098-4
- Baatz, M., & Arno, S. (2000). Multiresolution segmentation: An optimization approach for high quality multi-scale image segmentation. Angewandte Geographische Informationsverarbeitung XII, 58, 12–427.
- Bigdeli, B., Samadzadegan, F., & Reinartz, P. (2013). A multiple SVM system for classification of hyperspectral remote sensing data. Journal of the Indian Society of Remote Sensing, 41(4), 763–776. doi:10.1007/s12524-013-0286-z
- Bigdeli, B., Samadzadegan, F., & Reinartz, P. (2014). A decision fusion method based on multiple support vector machine system for fusion of hyperspectral and LIDAR data. International Journal of Image and Data Fusion, 5(3), 196–209. doi:10.1080/19479832.2014.919964
- Blanchart, P., Ferecatu, M., Cui, S., & Datcu, M. (2014). Pattern retrieval in large image databases using multiscale coarse-to-fine cascaded active learning. IEEE Journal of Selected Topics in Applied Earth Observations and Remote Sensing, 7(4), 1127–1141. doi:10.1109/JSTARS.2014.2302333
- Bruzzone, L., & Bovolo, F. (2013). A novel framework for the design of change-detection systems for very-high-resolution remote sensing images. Proceedings of the IEEE, 101(3), 609–630. doi:10.1109/JPROC.2012.2197169
- Bruzzone, L., & Marconcini, M. (2009). Toward the automatic updating of land-cover maps by a domain-adaptation SVM classifier and a circular validation strategy. IEEE Transactions on Geoscience and Remote Sensing, 47(4), 1108–1122. doi:10.1109/TGRS.2008.2007741
- Camps-Valls, G., Tuia, D., Bruzzone, L., & Benediktsson, J.A. (2014). Advances in hyperspectral image classification: Earth monitoring with statistical learning methods. IEEE Signal Processing Magazine, 31(1), 45–54. doi:10.1109/MSP.2013.2279179
- Chang, C.-C., & Lin, C.-J. (2011). LIBSVM: A library for support vector machines. ACM Transactions on Intelligent Systems and Technology (TIST), 2(3), 27. doi:10.1145/1961189.1961199
- Crawford, M.M., Tuia, D., & Yang, H.L. (2013). Active learning: Any value for classification of remotely sensed data? Proceedings of the IEEE, 101(3), 593–608. doi:10.1109/JPROC.2012.2231951
- Du, P., Liu, S., Xia, J., & Zhao, Y. (2013). Information fusion techniques for change detection from multi-temporal remote sensing images. Information Fusion, 14(1), 19–27. doi:10.1016/j.inffus.2012.05.003
- Eslami, M., & Mohammadzadeh, A. (2015). Developing a spectral-based strategy for urban object detection from airborne hyperspectral TIR and visible data. IEEE Journal of Selected Topics in Applied Earth Observations and Remote Sensing, 9(5), 1808–1816. doi:10.1109/JSTARS.2015.2489838
- Espinoza-Molina, D., & Datcu, M. (2013). Earth-observation image retrieval based on content, semantics, and metadata. IEEE Transactions on Geoscience and Remote Sensing, 51(11), 5145–5159. doi:10.1109/TGRS.2013.2262232
- Fauvel, M., Tarabalka, Y., Benediktsson, J.A., Chanussot, J., & Tilton, J.C. (2013). Advances in spectral-spatial classification of hyperspectral images. Proceedings of the IEEE, 101(3), 652–675. doi:10.1109/JPROC.2012.2197589
- Guo, M., Zhang, H., Li, J., Zhang, L., & Shen, H. (2014). An online coupled dictionary learning approach for remote sensing image fusion. IEEE Journal of Selected Topics in Applied Earth Observations and Remote Sensing, 7(4), 1284–1294. doi:10.1109/JSTARS.2014.2310781
- Haralick, R.M., Shanmugam, K., et al. (1973). Textural features for image classification. IEEE Transactions on Systems, Man, and Cybernetics, 6, 610–621. doi:10.1109/TSMC.1973.4309314
- Hasanlou, M., Samadzadegan, F., & Homayouni, S. (2015). SVM-based hyperspectral image classification using intrinsic dimension. Arabian Journal of Geosciences, 8(1), 477–487. doi:10.1007/s12517-013-1141-9
- Huang, X., & Zhang, L. (2012a). A multilevel decision fusion approach for urban mapping using very high-resolution multi/hyperspectral imagery. International Journal of Remote Sensing, 33(11), 3354–3372. doi:10.1080/01431161.2011.591444
- Huang, X., & Zhang, L. (2012b). Morphological building/shadow index for building extraction from high-resolution imagery over urban areas. IEEE Journal of Selected Topics in Applied Earth Observations and Remote Sensing, 5(1), 161–172. doi:10.1109/JSTARS.2011.2168195
- Huang, X., Zhang, L., & Zhu, T. (2014). Building change detection from multitemporal high-resolution remotely sensed images based on a morphological building index. IEEE Journal of Selected Topics in Applied Earth Observations and Remote Sensing, 7(1), 105–115. doi:10.1109/JSTARS.2013.2252423
- Kuncheva, L.I. (2004). Combining pattern classifiers: Methods and algorithms. John Wiley & Sons. doi:10.1002/0471660264
- Li, J., Zhang, H., Guo, M., Zhang, L., Shen, H., & Du, Q. (2015). Urban classification by the fusion of thermal infrared hyperspectral and visible data. Photogrammetric Engineering & Remote Sensing, 81(12), 901–911. doi:10.14358/PERS.81.12.901
- Li, S., Wu, H., Wan, D., & Zhu, J. (2011). An effective feature selection method for hyperspectral image classification based on genetic algorithm and support vector machine. Knowledge-Based Systems, 24(1), 40–48. doi:10.1016/j.knosys.2010.07.003
- Liao, W., Huang, X., Van Coillie, F., Gautama, S., Pizurica, A., Philips, W., … Tuia, D. (2015). Processing of multiresolution thermal hyperspectral and digital color data: Outcome of the 2014 IEEE GRSS data fusion contest. IEEE Journal of Selected Topics in Applied Earth Observations and Remote Sensing, 8(6), 2984–2996. doi:10.1109/JSTARS.2015.2420582
- Lu, X., Zhang, J., Li, T., & Zhang, G. (2015). Synergetic classification of long-wave infrared hyperspectral and visible images. IEEE Journal of Selected Topics in Applied Earth Observations and Remote Sensing, 8(7), 3546–3557. doi:10.1109/JSTARS.2015.2442594
- Miliaresis, G.C. (2014). Daily temperature oscillation enhancement of multitemporal LST imagery. Photogrammetric Engineering & Remote Sensing, 80(5), 423–428. doi:10.14358/PERS.80.5.423
- Moser, G., Serpico, S.B., & Benediktsson, J.A. (2013). Land-cover mapping by markov modeling of spatial–contextual information in very-high-resolution remote sensing images. Proceedings of the IEEE, 101(3), 631–651. doi:10.1109/JPROC.2012.2211551
- Persello, C., & Bruzzone, L. (2012). Active learning for domain adaptation in the supervised classification of remote sensing images. IEEE Transactions on Geoscience and Remote Sensing, 50(11), 4468–4483. doi:10.1109/TGRS.2012.2192740
- Plaza, A., Benediktsson, J.A., Boardman, J.W., Brazile, J., Bruzzone, L., Camps-Valls, G., … Trianni, G. (2009). Recent advances in techniques for hyperspectral image processing. Remote Sensing of Environment, 113, S110–S122. doi:10.1016/j.rse.2007.07.028
- Rodríguez-Galiano, V.F., Ghimire, B., Pardo-Igúzquiza, E., Chica-Olmo, M., & Congalton, R.G. (2012). Incorporating the downscaled Landsat TM thermal band in land-cover classification using random forest. Photogrammetric Engineering & Remote Sensing, 78(2), 129–137. doi:10.14358/PERS.78.2.129
- Rogova, G. (1994). Combining the results of several neural network classifiers. Neural Networks, 7(5), 777–781. doi:10.1016/0893-6080(94)90099-X
- Thomas, C., Ranchin, T., Wald, L., & Chanussot, J. (2008). Synthesis of multispectral images to high spatial resolution: A critical review of fusion methods based on remote sensing physics. IEEE Transactions on Geoscience and Remote Sensing, 46(5), 1301–1312. doi:10.1109/TGRS.2007.912448
- Tian, J., & Reinartz, P. (2011). Multitemporal 3D change detection in urban areas using stereo information from different sensors. 2011 International Symposium on Image and Data Fusion (ISIDF) (pp. 1–4). doi:10.1109/ISIDF.2011.6024215
- Tuia, D., Volpi, M., Copa, L., Kanevski, M., & Munoz-Mari, J. (2011). A survey of active learning algorithms for supervised remote sensing image classification. IEEE Journal of Selected Topics in Signal Processing, 5(3), 606–617. doi:10.1109/JSTSP.2011.2139193
- Tuia, D., Volpi, M., Trolliet, M., & Camps-Valls, G. (2014). Semisupervised manifold alignment of multimodal remote sensing images. IEEE Transactions on Geoscience and Remote Sensing, 52(12), 7708–7720. doi:10.1109/TGRS.2014.2317499
- Voisin, A., Krylov, V.A., Moser, G., Serpico, S.B., & Zerubia, J. (2014). Supervised classification of multisensor and multiresolution remote sensing images with a hierarchical copula-based approach. IEEE Transactions on Geoscience and Remote Sensing, 52(6), 3346–3358. doi:10.1109/TGRS.2013.2272581
- Wald, L. (1999). Some terms of reference in data fusion. IEEE Transactions on Geoscience and Remote Sensing, 37(3), 1190–1193. doi:10.1109/36.763269
- Wang, N., Wu, H., Nerry, F., Li, C., & Li, Z.-L. (2011). Temperature and emissivity retrievals from hyperspectral thermal infrared data using linear spectral emissivity constraint. IEEE Transactions on Geoscience and Remote Sensing, 49(4), 1291–1303. doi:10.1109/TGRS.2010.2062527
- Wemmert, C., Puissant, A., Forestier, G., & Gancarski, P. (2009). Multiresolution remote sensing image clustering. IEEE Geoscience and Remote Sensing Letters, 6(3), 533–537. doi:10.1109/LGRS.2009.2020825
- Winter, E.M. (2004). Endmember-Based in-Scene Atmospheric Retrieval (EMISAR). In Proceedings. 2004 IEEE aerospace conference, 2004 (Vol. 3). IEEE. doi:10.1109/AERO.2004.1367962