
ABSTRACT
The heavy rain induced by Typhoon Talas in 2011 caused deep-seated catastrophic landslides on Kii Peninsula in the central part of Japan. Remote-sensing techniques play a key role in natural disasters in terms of quick response and mitigation. We propose a quick response method for landslide mapping using high-resolution satellite images. For synthetic aperture radar analysis, pre- and post-disaster COSMO-SkyMed images were used to detect the landslide areas on Kii Peninsula. We investigated the potential for landslide detection using backscattering coefficient difference and intensity correlation. The difference in the backscattering coefficient or the intensity correlation reflects the land-cover change between pre- and post-disaster images. We also investigated the effects of speckle noise reduction filtering and window size. The detected landslide areas were compared with the area detected by EROS-B, which has a very high-resolution optical sensor. The optimal value of the F-measure (61.24%) was obtained within a 37 × 37 window size using the intensity correlation, with a 5 × 5 window size Frost filter. The precision and recall were 65.39% and 57.58%, respectively. The results confirm that rapid detection of a landslide at the initial stage could be effectively achieved using pre- and post-disaster COSMO-SkyMed images.
Introduction
The heavy rain induced by Typhoon Talas caused landslides on Kii Peninsula in the central part of Japan in September 2011. The human toll included 82 people dead and 16 people missing because of the typhoon (Fire and Disaster Management Agency, Citation2014). Furthermore, 17 natural dams were formed by the deep-seated landslides. Japan’s Ministry of Land, Infrastructure, Transport, and Tourism (Ministry of Land, Infrastructure, Transport and Tourism Japan, Citation2011) and the MLIT Kinki regional development bureau (Ministry of Land, Infrastructure, Transport and Tourism Kinki regional development bureau, Citation2014) performed a quick investigation of the natural dams because of the possibility of upstream flooding as the lake rises and downstream flooding as a result of failure of the dam (Costa & Schuster, Citation1988). Rapid impact assessment after a disaster is crucial for initiating effective emergency response, rescue operations and disaster mitigation. However, it is often difficult for personnel to identify and approach these areas.
Remote-sensing techniques play a key role in natural disasters in terms of quick response and mitigation. Optical satellite images can provide landslide inventories (Guzzetti et al., Citation2012; Mondini, Chang, & Yin, Citation2011a; Mondini et al., Citation2011b; Nichol & Wong, Citation2005). In particular, very high-resolution (VHR) remote-sensing images can provide useful information such as the area of the damaged region and level of building damage (Yamazaki & Matsuoka, Citation2007; Yamazaki, Yano, & Matsuoka, Citation2005). However, landslide monitoring using optical sensors is often hampered by unfavourable weather conditions. In contrast, imaging by synthetic aperture radar (SAR) can provide effective information regarding the damaged disaster area, with its all-weather and day/night observation capabilities. In addition, the revisit time is crucial for rapid damage assessment. The constellation revisit time of the COSMO-SkyMed is within 12 h with different observing conditions (e.g. incidence angle, polarization). COSMO-SkyMed repeats the same ground track every 16 days; hence, the same target with same observing conditions is observed by a different satellite every 4 days (Agenzia Spaziale Italiana, Citation2007). ESAs Sentinel-1 SAR mission is targeted at operational applications using a two satellite constellation. The revisit time of Sentinel-1 A and B is 12 days. The two satellite constellation offers a 6-day repeat cycle (European Space Agency, Citation2013). These capabilities provide quick response and reliable disaster monitoring information.
SAR has the capability for obtaining both amplitude and phase backscattering echoes from the targets. The Differential Synthetic Aperture Radar Interferometry (DInSAR) technique can detect surface displacements over large areas, with centimetre to millimetre accuracy (Guzzetti et al., 2012; Massonnet et al., Citation1993; Strozzi et al., Citation2010). The DInSAR technique has been used in various landslide studies, not only for location detection but also for deformation monitoring (e.g. Calò et al., Citation2014; Cascini, Fornaro, & Peduto, Citation2009; Zhao, Lu, Zhang, & De La Fuente, Citation2012). However, the feasibility of the DInSAR technique depends on observation characteristics (e.g. coherence, wavelength, temporal and spatial baseline). The temporal baseline is the amount of time between the two SAR acquisitions. The spatial baseline is the distance between the two orbit paths at the time of acquisitions (Forster, Citation2006). Long temporal and spatial baselines lead to decorrelation of DInSAR. An interferometric coherence image is a cross-correlation product derived from two co-registered complex-valued SAR images. The pattern of decorrelation within an image can indicate surface modifications caused by flooding, wildfire, damage related to volcanic eruption or earthquake. Time-sequential interferometric coherence maps can be used to map the extent and progression of hazardous events (Lu, Dzurisin, Jung, Zhang, & Zhang, Citation2010). However, interferometric coherence also affected by temporal and spatial baselines.
The intensity correlation derived from SAR images acquired before and after disasters has been used to extract changes or damage caused by disasters. Yonezawa and Takeuchi (Citation2001) extracted the damaged areas caused by the 1995 Hyogoken-Nanbu (Kobe) earthquake using the intensity correlation or the interferometric coherence derived from multi-temporal SAR images. Matsuoka and Yamazaki (Citation2004) developed an automated method to detect hard-hit areas of the 1995 Hyogoken-Nanbu earthquake using the backscattering coefficient difference and intensity correlation between three ERS images. In addition, Plank (Citation2014) indicated that the intensity correlation is more sensitive to larger changes caused by more severe damage compared to the interferometric coherence. Moreover, the intensity correlation procedure still provides useful information for spatial baselines, which are too large for a useful interferometric coherence application.
Plank (Citation2014) reviewed rapid damage assessment by means of multi-temporal SAR images. He also reviewed the considerable literature on damage assessment concentrated in urban areas (e.g. Brett & Guida, Citation2013; Ito, Hosokawa, Lee, & Liu, Citation2000; Matsuoka & Yamazaki, Citation2005; Uprety & Yamazaki, Citation2012). On the other hand, there is little literature concentrated in mountainous areas (i.e. landslide monitoring), because mountainous areas covered with vegetation are low coherence and affected by foreshortening, layover and shadowing. For example, Zhao et al. (Citation2013) used ALOS/PALSAR intensity changes to estimate the area of a catastrophic rockslide event in China. However, SAR intensity images cannot delineate the whole area and source, scouring and deposit area affected by the rockslide as precisely as aerial photographs can. Yun et al. (Citation2015) demonstrated that a damage proxy map based on ALOS-2/PALSAR-2 coherence correctly delineated the extent of the debris from reported landslide/avalanche events in Langtang valley. Tessari, Floris and Pasquali (Citation2017) identified landslide areas using a stack of nine COSMO-SkyMed amplitude images. However, a detailed analysis of the intensity correlation or interferometric coherence for landslide detection using SAR imagery is generally not performed. Vegetation is one of the most common limitations in analysing landslide phenomena, because landslides generally occur on hilly and mountainous areas characterized by blooming vegetation (Tessari et al., Citation2017). There are large amounts of vegetation in mountainous areas of Japan. It should also be noted that analyses have been performed mainly to assess building damage from earthquakes in urban areas because these areas contain less vegetation. Therefore, an investigation of the potential of the intensity correlation and interferometric coherence for landslide detection in vegetated areas using SAR images is needed. However, interferometric coherence was unsuited for analysis in this experiment. Interferometric coherence was found to be very low in a preliminary experiment because of the long temporal baseline. Unfortunately, the shortest temporal baseline was 409 days (i.e. the shortest period between a pre- and post-disaster image pair).
In this study, we investigated the potential of the backscattering coefficient difference and the intensity correlation between pre- and post-disaster COSMO-SkyMed images for landslide detection. The Kii Peninsula was selected as the case study area for landslide detection. The landslide areas derived from an EROS-B VHR image were used for validation. The performance of the backscattering coefficient difference and the intensity correlation was verified and the optimal window size for landslide detection was determined based on comparison with the validation data. We also investigated the effects of speckle noise reduction filtering and window size.
Test site and data
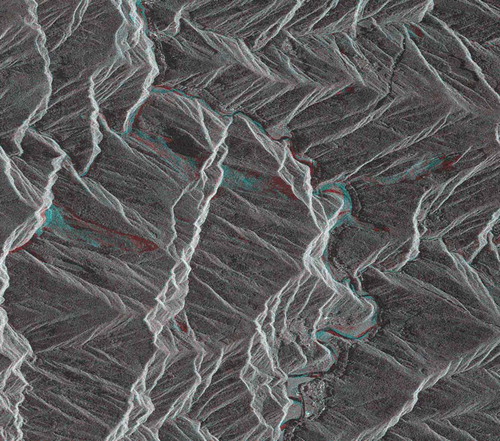
The test site was the town of Oto and the village of Totsugawa in Nara Prefecture, in the central part of Japan, as shown in and . A deep-seated landslide occurred at the test site on 2 September 2011, caused by heavy rain. The total amount of rainfall associated with the typhoon between 30 August and 5 September exceeded 1000 mm over a wide area on Kii Peninsula (Japan Meteorological Agency, Citation2011). The landslides and floods induced by the typhoon resulted in 82 casualties and 16 missing people. We conducted on-site inspections in the Akatani region on 5 March 2012 and collected on-site photographs, as shown in . Restoration work in the landslide area and natural dam removal was carried out at that time. We acquired EROS-B and COSMO-SkyMed images to extract the landslide areas, as shown in . EROS-B data were acquired on 14 September 2011, with a 0.7-m ground sampling distance (GSD), as shown in . The pre-disaster SAR image was acquired on 29 July 2010, and the post-disaster SAR image was acquired on 11 September 2011. The acquisition mode of COSMO-SkyMed was StripMap HIMAGE mode along a descending orbit with an incidence angle of 33.9° and HH polarization. The images were obtained using the same incidence angle and observation direction. The COSMO-SkyMed images had a 3-m resolution in single-look with a 40-km swath. The temporal baseline was 409 days, and the parallel and perpendicular baselines were −81.8 and 119.4 m, respectively. The temporal baseline was too long to generate a high interferometric coherence image in a preliminary experiment, although the spatial baseline was sufficiently shorter than the critical baseline (approximately 5 km). shows a single look amplitude COSMO-SkyMed image of the test site. COSMO-SkyMed image acquired on 29 July 2010 and 11 September 2011 was assigned to red and green plus blue (cyan), respectively. Red and cyan colour images indicate areas of decreased and increased backscatter, respectively. Changed areas were mainly distributed in mountainous and riverbed areas. The test site has a size of 7 km × 7 km, covered by each image, centred at 34°08′07″N and 135°54′27″E.
Table 1. Characteristics of satellite images used for landslide detection.
Figure 1. Location of test site in Nara Prefecture, Japan.
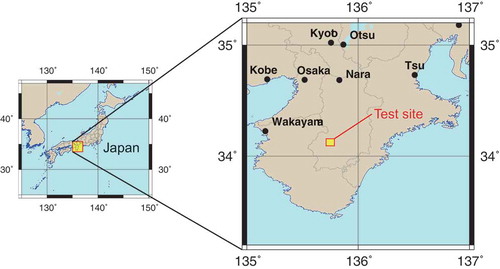
Figure 2. A shaded relief map of test site.
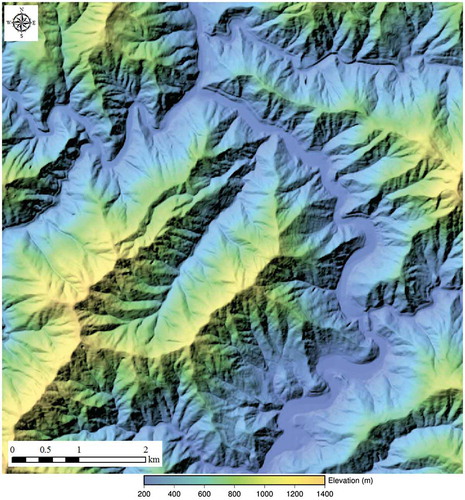
Figure 3. On-site photograph of test site (Akatani region).
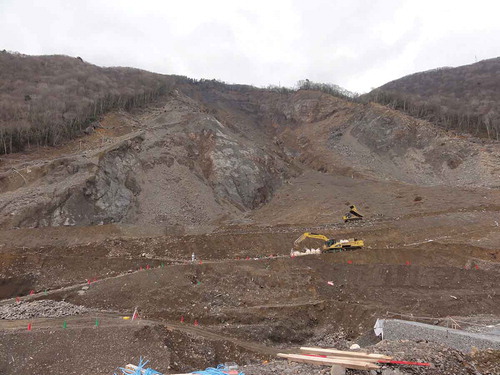
Figure 4. EROS-B image of test site (14 September 2011).
Figure 5. Single look amplitude COSMO-SkyMed image of test site (red: 29 July 2010; green and blue: 11 September 2011).
Data processing for landslide detection
Analysis using a VHR optical image for validation data
Validation data are needed for landslide detection using COSMO-SkyMed images. Chigira, Tsou, Matsushi, Hiraishi and Matsuzawa (Citation2013) analysed major landslides caused by Typhoon Talas, using aerial photographs and LiDAR data. However, although they reported large landslides, they did not report small landslides. A good distribution of landslides is needed for the validation process. We generated validation data using a VHR optical sensor (EROS-B). The EROS-B Level 1A data were generated by ImageSat International (Citation2014). The EROS-B image was acquired on 14 September 2011, with a 0.7-m GSD. The image was rectified using ground control points with a 10-m gridded digital elevation model (DEM) produced by the Geospatial Information Authority, Japan (GSI) (Suga & Konishi, Citation2008). The root mean square errors in the pixel and line directions for the orthorectification were 2.38 and 1.60 m, respectively. The image was orthorectified and converted to the Universal Transverse Mercator (UTM) coordinate system (Zone 53 North) with the WGS84 datum.
This type of imagery has historically been acquired by airborne sensors and has only recently become available via civilian space-borne sensors such as IKONOS or QuickBird. Such data are usually analysed visually and classified into different damage regions (Hoffmann, Citation2007; Yamazaki, Kouchi, Matsuoka, & Kohiyama, Citation2004). In this study, landslide areas were also identified visually from post-disaster EROS-B panchromatic image and digitized as an ESRI shapefile using geographic information system (GIS) software. For the panchromatic images, the main criterion for landslide recognition was the variation and interruption along distinct boundaries of the grey tones. Further, the interpretation of shadows that highlighted local variations in topography, associated with the presence of specific landslide features (e.g. crown and toe areas, lateral shear zones and pressure ridges), was important for the identification and mapping of the landslides (Fiorucci et al., Citation2011).
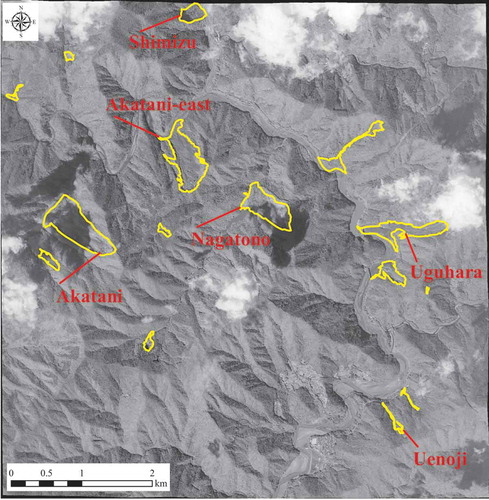
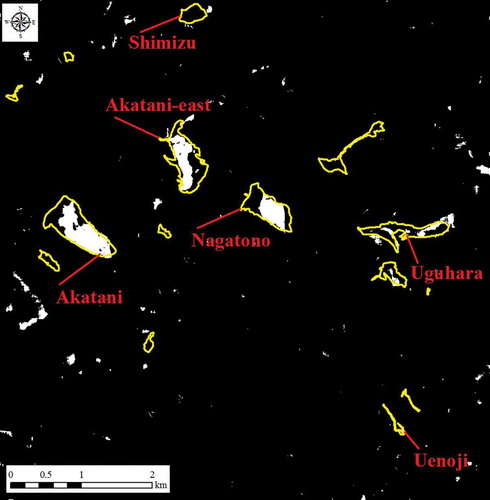
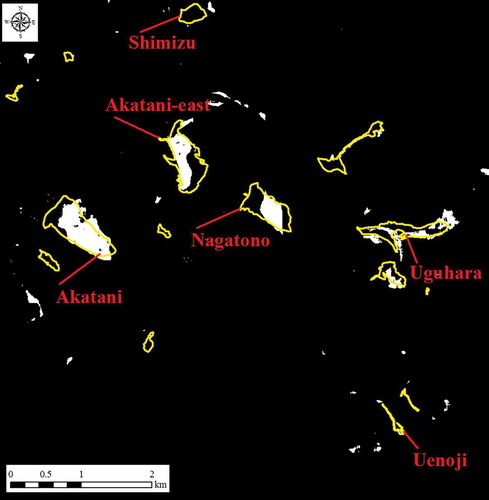
Fifteen landslide areas were derived from the EROS-B image, as shown in . shows a list of the top five landslide areas in the test site. The landslide area was 1707–371,543 m2. The landslide in the Akatani region shown in was the largest damaged area of the test site. The landslide area in the Akatani region as measured by MLIT using an aerial photograph was approximately 376,591 m2 (Ministry of Land, Infrastructure, Transport and Tourism Japan, Citation2011). In contrast, the landslide area was 371,543 m2 and the area ratio was 98.7% in our estimation. Thus, the area coincidence between the aerial photograph and EROS-B was quite high for this area.
Table 2. Top five list of the landslide area derived from EROS-B image.
Figure 6. Landslide areas derived from EROS-B image (yellow polygons: landslide areas).
Analysis using COSMO-SkyMed images
The approach used for landslide detection using the backscattering coefficient difference and the intensity correlation between pre- and post-disaster SAR images is shown in . For pre-processing, multi-looking and backscattering coefficient estimation were conducted. Level 1A single look complex products of the COSMO-SkyMed StripMap HIMAGE mode were converted to multi-look (4 × 2) amplitude images. Multi-look processing improves SAR image quality by reducing speckle noise. Moreover, it can be obtained as approximately square pixels (Asilo et al., Citation2014). In this case, pixel sizes in single-look were 1.18 × 2.07 m and pixels sizes in multi-look were 4.70 × 4.14 m. The multi-look SAR images were calibrated to normalized backscattering coefficients (sigma-nought: σ°), as shown in Eq. (1) (e-GEOS, Citation2010)
Figure 7. Flowchart of proposed method for landslide distribution map.
where DN is the digital number in the amplitude and FTot is the total scaling factor. The FTot of the image acquired on 29 July 2010 and the one acquired on 11 September 2011 were 5.09 × 10⁻⁵ and 9.27 × 10⁻⁵, respectively. The FTot was calculated from the “Reference Slant Range”, “Reference Slant Range Exponent”, “Reference Incidence Angle”, “Calibration Constant” and “Rescaling Factor” in the metadata (e-GEOS, Citation2010).
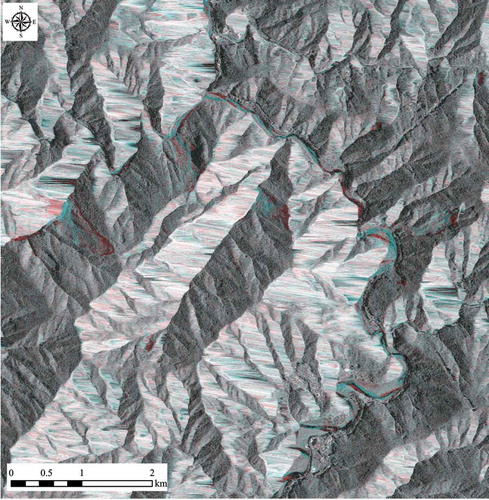
To achieve mapping between the satellite data and DEM, the pre-processed COSMO-SkyMed images were orthorectified using 10-m gridded DEM data produced by the GSI and reprojected to the UTM coordinate system (Zone 53 North) with the WGS84 datum. The ortho-rectified images were 5 m GSD using 5-m gridded DEM by means of oversampling as shown in . Speckle noise reduction is a crucial step for SAR applications. Matsuoka and Yamazaki (Citation2004) examined three speckle filters with the filtering window from 3 × 3 to 51 × 51. The analyses suggest that a Lee filter with 21 × 21 windows is most suitable for detecting building damage. A median filter, Lee filter and Frost filter were adopted with window sizes from 3 × 3 to 21 × 21 with reference to Matsuoka and Yamazaki (Citation2004).
Figure 8. Orthorectified multi-look amplitude COSMO-SkyMed image of test site (red: 29 July 2010; green and blue: 11 September 2011).
To detect the landslide area using COSMO-SkyMed images, we adopted the backscattering coefficient difference and intensity correlation between pre- and post-disaster SAR data. The backscattering coefficient difference (d) was calculated by subtracting the pre-disaster SAR from post-disaster SAR within a moving window pixel, as shown in the following equation:
where i is the pixel number, N is the number of pixels in the moving window, and Iai and Ibi are the values of the N-pixels inside the moving window. The size of the averaging window can affect the sensitivity of the derived parameters with respect to the changes occurring in a scene (Stramondo, Bignami, Chini, Pierdicca, & Tertulliani, Citation2006; Yonezawa & Takeuchi, Citation2001). Thus, we examined different moving window sizes, consisting of odd numbers ranging from 3 × 3 to 51 × 51. The intensity correlation (r) was calculated for several moving window pixels, as shown in Eq. (3) (Matsuoka & Yamazaki, Citation2004; Suga & Konishi, Citation2012):
where i is the pixel number, N is the number of pixels in the moving window, and Iai and Ibi are the values of the N-pixels inside the moving window.
To determine the threshold value for identifying the landslide area, the area was calculated by the mean value and the standard deviation. The threshold value was calculated from the mean value (μ) and standard deviation (σ) of each image (Ishitsuka, Tsuji, & Matsuoka, Citation2013; Liu & Yamazaki, Citation2011; Long, Fatoyinbo, & Policelli, Citation2014). The backscattering coefficient difference was derived from the COSMO-SkyMed image with a 19 × 19 moving window, as shown in . The bright colour was distributed in the landslide and mountainous areas. The dark colour was distributed in the landslide area and around the river. The areas of high and low values outside the landslide area were mainly distributed in foreshortening areas. The threshold value adopts for decreased and increased value because the backscattering coefficient difference in landslide areas indicated an increase and decrease between pre- and post-disaster COSMO-SkyMed images. The landslide area (LD) using the backscattering coefficient difference was determined as shown in the following equation:
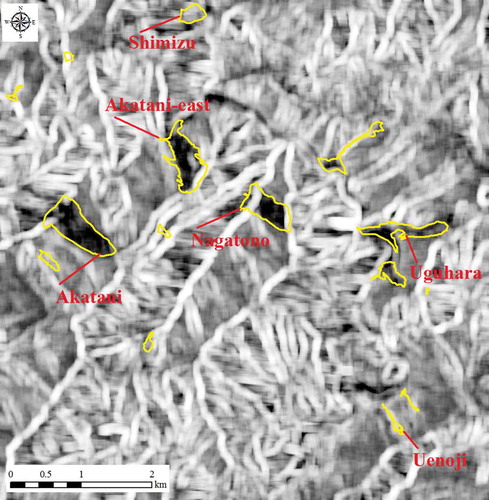
Figure 9. Backscattering coefficient difference derived from COSMO-SkyMed image with a 19 × 19 moving window (yellow polygons: landslide areas).
where a is the threshold coefficient. To generate a landslide distribution map, thresholding was done using a threshold coefficient (a). The intensity correlation was derived from the COSMO-SkyMed image with a 25 × 25 moving window, as shown in . The bright colour was distributed on valleys and ridges. The dark colour was mainly distributed in the landslide area. The threshold value adopts for decreased value because the intensity correlation in the landslide area indicated as decrease between pre- and post-disaster COSMO-SkyMed images. The landslide area (LC) using the intensity correlation was determined as shown in the following equation:
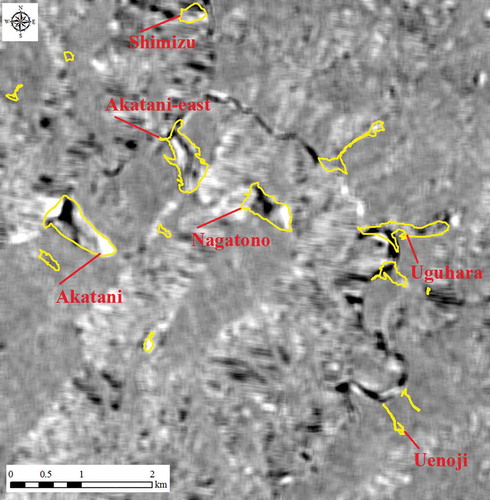
Figure 10. Intensity correlation derived from COSMO-SkyMed image with a 25 × 25 moving window (yellow polygons: landslide areas).
where a is the threshold coefficient. We examined threshold coefficient (a) values of 0.5, 1.0, 1.5, 2.0, 2.5 and 3.0.
Landslide detection using SAR images is affected by foreshortening, layover and shadowing. A layover and shadow mask was generated using 10-m gridded DEM and the COSMO-SkyMed acquisition parameters (GAMMA Remote Sensing, Citation2016). There were sandbars around the river induced by the heavy rain. We did not regard this as a landslide area, although the area was changed. Therefore, a river (flat region) mask was derived from a zenith angle (<0.2) added to the layover and shadow mask. The landslide distribution map derived from the thresholding was masked by the layover, shadow and river mask for the validation process.
To evaluate the landslide detection performance, we computed some values such as recall, precision and F-measure. The recall measure is defined as the number of correctly retrieved pixels divided by the number of relevant pixels in the test dataset. The precision measure is defined as the number of correctly retrieved pixels divided by the number of retrieved pixels. To achieve a balance between the recall and precision measures, we also computed the F-measure, which is defined in the following equation (Guo, Xiong, Atluri, & Adam, Citation2009):
These evaluation values were calculated based on the landslide area derived from the EROS-B image because the optical VHR image is a more reliable source in clear day conditions.
We examined the backscattering coefficient difference and intensity correlation methods with different moving window sizes and different speckle filtering. Moreover, the different threshold coefficients were examined to justify the landslide area detection compared with the validation data derived from the EROS-B image.
Results
We examined landslide detection for rapid assessment using pre- and post-disaster COSMO-SkyMed images. The detected landslide areas were compared with the area detected by EROS-B. First, landslide detection using EROS-B for validation data was verified. The landslide area was visually identified in an EROS-B image and digitized using GIS software. lists the top five landslide areas using the EROS-B image. Chigira et al. (Citation2013) investigated the deep-seated catastrophic landslides caused by Typhoon Talas using aerial photographs and LiDAR data. The landslide area in the Akatani region was 423,700 m2 according to this paper, whereas it was 371,543 m2 (87.7%) in our estimation. The landslide area in the Akatani-east region was 221,400 m2 according to the literature and 289,702 m2 (130.9%) in our estimation. The landslide area in the Nagatono region was 220,700 m2 according to the literature and 230,014 m2 (104.2%) in our estimation. The landslide area in the Uguhara region was 246,800 m2 according to the literature and 189,426 m2 (76.8%) in our estimation. The landslide area in the Shimizu region was 132,300 m2 according to the literature and 66,636 m2 (50.4%) in our estimation. In the Akatani and Uguhara regions, there were two landslide scars. When we summed up the scars, the Akatani and Uguhara areas were 401,680 m2 (94.8%) and 258,980 m2 (104.9%), respectively. As a result, the landslide area derived from EROS-B is quite similar to that shown by the aerial photograph, although the Shimizu area was underestimated by half because the Shimizu region was located at the edge of the EROS-B image and was contaminated by clouds.
Second, we examined the landslide detection performance using the backscattering coefficient difference and the intensity correlation methods between pre- and post-disaster COSMO-SkyMed images. The threshold value for identifying the landslide area was calculated using the mean value and standard deviation. Results of landslide detection using backscattering coefficient difference and intensity correlation are shown in . shows the F-measure of landslide detection derived from COSMO-SkyMed using the backscattering coefficient difference method with no speckle filter. The optimal value of the F-measure (35.80%) was obtained within a window size of 19 × 19 and an a value of 2.0 for landslide detection, as shown in . The precision was 41.72%, and the recall was 31.35%. shows the F-measure of landslide detection derived from COSMO-SkyMed using the intensity correlation with no speckle filter. The optimal value of the F-measure (58.12%) was obtained within a 25 × 25 window and an a value of 2.0 for landslide detection, as shown in . The precision was 64.96%, and the recall was 52.59%. In comparing the two methods for landslide detection, the intensity correlation was better than the backscattering coefficient difference.
Table 3. Results of landslide detection using backscattering coefficient difference and intensity correlation.
Figure 11. F-measure of landslide detection derived from COSMO-SkyMed using backscattering coefficient difference with no speckle filter (a is a coefficient for threshold).
Figure 12. Landslide areas detected by COSMO-SkyMed using backscattering coefficient difference with no speckle filter (yellow polygons: landslide areas detected by EROS-B image; white: landslide areas detected by COSMO-SkyMed images).
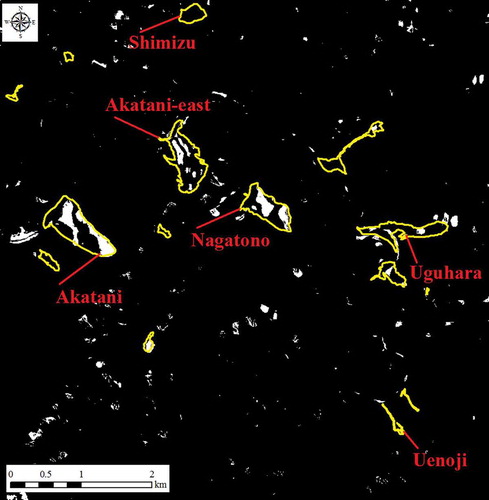
Figure 13. F-measure of landslide detection derived from COSMO-SkyMed using intensity correlation with no speckle filter (a is a coefficient for threshold).
Figure 14. Landslide areas detected by COSMO-SkyMed using intensity correlation with no speckle filter (yellow polygons: landslide areas detected by EROS-B image; white: landslide areas detected by COSMO-SkyMed images).
Third, we also examined the improvement of using speckle filters for landslide detection. We used a median filter, Lee filter and Frost filter from 3 × 3 to 21 × 21 windows size for landslide detection. Results of landslide detection using backscattering coefficient difference and intensity correlation with speckle filters are also shown in . The F-measure of landslide detection derived from COSMO-SkyMed with a 5 × 5 median filter, Lee filter and Frost filter is shown in –, respectively. The optimal value of the F-measure (61.24%) using a 5 × 5 Frost-filtered image was obtained within the area of a 37 × 37 window with an a value of 2.5 for landslide detection using the intensity correlation method. The precision was 65.39%, and the recall was 57.58%.
Figure 15. F-measure of landslide detection derived from COSMO-SkyMed with a 5 × 5 median filter (a is a coefficient for threshold). (a) Backscattering coefficient difference and (b) intensity correlation.
Figure 16. F-measure of landslide detection derived from COSMO-SkyMed with a 5 × 5 Lee filter (a is a coefficient for threshold). (a) Backscattering coefficient difference and (b) intensity correlation.
Figure 17. F-measure of landslide detection derived from COSMO-SkyMed with a 5 × 5 Frost filter (a is a coefficient for threshold). (a) Backscattering coefficient difference and (b) intensity correlation.
These results clearly show that the intensity correlation method was better than the backscattering coefficient difference method. Moreover, of the three filter types, the 5 × 5 Frost filter is the most effective filter for landslide detection. and show the precision and recall of the intensity correlation method for landslide detection derived from COSMO-SkyMed with a 5 × 5 Frost filter, respectively. The precision with an a value of 3.0 reached around 80%, although the recall was around 45%. On the other hand, the recall with an a value of 0.5 reached around 80%, although the precision was around 10%. The landslide area detected by COSMO-SkyMed intensity correlation with a 5 × 5 Frost filter is shown in . The distributions of the detected landslide area are in good agreement with the validation data derived from the EROS-B image. We examined the extraction around the landslide region using the intensity correlation with the optimal window size and threshold. The landslide area in the Akatani region derived from the COSMO-SkyMed images was 326,300 m2. The area ratio was 77.0% compared with the area derived from Chigira et al. (Citation2013). The landslide area in the Akatani-east region derived from the COSMO-SkyMed images was 164,100 m2 (74.1%). The landslide area in the Nagatono region derived from the COSMO-SkyMed images was 109,225 m2 (49.5%). The landslide area in the Uguhara region derived from the COSMO-SkyMed images was 171,100 m2 (69.3%). In the Nagatono region, the extracted area was less than 50% because it was affected by layover. The area ratio in another region was around 70%. These regions were also affected by layover. In addition, the eastern part of the Akatani-east region was affected by a shadowing effect because of a scarp caused by the deep-seated landslide.
Figure 18. Precision of landslide detection derived from COSMO-SkyMed using intensity correlation with a 5 × 5 Frost filter (a is a coefficient for threshold).
Figure 19. Recall of landslide detection derived from COSMO-SkyMed using intensity correlation with a 5 × 5 Frost filter (a is a coefficient for threshold).
Figure 20. Landslide areas detected by COSMO-SkyMed using intensity correlation with a 5 × 5 Frost filter (yellow polygons: landslide areas detected by EROS-B image; white: landslide areas detected by COSMO-SkyMed images).
The official data released by the MLIT, Japan, indicated that the volume of the landslide area was approximately 9.0 million m3 in the Akatani region. The volume of the landslide area using EROS-B was 8.8 million m3, and the volume of the landslide area using COSMO-SkyMed was 7.3 million m3 by means of the experimental equation used in Ministry of Land, Infrastructure, Transport and Tourism Japan (Citation2011) based on an experimental equation (Guzzetti, Ardizzone, Cardinali, Rossi, & Valigi, Citation2009).
The intensity correlation method reduces the effect of SAR speckle noise because the F-measure of the unfiltered image is almost the same value as that of the filtered image. This is a favourable way to rapidly detect landslides because processing the speckle filter and selecting the window size are time-consuming tasks.
Discussion
The purpose of this study was to investigate the potential of the backscattering coefficient difference and intensity correlation for landslide detection between pre- and post-disaster COSMO-SkyMed images. We found the optimal threshold value, window size and speckle filter for identifying the landslide area compared with the validation data derived from an EROS-B image using visual interpretation. The result showed that intensity correlation is better than the backscattering coefficient difference for landslide detection using SAR images. According to the intensity correlation method, the large landslide areas (more than 200,000 m2) detected by COSMO-SkyMed resembled the areas facing away from the SAR sensor, such as the Akatani, Akatani-east and Nagatono regions shown in . The COSMO-SkyMed images were observed with descending orbit and right side-looking. However, part of the landslide areas in the Akatani-east and Nagatono regions was not detected because areas behind slopes are not illuminated at all by radar signals. Namely, the shadowing effect occurred because of the incidence angle and slope angle in the steep mountainous region. Landslide areas facing the SAR sensor (i.e. layover areas such as the Shimizu region) were not detected. The Shimizu region was within a layover area derived from the layover and shadow mask. In this study, areas affected by shadowing and layover were masked for calculating the F-measure, precision and recall. However, landslide areas affected by shadowing and layover were not extracted in our method. These results show that it is necessary to consider the observation direction (ascending and descending orbit) and incidence angle, including the right looking and left looking angles to the target area.
There are large amounts of vegetation in the mountainous areas in the test site. As discussed, vegetation is one of the most common limitations in analysing landslide phenomena using SAR images. However, the intensity correlation method can be used to extract large landslide areas in vegetated mountainous regions.
The window size for speckle filtering was examined from 3 × 3 to 21 × 21. Matsuoka and Yamazaki (Citation2004) investigated the relationship between the speckle reduction filter size and the accuracy of urban damage detection using ERS images. They concluded that the accuracy of damage detection is not significantly improved for speckle reduction filtering for window sizes of larger than 21 × 21 pixels. The Lee filter with its 21 × 21 window size was the highest coincidence ratio of discrimination in the damaged or no damaged areas. On the other hand, Ozdarici-Ok and Akyurek (Citation2012) examined seven speckle filters on Envisat ASAR data for crop classification in agricultural land. The filtering results suggest that a Lee filter with 5 × 5 window size is the most suitable method to minimize the speckle effect. In this study, the F-measure was high with 3 × 3 or 5 × 5 window size for speckle filtering. This result implies that small window size for speckle filtering is better than large window size for analysing forested or agricultural land. The window size for the calculation of the backscattering coefficient difference and intensity correlation is crucial to landslide detection. This study is the first to examine the relationship between accuracy in landslide detection and the window size for the backscattering coefficient difference and intensity correlation. Matsuoka and Yamazaki (Citation2004) found that a 13 × 13-pixel window exhibited the highest coincidence ratio for building damage using a combination of the difference in the backscattering coefficient and intensity correlation of the pre- and post-event ERS images. Our optimal window sizes were 19 × 19 pixels for the backscattering coefficient difference and 37 × 37 pixels for the intensity correlation. Here, the effect of window size is not apparent in the backscattering coefficient difference method because the landslide detection performance using the backscattering coefficient difference was not adequate in this result. On the other hand, the landslide area derived from the intensity correlation was in good agreement with the landslide area extracted from the EROS-B image.
We only obtained two temporal COSMO-SkyMed images in this study. In general, change detection using intensity correlation derived from two pre- and one post-disaster SAR images uses the ratio computed from the pre-disaster SAR image pair and co-disaster SAR image pair for the intensity correlation. Therefore, this method uses at least three SAR images. Two pre-disaster SAR images, ideally acquired shortly before the event, and at least one post-disaster imagery recorded shortly after the event, are required (Plank, Citation2014). Although we only used one pre- and one post-disaster SAR image, use of the ratio of the pre-disaster SAR and co-disaster SAR intensity correlations may have improved the landslide detection accuracy.
Spatial resolution is important for identifying small landslides or debris flows. We used high-resolution COSMO-SkyMed images in this study. Further investigations should be conducted using VHR SAR images, such as spotlight SAR from TerraSAR-X and COSMO-SkyMed.
We acknowledge there are several limitations to this study. First, the analysis was only conducted on Kii Peninsula. Our experiment showed the optimal value for landslide detection in this case. Matsuoka and Yamazaki (Citation2004) also suggested that the optimal value may change if conditions are different. Therefore, further experiments are required to investigate the optimal values for other landslide events. Second, the satellite data used only X-band HH polarization COSMO-SkyMed in StripMap HIMAGE mode. SAR backscattering intensity is the cumulative contribution of surface roughness, dielectric constant and terrain slope, all of which are a function of radar parameters such as incidence angle, wavelength and polarization (Ulaby, Moore, & Fung, Citation1986; Zhao et al., Citation2013). Therefore, it is necessary to investigate landslide detection using other SAR images, such as TerraSAR-X (X-band), Sentinel-1 (C-band) and PALSAR-2 (L-band), and different incidence angles and polarizations. Third, optical and SAR images were not acquired at the same time; therefore, there remains the possibility of landslides occurrence or disaster recovery between the acquisition times.
Conclusions
Landslide detection was conducted by means of the backscattering coefficient difference and intensity correlation between pre- and post-disaster COSMO-SkyMed images. To develop a method for rapid landslide detection, a study was conducted in which the F-measure was examined for selecting the optimal moving window size for the backscattering coefficient difference and intensity correlation. As a result, the intensity correlation is better than the backscattering coefficient difference for landslide detection using SAR images. The large landslide areas were detected by COSMO-SkyMed images using the intensity correlation. Only two SAR images were used in this study, one pre- and one post-disaster, but the use of two pre- and one post-disaster SAR images would improve the accuracy of landslide detection. Moreover, the intensity correlation is more robust than using interferometric coherence in the case of a long temporal and spatial baseline between the pre- and post-disaster SAR image pair.
The results of this study suggest that it is possible to detect landslides for rapid impact assessment after a disaster using high-resolution SAR images. Since this experiment was conducted using COSMO-SkyMed images, further research is needed for other SAR images, such as TerraSAR-X, Sentinel-1A and ALOS-2/PALSAR-2, and multi-polarization. Analysis of other disaster events is also needed to identify the optimal value for landslide detection (i.e. window size of backscattering coefficient difference or intensity correlation, speckle filter and threshold value).
Acknowledgements
This work was supported by JSPS KAKENHI: [Grant Number JP16K01337]. The COSMO-SkyMed data used in this study were provided through a COSMO-SkyMed AO PI Account based on a contract with ASI. We also thank the two anonymous reviewers for valuable comments and helpful suggestions that significantly improved the manuscript.
Disclosure statement
No potential conflicts of interest are reported by the authors.
Additional information
Funding
References
- Agenzia Spaziale Italiana (2007). COSMO-SkyMed system description & user guide. Retrieved from http://www.e-geos.it/products/pdf/csk-user_guide.pdf.
- Asilo, S., De Bie, K., Skidmore, A., Nelson, A., Barbieri, M., & Maunahan, A. (2014). Complementarity of two rice mapping approaches: characterizing strata mapped by hypertemporal MODIS and rice paddy identification using multitemporal SAR. Remote Sensing, 6(12), 12789–12814.
- Brett, P.T.B., & Guida, R. (2013). Earthquake damage detection in urban areas using curvilinear features. IEEE Transactions on Geoscience and Remote Sensing, 51, 4877–4884.
- Calò, F., Ardizzone, F., Castaldo, R., Lollino, P., Tizzani, P., Guzzetti, F., & Manunta, M. (2014). Enhanced landslide investigations through advanced DInSAR techniques: The Ivancich case study, Assisi, Italy. Remote Sensing of Environment, 142, 69–82.
- Cascini, L., Fornaro, G., & Peduto, D. (2009). Analysis at medium scale of low-resolution DInSAR data in slow-moving landslide-affected areas. ISPRS Journal of Photogrammetry and Remote Sensing, 64, 598–611.
- Chigira, M., Tsou, C.Y., Matsushi, Y., Hiraishi, N., & Matsuzawa, M. (2013). Topographic precursors and geological structures of deep-seated catastrophic landslides caused by Typhoon Talas. Geomorphology, 201, 479–493.
- Costa, E.J., & Schuster, L.R. (1988). The formation and failure of natural dams. Geological Society of America Bulletin, 100, 1054–1068.
- e-GEOS (2010). COSMO-SkyMed image calibration. Retrieved from http://www.e-geos.it/products/pdf/COSMO-SkyMed-Image_Calibration.pdf
- European Space Agency (2013). Sentinel-1 User Handbook. Retrieved from https://sentinel.esa.int/documents/247904/685163/Sentinel-1_User_Handbook
- Fiorucci, F., Cardinali, M., Carlà, R., Rossi, M., Mondini, A.C., Santurri, L., & Guzzetti, F. (2011). Seasonal landslide mapping and estimation of landslide mobilization rates using aerial and satellite images. Geomorphology, 129, 59–70.
- Fire and Disaster Management Agency. (2014). About the damage situation by the 12th typhoon in 2011 and the activities of the Fire And Disaster Management Agency (Final report). (1–10). in Japanese. Retrieved from http://www.fdma.go.jp/bn/%E5%8F%B0%E9%A2%A8%E7%AC%AC12%E5%8F%B7%E3%81%AB%E3%82%88%E3%82%8B%E8%A2%AB%E5%AE%B3%E7%8A%B6%E6%B3%81%E3%81%AB%E3%81%A4%E3%81%84%E3%81%A6%EF%BC%88%E6%9C%80%E7%B5%82%E5%A0%B1%EF%BC%89.pdf.
- Forster, R. (2006). Land subsidence in southwest Utah from 1993 to 1996 measured with interferometric synthetic aperture radar (InSAR) (pp. 1–30). Retrieved from http://files.geology.utah.gov/online/mp/mp06-05.pdf.
- GAMMA Remote Sensing. (2016). Differential interferometry and geocoding software – DIFF & GEO User’s Guide (pp. 14–18). Gümligen, Switzerland.
- Guo, D., Xiong, H., Atluri, V., & Adam, N.R. (2009). Object discovery in high-resolution remote sensing images: A semantic perspective. Knowledge and Information Systems, 19, 211–233.
- Guzzetti, F., Ardizzone, F., Cardinali, M., Rossi, M., & Valigi, D. (2009). Landslide volumes and landslide mobilization rates in Umbria, central Italy. Earth and Planetary Science Letters, 279, 222–229.
- Guzzetti, F., Mondini, A.C., Cardinali, M., Fiorucci, F., Santangelo, M., & Chang, K.T. (2012). Landslide inventory maps: New tools for an old problem. Earth-Science Reviews, 112, 42–66.
- Hoffmann, J. (2007). Mapping damage during the Bam (Iran) earthquake using interferometric coherence. International Journal of Remote Sensing, 28, 1199–1216.
- Imagesat International. (2014). Products and services guide (1–20). Or Yehuda, Israel.
- Ishitsuka, K., Tsuji, T., & Matsuoka, T. (2013). Detection and mapping of soil liquefaction in the 2011 Tohoku earthquake using SAR interferometry. Earth, Planets and Space, 64, 1267–1276.
- Ito, Y., Hosokawa, M., Lee, H., & Liu, J.G. (2000). Extraction of damaged regions using sar data and neural networks. International Archives of Photogrammetry and Remote Sensing, 33, 156–163.
- Japan Meteorological Agency. (2011). A heavy rain and storm from August 30 to September 5 by the 2011 typhoon twelfth. 1–79. in Japanese. Retrieved from http://www.jma.go.jp/jma/kishou/books/saigaiji/saigaiji_201103/saigaiji_201103.pdf.
- Liu, W., & Yamazaki, F. (2011, July). Urban monitoring and change detection of central Tokyo using high-resolution X-band SAR images. Proceedings of the International Geoscience and Remote Sensing Symposium (IGARSS) (2133–2136), Vancouver, Canada. doi: 10.1109/IGARSS.2011.6049587
- Long, S., Fatoyinbo, T.E., & Policelli, F. (2014). Flood extent mapping for Namibia using change detection and thresholding with SAR. Environmental Research Letters, 9, 035002.
- Lu, Z., Dzurisin, D., Jung, H.S., Zhang, J., & Zhang, Y. (2010). Radar image and data fusion for natural hazards characterisation. International Journal of Image and Data Fusion, 1, 217–242.
- Massonnet, D., Rossi, M., Carmona, C., Adragna, F., Peltzer, G., Feigl, K., & Rabaute, T. (1993). The displacement field of the Landers earthquake mapped by radar interferometry. Nature, 364, 138–142.
- Matsuoka, M., & Yamazaki, F. (2004). Use of satellite SAR intensity imagery for detecting building areas damaged due to earthquakes. Earthquake Spectra, 20, 975–994.
- Matsuoka, M., & Yamazaki, F. (2005). Building damage mapping of the 2003 Bam, Iran, earthquake using Envisat/ASAR intensity imagery. Earthquake Spectra, 21, 1–5.
- Ministry of Land, Infrastructure, Transport and Tourism Japan. (2011). Collected results of collapsed area using aerial photographs (in Nara, Wakayama and Mie prefecture). in Japanese. Retrieved from http://www.mlit.go.jp/common/000168727.pdf.
- Ministry of Land, Infrastructure, Transport and Tourism Kinki regional development bureau. (2014). Kii Peninsula great flood in 2011 . (1–400). in Japanese. Retrieved from https://www.kkr.mlit.go.jp/bousai/kiroku/qgl8vl0000008lkt-att/kiihantou-kirokushi.pdf.
- Mondini, A.C., Chang, K.T., & Yin, H.Y. (2011a). Combining multiple change detection indices for mapping landslides triggered by typhoons. Geomorphology, 134, 440–451.
- Mondini, A.C., Guzzetti, F., Reichenbach, P., Rossi, M., Cardinali, M., & Ardizzone, F. (2011b). Semi-automatic recognition and mapping of rainfall induced shallow landslides using optical satellite images. Remote Sensing of Environment, 115, 1743–1757.
- Nichol, J., & Wong, M.S. (2005). Satellite remote sensing for detailed landslide inventories using change detection and image fusion. International Journal of Remote Sensing, 26, 1913–1926.
- Ozdarici-Ok, A., & Akyurek, Z. (2012). A segment-based approach to classify agricultural lands by using multi-temporal optical and microwave data. International Journal of Remote Sensing, 33(22), 7184–7204.
- Plank, S. (2014). Rapid damage assessment by means of multi-temporal SAR — A comprehensive review and outlook to sentinel-1. Remote Sensing, 6, 4870–4906.
- Stramondo, S., Bignami, C., Chini, M., Pierdicca, N., & Tertulliani, A. (2006). Satellite radar and optical remote sensing for earthquake damage detection: Results from different case studies. International Journal of Remote Sensing, 27, 4433–4447.
- Strozzi, T., Delaloye, R., Kääb, A., Ambrosi, C., Perruchoud, E., & Wegmüller, U. (2010). Combined observations of rock mass movements using satellite SAR interferometry, differential GPS, airborne digital photogrammetry, and airborne photography interpretation. Journal of Geophysical Research, 115(1), 1–11.
- Suga, Y., & Konishi, T. (2008, September). Detection of landslide damaged area using earth observation satellite. Proceedings of the 63th Annual Conference of the Japan Society of Civil Engineers (445–446). Miyagi, Japan. (in Japanese).
- Suga, Y., & Konishi, T. (2012, September). Landslide detection using very high-resolution satellite imageries. Proceedings of the 8th SPIE Asia-Pacific remote sensing, Land Surface Remote Sensing (852428–852428-6). Kyoto, Japan. doi: 10.1117/12.976033
- Tessari, G., Floris, M., & Pasquali, P. (2017). Phase and amplitude analyses of SAR data for landslide detection and monitoring in non-urban areas located in the North-Eastern Italian pre-Alps. Environmental Earth Sciences, 76, 85.
- Ulaby, F.T., Moore, R.K., & Fung, A.K. (1986). Microwave remote sensing: Active and passive - vol. III: from theory to applications (1097). Boston, Artech House, Inc.
- Uprety, P., & Yamazaki, F. (2012). Detection of building damage in the 2010 Haiti earthquake using high-resolution SAR intensity images. Journal of Japan Association for Earthquake Engineering, 12, 8–12.
- Yamazaki, F., Kouchi, K., Matsuoka, M., & Kohiyama, M. (2004, August). Damage detection from high-resolution satellite images for the 2003 Boumerdas, Algeria earthquake. Proceedings of the 13th world conference on earthquake engineering (pp. 1–13), Vancouver, Canada.
- Yamazaki, F., & Matsuoka, M. (2007). Remote sensing technologies in post-disaster damage assessment. Journal of Earthquake and Tsunami, 1, 1–17.
- Yamazaki, F., Yano, Y., & Matsuoka, M. (2005). Visual damage interpretation of buildings in Bam city using QuickBird images following the 2003 Bam, Iran, earthquake. Earthquake Spectra, 21, 1–5.
- Yonezawa, C., & Takeuchi, S. (2001). Decorrelation of SAR data by urban damages caused by the 1995 Hyogoken-nanbu earthquake. International Journal of Remote Sensing, 22, 1585–1600.
- Yun, S.H., Hudnut, K., Owen, S., Webb, F., Simons, M., Sacco, P., & Coletta, A. (2015). Rapid damage mapping for the 2015 Mw 7.8 Gorkha earthquake using synthetic aperture radar data from COSMO–SkyMed and ALOS-2 satellites. Seismological Research Letters, 86, 1549–1556.
- Zhao, C., Lu, Z., Zhang, Q., & De La Fuente, J. (2012). Large-area landslide detection and monitoring with ALOS/PALSAR imagery data over Northern California and Southern Oregon, USA. Remote Sensing of Environment, 124, 348–359.
- Zhao, C., Zhang, Q., Yin, Y., Lu, Z., Yang, C., Zhu, W., & Li, B. (2013). Pre co and post rockslide analysis with ALOS/PALSAR imagery: A case study of the Jiweishan rockslide, China. Natural Hazards and Earth System Sciences, 13, 2851–2861.