
 ?Mathematical formulae have been encoded as MathML and are displayed in this HTML version using MathJax in order to improve their display. Uncheck the box to turn MathJax off. This feature requires Javascript. Click on a formula to zoom.
ABSTRACT
Repeated monitoring of paddy rice is essential for government agencies and policy makers to maintain the balance of supply and demand for rice. Recent studies have mostly concentrated on the mapping of paddy rice with temporal satellite imagery during growing seasons. Given the phenological variation within paddy rice fields and spectral confusion between paddies and other vegetation classes, our ability to identify paddy rice fields with temporal imagery remains limited. The objective of this study is to develop new phenology and textural-based strategies to detect paddies with HJ-1A, MODIS and PALSAR FNF imagery. Two phenology-based strategies that track the seasonal trajectory of crops and one textural-based strategy that contains image surface characteristics are presented. With the proposed strategies, temporal, spectral and textural features were investigated for paddy rice detection. The results indicate that the phenology-based strategies could reveal the phenological variation within paddy rice and significantly improved the detection accuracy. Seasonal amplitude, grey level co-occurrence matrix entropy and spectral features of the heading stage were proven to be important in identifying paddy rice. It was concluded that the combination of HJ-1A, MODIS and PALSAR FNF imagery are promising in facilitating the rapid mapping of paddy rice at a regional scale.
Introduction
Food security is one of the basic factors of our well-being and happiness (Wu et al., Citation2015). Rice is very important to food security because rice is the major food for more than half of the world’s seven billion people (Kuenzer & Knauer, Citation2013; Maclean, Hardy, & Hettel, Citation2013; Qiu, Li, Tang, Chen, & Qi, Citation2015). Rice is related to global water use, climate change and disease transmission (Bouman, Humphreys, Tuong, & Barker, Citation2007; Gilbert et al., Citation2008; Sass & Cicerone, Citation2002). Currently, rice production is potentially affected by rapid urbanisation, industrialisation, changing patterns of precipitation and rising global surface and sea temperatures (Nguyen, Citation2008). Accurate and timely mapping of paddy rice is essential to enhance our knowledge of food security, water resource management, infectious disease transmission and environmental sustainability (Boschetti, Nutini, Manfron, Brivio, & Nelson, Citation2014; Zhang et al., Citation2015).
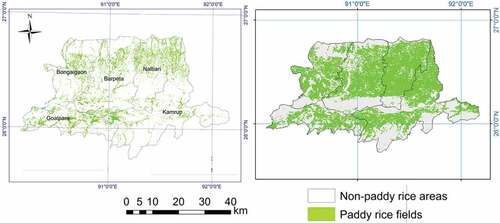
Figure 11. Paddy rice map of study area. Generated by the C4.5 using the spectral and phenological features in 2014–2015 at 30 m spatial resolution (left). Paddy rice map based on IRRI for 2000–2012 (right). Note that the time periods of the compared maps are different and the comparison is for a general examination of the paddy rice distribution
Remote sensing is an efficient technique that can be used for repeated and continual cropland mapping at various temporal and spatial resolutions (Thenkabail et al., Citation2012). Conventionally, mapping of paddy rice is conducted using either optical or microwave sensors (Kuenzer & Knauer, Citation2013). Microwave sensors can penetrate through clouds and are thus more useful for paddy rice mapping in regions dominated by frequent cloud cover (Miyaoka et al., Citation2013; Y. Zhang, Wang, Wu, Qi, & Salas, Citation2009). However, the availability of microwave data is limited and expensive (Li, Feng, Jiang, Liu, & Xiao, Citation2012; Zhang et al., Citation2009). Optical sensor data mainly come from the MODIS, NOAA-AVHRR, Landsat, IRS, SPOT and HJ-1A/B satellites. Over the last several years, due to long-term archiving and free data distribution, MODIS and Landsat have been the most frequently used data sources for paddy rice mapping using conventional pixel-based image analysis techniques (Dong et al., Citation2016).
Traditional pixel-based image analysis of paddy rice mapping and land use classification suffer from low accuracy, sub-pixel problems as well as the salt-and-pepper effect in the classification output (Blaschke, Citation2010). In contrast, object-based image analysis (OBIA) is not affected by the limitations of traditional pixel-based image classification (Blaschke, Citation2010). The OBIA approach generates meaningful and reliable classifications by considering a group of pixels that contain additional spectral, textural and geometric information. OBIA is performed in two steps: (1) image segmentation by grouping a number of individual pixels into a segment or an object based on the homogeneity, intensity, and texture of the image; and (2) image classification by assigning a specific class to the object according to its spectral, textural and geometric properties. Recent studies have demonstrated that OBIA is more accurate than other pixel-based approaches for land cover classification and paddy rice mapping (Blaschke et al., Citation2014). OBIA is particularly effective for fragmented landscapes (Singha, Wu, & Zhang, Citation2016a).
Recently, researchers have been attracted to the fine-scale mapping of paddy rice fields by primarily applying the Landsat time series (Dong et al., Citation2016). However, long revisit cycles (16 days) and frequent cloud cover reduces the availability of Landsat data (Zhu, Woodcock, Holden, & Yang, Citation2015). The problem becomes more serious for rice growing areas in tropical climates where rainy weather and the presence of clouds is a common phenomenon (Asner, Citation2001). The long data interval potentially causes confusion between the identification of natural vegetation versus crops, particularly in the regions where paddy fields are small in size and are surrounded by tress (Wang et al., Citation2015). Fortunately, this problem can be resolved using the Advanced Land Observing Satellite (ALOS) Phased Arrayed L-band Synthetic Aperture Radar (PALSAR) that correctly identifies forests. The L-band PALSAR penetrates the vegetation canopy due to its long wavelength and provides unique information related to vegetation structure, thereby enhancing the distinction between the natural vegetation and crops (Shimada et al., Citation2014). In this study, three satellite data sources (i.e. MODIS, HJ-1A and the ALOS PALSAR) were combined to facilitate fine-scale mapping of paddy rice. The combined use of multiple data sources potentially increases data availability for better tracking of crop reflectance changes. Particularly, for this study, MODIS data were used to track vegetation growth by analysing phenological features. The HJ-1A images provided spatial variation patterns and textural information for paddy rice, and the ALOS PALSAR data provided accurate information about forest cover in the study site.
Phenology and textural features are related to crop characteristics (Peña-Barragán, Ngugi, Plant, & Six, Citation2011). Phenology is the timing of plant growth events, such as the start of the season, end of the season, the peak growth stage, flowering and abscission. Textural features refer to the properties of the image surface and the relationships of a pixel to surrounding pixels (Haralick & Shanmugam, Citation1973). Recently, the importance of phenology and texture features were revealed for paddy rice classification (Kim & Yeom, Citation2014; Singha, Wu, & Zhang, Citation2016b). However, it is still not clear how the phenological and textural features of various resolutions can be utilized efficiently for the remote monitoring of paddy rice. The main research questions of this study were as follows: (1) how can the multi-source images (HJ, MODIS and PALSAR) be used for paddy rice mapping in an OBIA approach? (2) which group of features (phenological features, phenological metrics or the textural features) are effective in paddy rice mapping? (3) which is the most important feature for characterizing and detecting paddy rice in an OBIA approach? The main objectives of this study were: (1) to develop an object-based paddy rice identification approach by integrating multi-source images from optical (HJ-1A, MODIS) and microwave (ALOS PALSAR) sensors; and (2) to evaluate the importance of various phenological groups (phenological bands and phenological metrics) and textural features for paddy rice mapping.
Study site
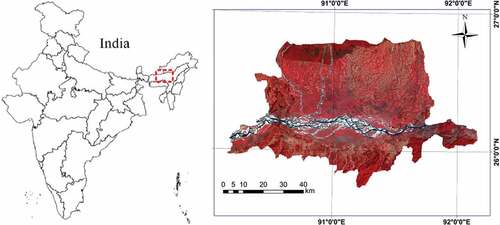
Assam is one of the northeastern states of India. It extends between 24°00 N and 24°18' N latitudes and 89°4' E and 94°00 E longitudes (). The total area of the study site is approximately 78,523 km2. The landscape is heterogeneous with a mixture of urban and rural areas. The average annual rainfall and temperature is approximately 3000 mm and 24°C, respectively. The principal crop of the region is rice. It is cultivated in both the summer and winter. The rice is distributed on the plains and on hill-slopes. The area used for rice cultivation is approximately 71% of the total cultivated area (Govt of India, Ministry of Agriculture, & Department of Agriculture and Cooperation, Citation2015). The region has two distinct growing seasons: rabi (February–July) and kharif (July–December).
Figure 1. Study site (background is the HJ-1A satellite image showing in false colour composite)
Data and pre-processing
MODIS Enhanced Vegetation Index
Moderate Resolution Imaging Spectroradiometer (MODIS) Enhanced Vegetation Index (EVI) (MOD13Q1, Collection 5) datasets were obtained from the Land Processes Distributed Active Archive Center (LP DAAC) (https://lpdaac.usgs.gov/data_access/data_pool). The MODIS EVI is a 250 m spatial resolution 16-day composite data set. All of the MODIS EVI data were acquired for the period of April 2014 to March 2015 (). The Savitzky-Golay (S-G) filter (Chen et al., Citation2004) was employed to smooth the time series MODIS EVI data to remove noise and the effects of cloud cover. The smoothed EVI datasets were re-projected to WGS 84/UTM zone 46N and resampled at a 30 m resolution to the spatial resolution of the HJ-1A datasets.
Table 1. Used satellite dataset
HJ-1A satellite data
HJ-1A is an optical satellite that was launched by Chinese Government in 2008 to monitor the environment and disasters. The satellite is onboard with two charged-coupled device sensors and has a revisit cycle of 4 days. The spatial resolution of the satellite is 30 m and the swath width is 360 km. The technical specification of the dataset is provided in . The HJ-1A satellite images during the key rice growing period were downloaded from the China Centre for Resources Satellite Data and Application (http://cresda.com.cn/EN/). Pre-processing of the images involved the following steps: (a) conversion of digital numbers (DN) to radiance; (b) conversion of radiance to top of atmosphere (TOA) reflectance and (c) atmospheric correction using the FLAASH method of the ENVI software.
Table 2. Technical specifications of HJ-1A satellite image
ALOS PALSAR forest/non-forest map
ALOS PALSAR forest/non-forest maps (FNF) from 2015 were obtained from the Japan Aerospace Exploration Agency (JAXA). The dataset is freely available at a global scale (https://www.eorc.jaxa.jp/ALOS/en/index.htm). The 25 m resolution dataset was generated using the Phased Arrayed L-band Synthetic Aperture Radars (PALSAR and PALSAR-2) of the Advanced Land Observing Satellite (ALOS and ALOS-2). Previous studies have demonstrated the applicability of the FNF dataset in separating paddy rice fields and forest (McNairn, Shang, Jiao, & Champagne, Citation2009). It is essential to remove the forest areas because they negatively affect the accuracy of the paddy rice classification algorithm. The forest area over the study site was removed using the ALOS PALSAR-based FNF dataset.
Reference data
The reference data that were used for evaluating the efficiency of detection strategies were obtained through manually digitized maps. The paddy fields were digitized manually with the assistance of available secondary data including the land use/land cover data for 2013–2014, high resolution images from Google Earth and ground reference points.
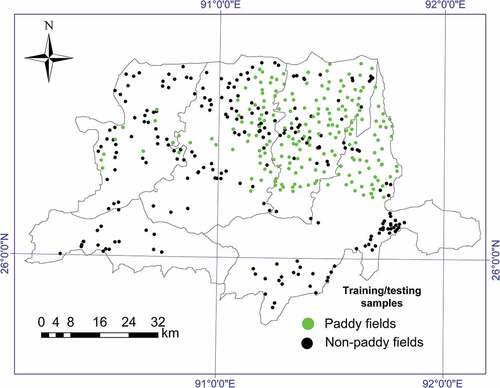
A field survey was conducted in 2015 to collect ground reference samples. With a handheld GVG (GPS-video-GIS) instrument (Wu & Li, Citation2012), the locations of typical land cover classes (i.e. paddy rice, non-crop and other land cover classes) were recorded. During the field trip, a distance of approximately 400 km was covered and approximately 4000 sample points were collected ( and ). The reference dataset assisted in training sample selection and accuracy assessment.
Figure 2. Field survey location
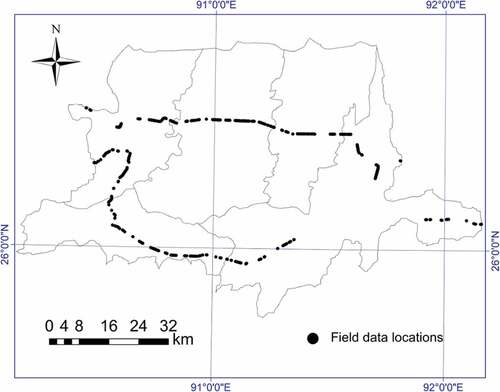
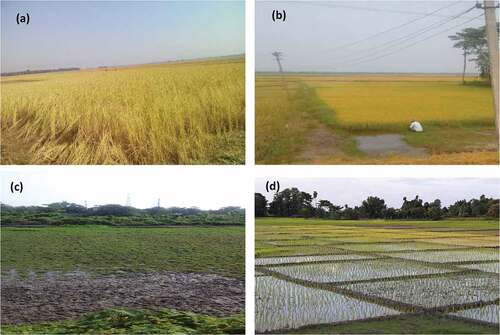
Figure 3. Field photographs
Methods
This section introduces the main methods used in this study to achieve our objectives. First, four classification strategies were developed to map paddy rice areas using the HJ-1A and MODIS data. Second, C4.5 classification tree algorithm was applied to evaluate the proposed classification strategies. Third, the importance of crucial features in characterizing and identifying paddy rice areas was evaluated. Finally, accuracy assessment was performed for all of the applied classifications.
General technical procedure
A number of steps were performed to evaluate the phenology and textural-based classification strategies for paddy rice mapping. The method consists of following steps: (1) pre-processing of the data sets including atmospheric and geometric correction of HJ-1A images and S-G filtering of time series MODIS EVI; (2) masking of forest areas from the HJ-1A and MODIS data; (3) segmentation of HJ-1A images; (4) calculation of textural features; (5) phenological metrics extraction from the time series MODIS EVI; (6) integration of 250 m phenological metrics with the 30 m HJ-1A spectral feature; (7) development of four classification strategies () based on phenological and textural features; (8) assessing the feature importance and (9) classification and accuracy assessment. illustrates the adopted methodology.
Table 3. Four detection strategies developed for this study
Figure 4. Flowchart of methodology to investigate the role of phenological trajectory and texture
Image segmentation and object-based texture features
The multi-resolution image segmentation algorithm (Baatz & Schäpe, Citation2000) was applied to the green, red, blue and near-infrared (NIR) spectral bands of the HJ-1A dataset. The segmented objects contain additional spectral, spatial and textural information when compared to a single pixel (Blaschke, Citation2010). The most important segmentation parameter, that is, scale was estimated considering the local variance (LV) of object heterogeneity within an image (Drǎguţ, Tiede, & Levick, Citation2010). The HJ-1A images were segmented with multiple scales from 1 to 50 using the bottom-up approach, and the LV was measured for each scale. Variation in object heterogeneity was observed by assessing LV plotted against the corresponding scale (Drǎguţ et al., Citation2010). The thresholds in rates of change of LV indicate the optimal scale for segmentation; in this case, the optimal scale was 25. The final parameter combination that was selected was 0.1, 0.7 and 25 for shape, compactness and scale, respectively. Visual assessment indicated that image objects were comparable to actual field sizes. Four textural features including (1) standard deviation; (2) homogeneity; (3) dissimilarity and (4) entropy, which is based on the grey-level co-occurrence matrix (GLCM) defined by Haralick and Shanmugam (Citation1973), were calculated for each of the segments to use in the classification process. Textural features were calculated for two directions (00 and 900) of the GLCM. The standard deviation indicates the degree of local pixel variability within an object (Peña-Barragán et al., Citation2011). The homogeneity and dissimilarity are both a measure of pixel uniformity. The homogeneity of any texture is high if there is a strong presence of pixels with the same or similar grey level value (Kim & Yeom, Citation2014). Dissimilarity measures the grey level variation of object pixels, and the entropy measures the disorder or complexity of an object pixel (Haralick & Shanmugam, Citation1973). To avoid the computational cost, only the above four textural features were used in this study, that have proven to be useful for object-based crop classification (Kim & Yeom, Citation2014).
Phenological metrics extraction
Phenological metrics are the representation of growing events that characterize the seasonal photosynthetic activity of crops (e.g. time of greenness, time of flowering, time of abscission, etc.). Phenological metrics were extracted from the MODIS EVI time series. The EVI time series was fitted to an asymmetric Gaussian function to obtain the metrics. The metrics were calculated based on the assumption that a specific phenology occurs when EVI values achieve a given threshold (Jonsson & Eklundh, Citation2002). To closely fit the function, the TIMESAT GUI (Jönsson & Eklundh, Citation2004) was interactively utilized in parameter selection. A total of nine phenological metrics () related to plant growing events were extracted. The phenological metrics were presented by the images where each pixel represents either the Day of Year (DOY) or the distinguished indicative values when measurable changes occur in the vegetation canopy.
Integration of 250 m phenological metrics with the 30 m spectral and textural features
The extracted 250 m resolution phenological metrics were integrated with the 30 m spectral and textural features of HJ-1A images (). The integration was conducted in the image object level where each image objects already have the spectral and textural features. For each of the HJ-1A image objects, mean phenology values were calculated from the metrics and assigned to the objects. The HJ-1A image object was composed of more than 8 by 8 pixels, which is approximately the same size as the 250 m MODIS-based phenology pixel. Therefore, all of the image objects received the corresponding phenology values extracted from the 250 m MODIS EVI. The integration was performed using the eCognition software with the built-in mean function calculation for an object. It should be noted that mixed pixels exist in the phenology image due to the coarse resolution (250 m) of the MODIS EVI dataset. Nevertheless, we utilized all of the phenology images assuming that within a 250 m pixel, phenology characteristics remain the same. The new integrated composite contains the spectral and textural features (generated during segmentation, section 4.2) from the HJ-1A data and the crop growth information (phenological metrics) from the MODIS EVI time series.
Figure 5. Feature integration
Four classification strategies
Based on the time series EVI and HJ-1A images, the following four classification strategies were developed: (1) using only a single-date HJ-1A image acquired at the optimal time window (i.e. peak growth stage of paddy rice based on crop calendar); (2) using the phenological bands (i.e. spectral bands of multi-date HJ-1A images); (3) using the phenological metrics and (4) using the textural features. The single-date HJ-1A imagery was considered as a baseline for benchmarking the analysis. The classification strategies evaluated the temporal profiles that characterize the phenological trajectory of crops, as well as the effects of texture for paddy classification.
Assessing the feature importance
To better understand the effect of various features on the classification outputs, we evaluated the importance of features using the Chi-Squared (χ2) method (Liu & Setiono, Citation1995). The algorithm estimates the importance of the individual features by measuring their χ2 statistics with respect to the classes. The χ2 values were calculated for all of the considered features according to the equations provided in Liu and Setiono (Citation1995). The features were ranked according to the χ2 values, for which the larger the value, the more important the feature is.
C4.5 classification tree
The objects were classified using the C4.5 algorithm (Quinlan, Citation1993). C4.5 is a non-parametric classifier, and it constructs a decision tree using training samples for the class assignment. The algorithm can handle nonlinear relationships between input features and classes (Friedl & Brodley, Citation1997). The C4.5 algorithm identifies a dominant attribute to split the data into smaller subsets based on the highest normalised information gain (difference in entropy). The algorithm repeats this procedure until all instances in a subset belong to the same class. Then, a leaf node is generated in the decision tree ordering to choose that class (Kramer, 2018). Two main parameters, confidence threshold for pruning (c) and the minimum number of instances per leaf (m), were adjusted to achieve the optimum classification by limiting overfitting. The parameters were adjusted using a fivefold cross-validation test, with values ranging from c ∈ {0.15,0.25,0.35,0.45} and m ∈ {1,2,3,4}.
Model training and validation
To train and evaluate the C4.5 classifier, a total of 431 image objects were randomly selected with the help of reference data (). The objects included two classes, that is, paddy fields and others (all classes excluding paddy fields). The sample objects contain spectral, textural and phenological features as described in the section ”Phenological metrics extraction”. These features were exported and saved in an Attribute-Relation File Format to operate inside the WEKA (Hall et al., Citation2009). Training and evaluation were conducted using a stratified 10-fold cross validation procedure. In the10-fold cross validation process, the entire dataset is randomly divided into 10 equal parts. Among the 10 parts, 1 part is used to validate the model while the remaining 9 parts are used to train the model. The cross-validation process is then repeated 10 times, in which each of the 10 parts is used only once as the validation data. In this process, at each fold, one confusion matrix is generated. A final confusion matrix is generated by adding all of the data. Subsequently, overall, the user’s and producer’s accuracies were derived using the confusion matrix (Congalton & Green, Citation2008).
Figure 6. Training and testing samples
Furthermore, the McNemar’s test (Foody, Citation2004) was performed to compare the classification accuracies of various strategies. It is a non-parametric test to assess the significant differences between the accuracy measurement of different classification results (Diao & Wang, Citation2016). For example, McNemar’s test can be used to evaluate whether the classification result using the texture feature is significantly different from that using spectral features. The McNemar’s test is based on the chi-square statistics (EquationEquation (1)(1)
(1) )
Here, f11 denotes the number of testing samples correctly identified by the first classifier, but incorrectly identified by the second classifier. Similarly, f21 denotes the number of testing samples correctly identified by the second classifier, but incorrectly identified by the first classifier. The null hypothesis of this test is that the compared clarifiers should have the same error rate (i.e. f11 = f21).
Results
Four competing detection strategies were explored in this study to characterize the intra-annual phenological trajectory and texture variation in paddy rice classification. Accuracy was measured to evaluate these four classification strategies (). The classification results were considered from four perspectives: (1) the effect of spectral features from a single-date image; (2) the effect of phenological trajectory; (3) the effect of textural features and (4) the optimal features for paddy rice detection.
Table 4. Classification accuracies of detection strategies
Effects of the phenological trajectory on paddy rice detection
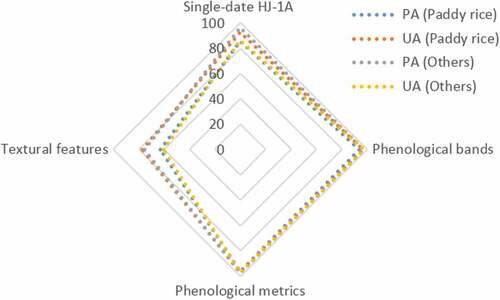
The classification accuracy was compared among phenology-based strategies including the single-date multi-spectral image, phenological bands and phenological metrics. Important phenological-based strategies were explored in this study to capture the seasonal dynamics of paddy rice plants. The single-date HJ-1A image was used as a baseline for benchmarking the HJ and MODIS-based phenological analyses. With the C4.5 classifier, the single-date HJ-1A image yielded an overall accuracy of 89.09% and a Kappa value of 0.78 (). The corresponding producer and user accuracies of the paddy rice class were 85.25% and 92.50%, respectively. Compared to the single-date HJ-1A image, the phenological bands achieved improved classification accuracy. The overall classification accuracy increased from 89.09% to 95.59% and the Kappa value increased from 0.78 to 0.91. The McNemar’s test indicated that the difference between the two classification accuracies was significant (p < 0.05) (). This notable increase in the classification accuracy indicates that the HJ-1A temporal analysis is robust for rice crop detection. The phenological bands capture the gradual changes in plants and utilize this valuable information in discriminating classes.
Table 5. McNemar’s test for comparison between overall accuracies of various classification strategies
When considering the phenological metrics with single-date HJ-1A imagery, the classification accuracy was improved. The overall classification accuracy increased from 89.09% to 96.98% and the Kappa statistics increased from 0.78 to 0.93. The McNemar’s chi-square test indicated that the improved accuracy was statistically significant. The phenological metrics contain information about plant growing events that benefited the classifier in identifying paddy rice from other classes. Between the phenological bands and phenological metrics, the differences in classification accuracy were not significant, indicating their equal contribution to paddy rice detection.
In investigating the commission and omission errors of the two classes (paddy rice and others), it was found that both the phenological bands and phenological metrics performed better than that of the single-date HJ-1A image (). Compared to the classification accuracies of the single-date HJ-1A image, the user accuracy of paddy rice increased by 4.5% and the producer accuracy of the “others” class increased by 1.33% when using the phenological bands. Similarly, with the phenological metrics, the user accuracy of paddy rice increased by 4.5% and the producer accuracy increased by 1.4% compared to the accuracies of a single-date HJ-1A image. The comparison revealed that the areas occupied by the paddy fields were overestimated with the single date HJ-1A image detection strategy, primarily due to spectral confusion among paddy rice and other land cover classes. The phenological information incorporated by the phenological bands and metrics were helpful in correcting these errors. In brief, for paddy rice mapping, the best-performing phenological-based strategy was use of the phenological metrics with the highest overall accuracy (96.98%). The phenological bands and the single date HJ-1A image were respectively ranked second and third with corresponding overall accuracies of 95.59% and 89.09%.
Figure 7. The producer’s accuracy (PA) and user’s accuracy (UA) of two classes (paddy rice and others) using C4.5
Effects of the textural feature on paddy rice detection
The four GLCM textural features (i.e. standard deviation, homogeneity, dissimilarity and entropy) were evaluated for the paddy rice detection. The classification accuracy using the textural features was low. The overall classification accuracy was 68.44% with Kappa statistics of 0.37. The corresponding user and producer accuracies of paddy rice were 77.50% and 63.00%, respectively. Compared to the single-date HJ-1A image, the classification accuracy of the textural-based strategy decreased by 20.65%. The user accuracy and producer accuracies also decreased for both classes (paddy rice and others). The comparative user and producer accuracies are presented in . The lower performance when using only the textural features may be caused by the reduced amount of vital land cover information in these textural features. However, when using the texture as additional information by combining it with the single-date image, the overall classification increased by 2.09% and the Kappa statistics increased by 0.04 compared to the single-date image (not shown). The information regarding surface characteristics contained in the textural feature enhanced the classification accuracy of spectral features in the single-date HJ-1A images.
Important features for paddy rice detection
The χ2 algorithm was applied to all spectral, phenological and textural features to investigate influential features in the characterization and detection of paddy rice (). The algorithm began with all 29 features (i.e. 12 multispectral bands, 9 phenological and 8 textural features) in the model. It calculated the χ2 values and ranked the features accordingly. The rankings and χ2 values of the features are presented in . The essential features indicated by the χ2 values were mostly the phenological features and the band spectral values. The most influential feature was seasonal amplitude, with a χ2 value of 325.7152. The top three influential features are all closely related to the leaf greenness level and vegetation production of paddy rice.
Table 6. Feature importance
Figure 8. Estimated importance of the candidate features selected by the χ2 algorithm (a) all features; (b) phenological metrics; (c) phenological bands and (d) textural features. The x axis represents the following, 1: Seasonal amplitude; 2: Large integral; 3: Peak EVI value; 4: Red band October image; 5: NIR band October image; 6: Blue band October image; 7: Green band February image; 8: Blue band December image; 9: Red band December image; 10: Green band October image; 11: Small integral; 12: GLCM entropy 00; 13: GLCM entropy 900; 14: GLCM Dissimilarity 00; 15: GLCM standard deviation 00; 18: Green band December image; 19: NIR band December image; 20: Base EVI value
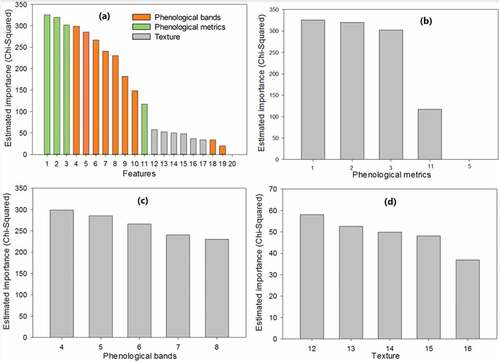
Considering the phenological bands, the most important feature was the red band of the October HJ-1A image, with a χ2 value of 298.886. In the phenological metrics, the highest-ranked feature was seasonal amplitude, which was also the most important among the considered features. Among the textural features, the GLCM entropy 00 was the most important with a χ2 value of 58.0415. The feature importance measure indicated that all of the features contained valuable information for discriminating classes.
Spatial distribution of paddy rice fields
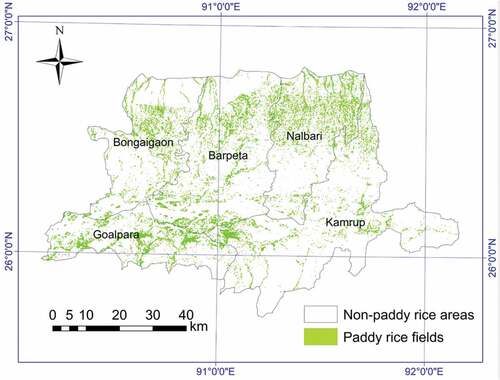
shows the spatial distribution of paddy rice fields in 2014 at a 30 m spatial resolution. Paddy fields were distributed widely and extensively over the region, except in the urban Kamrup district, where fields had a scattered distribution. Most of the fields were concentrated in the plains areas close to rivers. The paddy rice planting area was estimated to be approximately 673.89 km2. Due to the spatial variability in farming time and smaller field sizes, some fields were not identified by the 30 m spatial resolution data. It was observed from the map that the paddy fields were fragmented and small to medium in size across the study site.
Figure 9. The paddy rice planting area map at 30 m spatial resolution, identified by the C4.5 classifier using the top 5 important features
Generated decision tree rules for mapping paddy rice
The classification tree that was applied with the top five important features, resulted in two features: a red spectral band of the October image and a peak EVI value (). The input features are given as ellipses and the terminal nodes are shown as rectangles. The corresponding map generated with this classification rule is presented in . The classification yielded an overall classification accuracy of 96.75% and a Kappa coefficient of 0.93. The first split in the tree used the red band of the October image, indicating the importance of spectral information in paddy rice mapping. The classification with optimal features effectively improves the robustness and detection accuracy with the minimum input features.
Figure 10. C4.5 generated decision tree rules for mapping paddy rice using the top 5 important features
Discussion
Incorporation of phenological trajectory for paddy rice mapping
Mapping paddy rice is a challenge due to the spectral confusion between paddy rice and other vegetation classes. Although the single-date based image analysis is standard for many applications, it is difficult to determine the paddy rice across years and locations without the expert knowledge with a single-date image. Many previous studies have used multiple images to map paddy rice fields. However, they did not consider the phenological variation within a class. For example, paddy rice in various phenological stages (i.e. green-up, flowering and brown-down) may exist in an image. Yet the multiple images are able to capture seasonal changes and effective for paddy rice detection. Though there was a lack of studies that evaluated the influence of within-class phenological variation on effective mapping. This phenological variation remarkably affected the classification accuracy of paddy rice fields.
The roles of temporal HJ-1A and MODIS time series were evaluated from two perspectives: phenological bands and phenological metrics. The detection strategy that notably improved the classification accuracy was the utilization of both phenological bands and phenological metrics. This phenological-based identification demonstrated several advantages compared to a single-date identification strategy. The phenological bands could better capture the seasonal changes in paddy rice. The phenology of paddy plants is affected by factors such as local climate and varying crop development schedules due to farmers’ decisions (Kim & Yeom, Citation2014). These factors, make it challenging to identify paddy rice, specifically in heterogeneous landscapes. Three HJ-1A images that were acquired during the months of October, December and February and that covered the entire paddy growth stages were selected as the most crucial for identifying paddy rice. These selected months are all related to the heading, ripening and fallow stages of paddy rice. Compared to a single-date HJ-1A image, the temporal HJ-1A images provide within-class phenological information, thereby improving the overall classification accuracy of paddy rice.
Role of phenological trajectory and texture in paddy rice mapping
Phenological metrics contributed to the enhancement of overall classification accuracy. The phenological metrics contain plant growing events including the start/end of the season and flowering. This additional information increased the discrimination capacity of the phenological metrics-based strategy. Although the crop shares the same spectral characteristics, phenological events are unique and distinct, which helped in enhancing the classification accuracies. Considering the contribution of phenological bands and metrics, both features are equally essential for paddy rice detection.
The textural features alone were less efficient in discriminating paddy rice. The textural features include earth surface roughness information, and as generalized information and because they lack crucial land cover information, they were less effective in classification. However, the addition of textural features to the single-date spectral features increased the classification accuracy. Therefore, it is suggested to use textural features as additional information instead of a stand-alone input for any classification process. However, textural features are usually ignored due to their minor contribution in classification and longer computation time (Machala & Zejdová, Citation2014).
Role of MODIS temporal data in paddy rice mapping in tropical/sub-tropical regions
Paddy rice primarily grows in tropical regions where cloud cover is persistent. The availability of multiple cloud-free images at fine spatial resolution is limited during the rice growing period, as it usually coincides with the rainy season. The extraction of phenology data requires high temporal resolution data for dense EVI values. In this study, phenological metrics were extracted from the high temporal resolution MODIS time series and were integrated with the fine spatial resolution HJ-1A data. This study demonstrated, how to extract phenological features from coarse resolution (high temporal resolution) data that can be used in fine resolution data for characterizing paddy rice. The integration of coarse resolution phenological metrics with the fine resolution spectral data demonstrated opportunities to discriminate paddy rice from other classes. However, coarse spatial resolution MODIS may not achieve the full potential of EVI time series in determining crop phenology. It will be beneficial to create an EVI time series from relatively fine spatial resolution Landsat and Sentinal-2 data. However, due to the limited availability of the dense cloud-free time series images in the study site, the Landsat or Sentinel-2 imagery-based EVI were not used for phenology generation in this study. In future studies, to construct a dense time series of vegetation index, data fusion algorithms, such as the Spatial and Temporal Adaptive Reflectance Fusion model (Gao, Masek, Schwaller, & Hall, Citation2006) and the Flexible Spatiotemporal Data Fusion method (Zhu et al., Citation2016), are an available option. PALSAR data are capable of identifying forest areas. The FNF derived from the PALSAR was used in this study as a forest mask in the paddy mapping process. The forest mask resolves the confusion between cropland and natural vegetation classes, thereby demonstrating the advantages of using multi-source remote sensing data in paddy rice mapping in complicated agriculture systems.
Role of multi-source data for paddy rice mapping
Many previous studies have focused on paddy rice mapping and monitoring using MODIS time series data (Dong & Xiao, Citation2016). The MODIS-based studies were primarily coarse resolution (250 m to 1 km). In this study, we used the MODIS data to derive phenological information and to integrate them with HJ-1A spectral images to map paddy rice at the spatial resolution of HJ-1A (30 m). Paddy rice mapping at fine or medium resolution was primarily constrained by the lower availability of cloud-free images acquired during the paddy planting or flooding period, as a large proportion of paddy rice grows in tropical regions and the planting period coincides with the wet season. The availability of images at the planting period is crucial for paddy rice mapping because during the planting period, paddy fields are flooded with water and the flooded paddy fields reflect unique features. In this study, instead of directly using the spectral features of MODIS data to map paddies at the MODIS native scale (250 m to 1 km), the phenological features extracted from the MODIS data were used as an add-on to the HJ-1A images. We demonstrated how abundant MODIS data are helpful in increasing the paddy rice mapping accuracy on fine resolution (HJ-1A) imagery. Few studies exist for Landsat 8-based paddy rice area mapping (Dong & Xiao, Citation2016). Previous studies have demonstrated few valid observations from Landsat 8 data due to frequent cloud cover, which limits its usability in tropical/sub-tropical regions such as our study area. Despite having a 16-day revisit cycle, it is not uncommon for Landsat 8 to pass 1 or 2 months without acquiring any cloud-free images in high rainfall areas of northeast India. Recently, Dong et al. (Citation2016) used Landsat 8 images to map paddy rice in northeastern Asia. Their study used Google Earth Engine for the intense processing of the large time series Landsat 8 images. The study was successful due to the increased observations from the Landsat 8 images, made available by sidelaps in high altitude regions. In an another study, Gumma, Uppala, Mohammed, Whitbread, and Mohammed (Citation2015) used two dates Landsat-8 images combined with temporal RISAT-1 and time series MODIS data to classify direct seeded rice areas. This study was successful due to the use of multi-source data and a hybrid algorithm. In our study, we used temporal HJ-1A images instead of Landsat 8 images. The 4-day revisit cycle of HJ-1A increased the good quality observations for the study period for paddy rice mapping. In our study, the HJ-1A imagery provided the spatial pattern of paddy rice areas, MODIS data provided the temporal characteristics of the paddy rice, and the PALSAR FNF data removed the forest areas in the study region.
Comparison of the derived paddy rice map with an IRRI-based paddy rice map
The International Rice Research Institute (IRRI) (https://www.irri.org) has provided paddy rice maps for Asia (2000–2001), Nepal (2000–2009), Bangladesh (2010), the Philippines (2000–2012), Tamil Nadu (2001–2011) and Orissa (2000–2011) of India. These maps are coarse resolution and are derived from MODIS data. We compared our results to the paddy rice map of lowland Asia provided by the IRRI (Nelson & Gumma, Citation2015). The comparison of our results with the paddy rice maps of IRRI showed a consistent spatial pattern (Figure 11). The MODIS-based IRRI maps overestimated the paddy rice areas. Due to the coarse resolution of MODIS data (250–1000 m), small vegetated areas, buildings, roads and some other classes were included in the paddy rice classes as a mixed pixels. The compared maps are also from different time periods, which leads to additional variation in the maps. The HJ-1A based results show paddy rice areas accurately and in more detail, with its 30 m resolution excluding small vegetated areas and other non-paddy rice classes. Despite the various spatial resolutions of the products, the comparison verifies the strength of the HJ-1A results as supported by temporal features that were extracted from MODIS data in identifying paddy rice areas.
Accurate mapping of paddy rice in tropical regions is important for a thorough understanding of food security and environmental sustainability. The advancement of remote sensing-based image analysis techniques has facilitated the identification of paddy rice at regional and local scales. However, remote sensing-based paddy rice mapping across a heterogeneous landscape still faces several challenges and limitations. To overcome the limitations, a phenological-based classification strategy and textural features were evaluated and presented for MODIS and HJ-1A images. The presented strategies show great potential for monitoring the dynamics of paddy rice by utilizing freely available multi-source data from Landsat, MODIS, PALSAR and Sentinel.
Conclusions
In this study, phenology and textural based classification strategies (i.e. phenological bands, phenological metrics and textural feature) were developed with time series MODIS and HJ-1A images to evaluate their utility in paddy rice detection. The chi-squared algorithm was employed to determine the vital features for discriminating paddy rice from other crops and vegetation. This study also demonstrated the integration of coarse spatial resolution phenological features with fine spatial resolution spectral features. Compared to the traditional single date-based detection strategy, the phenological bands and phenological metrics improved the classification accuracy. The detection accuracy when using the phenological features improved, primarily due to their capability of revealing additional information about crop growing events. It was found that the contributions of phenological bands and phenological metrics were equal in detecting paddy rice. Specifically, the seasonal amplitude of phenological metrics, including the spectral feature of the October month and the entropy feature of the textural category, were found to be most crucial in discriminating paddy rice. With the recent availability of free, multi-source and multi-resolution imagery, the proposed approach has potential to facilitate long-term, rapid and regional monitoring of paddy rice fields.
Acknowledgments
Sangeeta Sarmah, acknowledges the China Scholarship Council for the fellowship to carry out the research. The HJ-1A images were kindly provided by the China Center for Resource Satellite Data and Applications (CRESDA). We thank the Digital Agriculture lab of Institute of Remote Sensing and Digital Earth, Chinese Academy of Sciences, for providing us access to the HJ-1A images and offering support and help during field data collection.
Disclosure statement
No potential conflict of interest was reported by the authors.
References
- Asner, G.P. (2001). Cloud cover in Landsat observations of the Brazilian Amazon. International Journal of Remote Sensing, 22(18), 3855–3862. doi:10.1080/01431160010006926
- Baatz, M., & Schäpe, A. (2000). Multiresolution segmentation: An optimization approach for high quality multi-scale image segmentation (Vol. 58). Berlin, Germany.: Herbert Wichmann Verlag.
- Blaschke, T. (2010). Object based image analysis for remote sensing. ISPRS Journal of Photogrammetry and Remote Sensing, 65(1), 2–16. doi:10.1016/j.isprsjprs.2009.06.004
- Blaschke, T., Hay, G.J., Kelly, M., Lang, S., Hofmann, P., Addink, E., … van Coillie, F. (2014). Geographic object-based image analysis–Towards a new paradigm. ISPRS Journal of Photogrammetry and Remote Sensing, 87, 180–191. doi:10.1016/j.isprsjprs.2013.09.014
- Boschetti, M., Nutini, F., Manfron, G., Brivio, P.A., & Nelson, A. (2014). Comparative analysis of normalised difference spectral indices derived from MODIS for detecting surface water in flooded rice cropping systems. PLoS One, 9(2), e88741. doi:10.1371/journal.pone.0088741
- Bouman, B.A.M., Humphreys, E., Tuong, T.P., & Barker, R. (2007). Rice and water. Advances in Agronomy, 92, 187–237.
- Chen, J., Jönsson, P., Tamura, M., Gu, Z., Matsushita, B., & Eklundh, L. (2004). A simple method for reconstructing a high-quality NDVI time-series data set based on the Savitzky–Golay filter. Remote Sensing of Environment, 91(3), 332–344. doi:10.1016/j.rse.2004.03.014
- Congalton, R.G., & Green, K. (2008). Assessing the accuracy of remotely sensed data: Principles and practices. Boca Raton, FL, USA :CRC Press.
- Diao, C., & Wang, L. (2016). Incorporating plant phenological trajectory in exotic saltcedar detection with monthly time series of Landsat imagery. Remote Sensing of Environment, 182, 60–71. doi:10.1016/j.rse.2016.04.029
- Dong, J., & Xiao, X. (2016). Evolution of regional to global paddy rice mapping methods: A review. ISPRS Journal of Photogrammetry and Remote Sensing, 119, 214–227. doi:10.1016/j.isprsjprs.2016.05.010
- Dong, J., Xiao, X., Menarguez, M.A., Zhang, G., Qin, Y., Thau, D., … Moore, B. (2016). Mapping paddy rice planting area in northeastern Asia with Landsat 8 images, phenology-based algorithm and Google Earth Engine. Remote Sensing of Environment, 185, 142–154.
- Drǎguţ, L., Tiede, D., & Levick, S.R. (2010). ESP: A tool to estimate scale parameter for multiresolution image segmentation of remotely sensed data. International Journal of Geographical Information Science, 24(6), 859–871. doi:10.1080/13658810903174803
- Foody, G.M. (2004). Thematic map comparison. Photogrammetric Engineering & Remote Sensing, 70(5), 627–633. doi:10.14358/PERS.70.5.627
- Friedl, M.A., & Brodley, C.E. (1997). Decision tree classification of land cover from remotely sensed data. Remote Sensing of Environment, 61(3), 399–409. doi:10.1016/S0034-4257(97)00049-7
- Gao, F., Masek, J., Schwaller, M., & Hall, F. (2006). On the blending of the landsat and MODIS surface reflectance: Predicting daily landsat surface reflectance. IEEE Transactions on Geoscience and Remote sensing, 44(8), 2207–2218.
- Gilbert, M., Xiao, X., Pfeiffer, D.U., Epprecht, M., Boles, S., Czarnecki, C., … Otte, M.J. (2008). Mapping H5N1 highly pathogenic avian influenza risk in Southeast Asia. Proceedings of the National Academy of Sciences of the United States of America, 105(12), 4769–4774. doi:10.1073/pnas.0710581105
- Govt of India, Ministry of Agriculture, & Department of Agriculture and Cooperation. (2015). Agricultural statistics at a glance 2014. New Delhi: Govt of India, Ministry of Agriculture.
- Gumma, M.K., Uppala, D., Mohammed, I.A., Whitbread, A.M., & Mohammed, I.R. (2015). Mapping direct seeded rice in Raichur district of Karnataka, India. Photogrammetric Engineering & Remote Sensing, 81(11), 873–880. doi:10.14358/PERS.81.11.873
- Hall, M., Frank, E., Holmes, G., Pfahringer, B., Reutemann, P., & Witten, I.H. (2009). The WEKA data mining software: An update. ACM SIGKDD Explorations Newsletter, 11(1), 10–18. doi:10.1145/1656274
- Haralick, R.M., & Shanmugam, K. (1973). Textural features for image classification. IEEE Transactions on Systems, Man, and Cybernetics, (6), 610–621. doi:10.1109/TSMC.1973.4309314
- Kramer, S. (2018). J48 — OpenTox. Retrieved from April 19, 2018,http://old.opentox.org/dev/documentation/components/j48
- Jonsson, P., & Eklundh, L. (2002). Seasonality extraction by function fitting to time-series of satellite sensor data. IEEE Transactions on Geoscience and Remote sensing, 40(8), 1824–1832.
- Jönsson, P., & Eklundh, L. (2004). TIMESAT—A program for analyzing time-series of satellite sensor data. Computers & Geosciences, 30(8), 833–845. doi:10.1016/j.cageo.2004.05.006
- Kim, H.-O., & Yeom, J.-M. (2014). Effect of red-edge and texture features for object-based paddy rice crop classification using RapidEye multi-spectral satellite image data. International Journal of Remote Sensing, 35(19), 7046–7068.
- Kuenzer, C., & Knauer, K. (2013). Remote sensing of rice crop areas. International Journal of Remote Sensing, 34(6), 2101–2139. doi:10.1080/01431161.2012.738946
- Li, P., Feng, Z., Jiang, L., Liu, Y., & Xiao, X. (2012). Changes in rice cropping systems in the Poyang lake region, China during 2004–2010. Journal of Geographical Sciences, 22(4), 653–668. doi:10.1007/s11442-012-0954-x
- Liu, H., & Setiono, R. (1995). Chi2: Feature selection and discretization of numeric attributes. in Proceedings of the IEEE Seventh International Conference on Tools with Artificial Intelligence(pp. 388–391).IEEE
- Machala, M., & Zejdová, L. (2014). Forest mapping through object-based image analysis of multispectral and LiDAR aerial data. European Journal of Remote Sensing, 47, 117–131. doi:10.5721/EuJRS20144708
- Maclean, J., Hardy, B., & Hettel, G. (2013). Rice almanac: Source book for one of the most important economic activities on earth. Los Baños(Philippines): IRRI.
- McNairn, H., Shang, J., Jiao, X., & Champagne, C. (2009). The contribution of ALOS PALSAR multipolarization and polarimetric data to crop classification. IEEE Transactions on Geoscience and Remote Sensing, 47(12), 3981–3992. doi:10.1109/TGRS.2009.2026052
- Miyaoka, K., Maki, M., Susaki, J., Homma, K., Noda, K., & Oki, K. (2013). Rice-planted area mapping using small sets of multi-temporal SAR data. IEEE Transactions on Geoscience and Remote Sensing, 10(6), 1507–1511.
- Nelson, A., & Gumma, M.K. (2015). A map of lowland rice extent in the major rice growing countries of Asia. Los Baños, Philippines: IRRI. p. 37.
- Nguyen, N.V. (2008). Global climate changes and rice food security, FAO.
- Peña-Barragán, J.M., Ngugi, M.K., Plant, R.E., & Six, J. (2011). Object-based crop identification using multiple vegetation indices, textural features and crop phenology. Remote Sensing of Environment, 115(6), 1301–1316. doi:10.1016/j.rse.2011.01.009
- Qiu, B., Li, W., Tang, Z., Chen, C., & Qi, W. (2015). Mapping paddy rice areas based on vegetation phenology and surface moisture conditions. Ecological Indicators, 56, 79–86. doi:10.1016/j.ecolind.2015.03.039
- Quinlan, J.R. (1993). C 4.5: Programs for machine learning. The Morgan Kaufmann series in machine learning. C1993, 1. San Mateo, CA: Morgan Kaufmann.
- Sass, R.L., & Cicerone, R.J. (2002). Photosynthate allocations in rice plants: Food production or atmospheric methane? Proceedings of the National Academy of Sciences of the United States of America, 99(19), 11993–11995. doi:10.1073/pnas.202483599
- Shimada, M., Itoh, T., Motooka, T., Watanabe, M., Shiraishi, T., Thapa, R., & Lucas, R. (2014). New global forest/non-forest maps from ALOS PALSAR data (2007–2010). Remote Sensing of Environment, 155, 13–31. doi:10.1016/j.rse.2014.04.014
- Singha, M., Wu, B., & Zhang, M. (2016a). An object-based paddy rice classification using multi-spectral data and crop phenology in Assam, Northeast India. Remote Sensing, 8(6), 479. doi:10.3390/rs8060479
- Singha, M., Wu, B., & Zhang, M. (2016b). Object-based paddy rice mapping using HJ-1A/B data and temporal features extracted from time series MODIS NDVI data. Sensors, 17(1), 10. doi:10.3390/s17010010
- Thenkabail, P.S., Knox, J.W., Ozdogan, M., Gumma, M.K., Congalton, R.G., Wu, Z., … Mariotto, I. (2012). Assessing future risks to agricultural productivity, water resources and food security: How can remote sensing help?. Photogrammetric Engineering and Remote Sensing, 78(8), 773–782.
- Wang, J., Xiao, X., Qin, Y., Dong, J., Zhang, G., Kou, W., … Zhang, Y. (2015). Mapping paddy rice planting area in wheat-rice double-cropped areas through integration of Landsat-8 OLI, MODIS, and PALSAR images. Scientific Reports, 5.
- Wu, B., Gommes, R., Zhang, M., Zeng, H., Yan, N., Zou, W., … Xing, Q. (2015). Global crop monitoring: A satellite-based hierarchical approach. Remote Sensing, 7(4), 3907. doi:10.3390/rs70403907
- Wu, B., & Li, Q. (2012). Crop planting and type proportion method for crop acreage estimation of complex agricultural landscapes. International Journal of Applied Earth Observation and Geoinformation, 16, 101–112. doi:10.1016/j.jag.2011.12.006
- Zhang, G., Xiao, X., Dong, J., Kou, W., Jin, C., Qin, Y., … Biradar, C. (2015). Mapping paddy rice planting areas through time series analysis of MODIS land surface temperature and vegetation index data. ISPRS Journal of Photogrammetry and Remote Sensing, 106, 157–171. doi:10.1016/j.isprsjprs.2015.05.011
- Zhang, Y., Wang, C., Wu, J., Qi, J., & Salas, W.A. (2009). Mapping paddy rice with multitemporal ALOS/PALSAR imagery in southeast China. International Journal of Remote Sensing, 30(23), 6301–6315. doi:10.1080/01431160902842391
- Zhu, X., Helmer, E.H., Gao, F., Liu, D., Chen, J., & Lefsky, M.A. (2016). A flexible spatiotemporal method for fusing satellite images with different resolutions. Remote Sensing of Environment, 172, 165–177. doi:10.1016/j.rse.2015.11.016
- Zhu, Z., Woodcock, C.E., Holden, C., & Yang, Z. (2015). Generating synthetic Landsat images based on all available Landsat data: Predicting Landsat surface reflectance at any given time. Remote Sensing of Environment, 162, 67–83. doi:10.1016/j.rse.2015.02.009