
 ?Mathematical formulae have been encoded as MathML and are displayed in this HTML version using MathJax in order to improve their display. Uncheck the box to turn MathJax off. This feature requires Javascript. Click on a formula to zoom.
ABSTRACT
Synthetic Aperture Radar (SAR) data are used to map affected urban areas after an earthquake generally exploiting change detection techniques. In this paper, a novel change detection approach is proposed for multitemporal (SAR) images. The approach is based on two different parts, which are constructed through principal components (PCs) of multiple textural features and correlation analysis image, respectively. In the extraction of the PCs of texture, the principal component analysis technique is used to separate irrelevant and noisy elements. Then, correlation change detection (CCD) is carried out to detect the changes associated with the building collapse. Considering the earthquake that hit L’Aquila city (Italy) on 6 April 2009, the effectiveness of the proposed method is proved by the experiment results obtained on real SAR images data sets collected before and after the seismic event.
Introduction
The information regarding building damage is essential for rescue, humanitarian, and reconstruction operations in earthquake disaster areas (Jiang, Wang, & Zhao, Citation2010). Rapid impact assessment after the earthquake is crucial for initiating effective emergency response actions. The Earth Observation data can provide important information about the affected areas since they can map the regions of interest quickly, on a global scale perspective, and in an uncensored manner (Chen et al., Citation2017; Shi et al., Citation2017). Synthetic Aperture Radar (SAR) is strongly sensitive to surface changes, and earthquake caused serious damage and building collapse modify the electromagnetic behaviour so that damage change detection from SAR images acquired pre- and post-earthquake becomes possible (Matsuoka & Yamazaki, Citation2004a; Wang & Ogawa, Citation2017).
In the past several years, the medium spatial resolution SAR intensity images, such as ERS SAR, ENVISAT ASAR and Radarsat-1 SAR, have been used to detect damaged buildings in urban areas due to the earthquake. The medium-resolution SAR images can provide a simple, quick, and effective means with which the earthquake disasters can be monitored and evaluated based on the detection of changes in images obtained before and after an earthquake. Many papers evaluated change detection approaches applying the subtraction operator or the ratio operator to estimate damage within large areas (e.g. city blocks). (Cihlar, Pultz, & Gray, Citation1992; Lu, Mausel, Brondízio, & Moran, Citation2004; Rignot & van Zyl, Citation1993). A difference image can be generated by applying the subtraction operator or the ratio operator to the intensity of the two multitemporal images pixel by pixel (Celik, Citation2010). These methods are sensitive to the speckle effect. Additionally, the different image is expressed in a logarithmic scale. The effectiveness of such an operator to suppress speckle noise is limited because it ignores the spatial information. Aghababaee, Amini, and Tzeng (Citation2013) improved the change detection method using the new measures containing a grey level gradient or intensity information and the fractal dimension. Although many features including texture features and spatial information can be used as input of traditional algebraic operation change detection algorithm, the detection accuracy is not high because of the influence of speckle noise.
To effectively reduce the impact of noise, many new algorithms have been introduced to change detection. Gong, Yang, and Zhang (Citation2017) applied deep neutral networks to SAR image change detection without the generation of difference image, in which change detection problem is transformed into a classical classification task. Hou, Wei, Zheng, and Wang (Citation2014) presents a novel-unsupervised change detection method in SAR images based on image fusion strategy and compressed projection. Moya, Mas, Adriano, Koshimura, and Yamazaki (Citation2017) estimate the distribution of building damage by joining these two sources of information: change detection of pre-and post-event SAR images and spatial distribution of strong motion intensity. Sharma et al. (Citation2017) present Earthquake Damage Visualisation (EDV) based on the pre-seismic and co-seismic coherence change method. In this procedure, SAR intensity information seems to be more commonly applied in damage assessment (Matsuoka & Yamazaki, Citation2004b, Matsuoka & Yamazaki, Citation2005; Matsuoka, Yamazaki, & Ohkura, Citation2007; Matsuoka & Nojima, Citation2010a; Matsuoka, Koshimura, & Nojima, Citation2010b). In order to make full use of all the features and make change images suitable for different situnations, Aoki, Matsuoka, and Yamazaki (Citation1998) used backscattering differences and intensity correlation coefficients to quantitatively evaluate building damage using ERS-1 images for the 1995 Hyogoken-Nanbu earthquake. In subsequent research, the interferometric coherence was adopted to analyse the damage (Yonezawa & Takeuchi, Citation1999). Yonezawa and Takeuchi (Citation2001) applied ERS-1 interferometric coherence to assess building damage related to the Infoterra, Citation2008 Hyogoken-nanbu earthquake in Japan. They found the collapse and damage to buildings changed the backscattering characteristic and led to decorrelation between the data acquired before and after the earthquake. Matsuoka and Yamazaki (Citation2000) also used ERS-1 coherence to investigate the 1999 Kocaeli earthquake in Turkey. In addition to the interferometric coherence, a derived coefficient called the temporal coherence ratio was adopted to quantitatively analyze the damage (Ito & Hosokawa, Citation2002; Ito, Hosokawa, & Matsuoka, Citation2003). Karimzadeh and Matsuoka (Citation2018) combined SAR intensity and SAR coherence using multitemporal discriminant and fuzzy analyses to obtain different damage. Although these methods made use of feature information, the method may fail to detect changes. The reason for this is that when changes occur at the texture level, the mean value may still be preserved.
For SAR images, texture, which is a representation of the spatial relationship of grey levels in an image, provides important characteristics for surface and object identification. Therefore, SAR images of urban areas have stable textural characteristics with which it is possible to detect changes in the urban environment. Texture is an important characteristic which can be used to identify various objects or regions in an image. Besides, texture can depress the effect of SAR image speckle noise. Accordingly, texture features along with spectral and morphological operators have been shown to have a positive impact on the accuracy of detection in remote sensing images (Khurana & Saxena, Citation2017; Wu et al., Citation2017; Zhuang, Deng, & Fan, Citation2016). Li, Huang, Wen, and Liu (Citation2017) proposed a multi-texture change detection method by integrating macro- and micro-texture features. Sofina and Ehlers (Citation2017) presented a semi-automated feature-based approach to the identification of building conditions especially in affected areas using geographic information systems (GIS) and remote sensing information, where texture features provide information about the area inside the buildings. However, the motioned methods work under a single or unique texture, which is possible that some available information might be lost and erroneous results derived.
In this paper, we propose a novel method to detect the damage degree of buildings in an urban setting affected by an earthquake using pre- and post-event detected SAR images. The main objective is testing the capability to determine from the change of principal components of the texture features whether a building is destroyed or is still likely to be intact. In order to give a proper answer and to avoid biasing the results according to the adopted methodology, we test a couple of different change detection (CD) techniques and many texture features, and proposed a methodological approach based on the Principal Component Analysis (PCA).
Two specific aspects of this work are deemed important to satisfy the final user needs according to our experience. The first aspect, the user needs a reliable (in statistical sense) and standardised definition of the accuracy of the delivered product (i.e. the damage map in our case). The second aspect, which is deemed important, is the comparison of classification performances against a damage classification based on the building classification in the Chinese Seismic Intensity Scale GB/T17742-2008(China Earthquake Administration (CEA), Citation2008), thus providing a well-known and reliable reference, as well as a common definition of the classification taxonomy. Buildings are classified into five classes in China which include slight damage, moderate damage, substantial to heavy damage, very heavy damage and destruction in the ground investigation. Remote sensing images can only obtain the surface information of buildings in virtue of the restriction of imaging modes. Accordingly, remotely sensed earthquake-related damage is divided into three categories: intact building, moderately damaged building (containing moderate damage and substantial to heavy damage), and destroyed building (containing very heavy damage and destruction). The analysis of this paper is based on this classification.
Specifically, the experiment was carried out considering the earthquake that hit the city of L’Aquila, Italy, in 2009. The image classification results were compared to the ground surveys carried out by the Dell’Acqua et al. (Citation2011). The work provides several hints into the problem, on the way to evaluate the classification performances and understand the advantages of PCA and texture features.
This paper presents the work we performed using the CD of remote sensing imagery and the remainder of this paper is organised as follows. Section 2 provides the test case and the datasets used for the study. Section 3 describes the detail of the method proposed for change detection based on the dimensionality reduction of the texture features. Section 4 presents the experimental results and the effectiveness of the method and, finally, the conclusions are presented in Section 5.
The test case and datasets
L’aquila earthquake
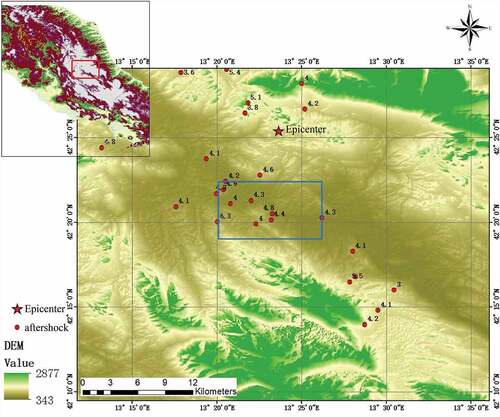
On 6 April 2009 at 1:32 GMT, an earthquake hit L’Aquila city, in Central Italy. The mainshock was rated 6.3 on the moment magnitude (Mw) scale; the epicentre was located near L’Aquila, at a depth of about 9 km. Several major aftershocks (Mw>5) and thousands of smaller events occurred in the next few months in an area extended NW-SE for about 35k m. This earthquake took more than 300 lives, caused more than 1,500 people injured and made about 65,000 people homeless. It was the deadliest earthquake in Italy after the Irpinia earthquake in 1980. The earthquake caused damage to thousands of buildings in the medieval city centre of L’Aquila. Some buildings fully collapsed, thus leading to a sparse damage distribution within a high-density urban area. The epicentre topography and historical earthquake map of the L’Aquila earthquake is shown in .
Figure 1. Epicentre topography and historical earthquake map of the L’Aquila earthquake, blue box represents study area
SAR datasets
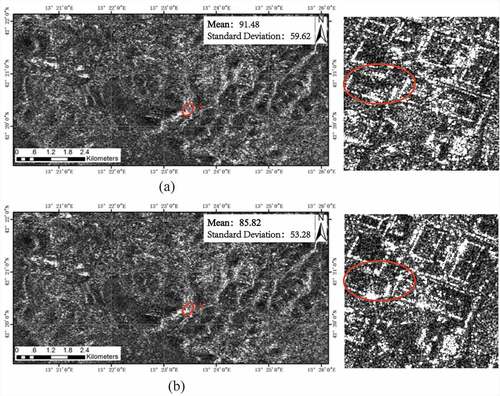
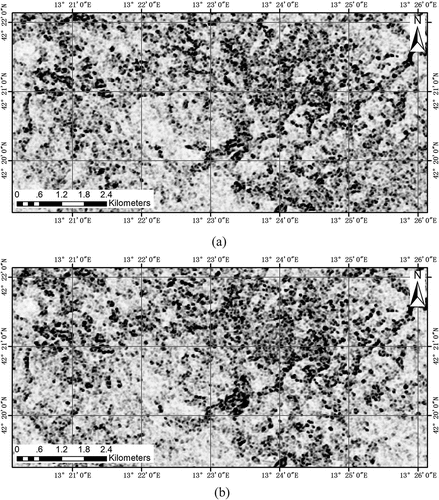
We carried out the present work using two SAR images taken from the ENVISAT satellite (see ). The image before the earthquake is dated 1 February 2009, while the post-seismic image was collected on 12 April 2009. In , the main characteristics of the datasets are reported. The mean and standard deviation of images before and after the earthquake have changed.
Table 1. The main characteristics of the SAR datasets
Figure 2. Multi-temporal SAR datasets of the L’Aquila earthquake zones:(a) and (b) represent ENVISAT-ASAR images before and after the L’Aquila earthquake, respectively. A and A’ represent the same area of the image before and after the earthquake, respectively. The small graph on the right side shows the enlarged image. The obvious difference can be seen in the red circle of the small map
Ground truth data
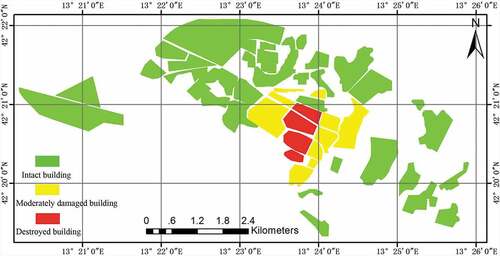
The ground truth data available for the selected test site comes from the results of visual interpretation provided by the Italian Civil Protection Department (DPC) with the aerial image acquired by the Italian Air Force (see ). A partition of the image into 58 blocks was made by visual inspection and a GIS layer was produced. It allows assigning a Damaged Area Ratio to each block in the GIS layer.
Figure 3. Damage distribution of L’Aquila earthquake. The colour polygons represent the damage grade
Methodology
Before analysis, the digital numbers of the SAR data were converted into radar sigma naught values as follows (Infoterra, Citation2008):
Where is the calibration and processor scaling factor given by the parameter calculator in the annotated file, DN is the pixel intensity value, and NEBN is the Noise Equivalent Beta Naught. NEBN represents the influences of different noise contributions on the signal.
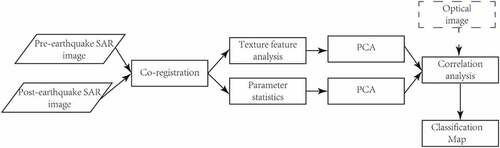
is the local incidence angle. To reduce speckle noise, many well-known adaptive filters can be used before generating the difference images, e.g. the Lee, the Kuan, the Frost, and the Gamma-MAP filter. In this paper, the Lee filter is applied to the SAR images before generating the difference images. Considering SAR images of different phases need to be registered. In this work, the automatic registration method based on scale invariant features transform (SIFT) was used. Then, the technical flowchart of the method is shown in . The method is mainly divided into four main processes: (1) the generation of texture features, (2) analysis of PCs, (3) the automatic correlation analysis of PCs and (4) damage classification.
Figure 4. Technical scheme of the proposed method
The generation of texture features
There are many different texture analysis techniques (Beliakov, James, & Troiano, Citation2008; He, Wang, & Guibert, Citation1987; Suyash, Citation2006), e.g. the Linde Buzo Gray, Kekre’s Proportionate Error (Kekre, Thepade, & Sarode, Citation2010), and greyscale-level co-occurrence matrix (GLCM) algorithms. Texture feature extraction based on GLCM is a classical statistical analysis method that has been applied to the texture extraction of high-resolution and multispectral remote sensing images (Hu, Li, & Du, Citation2009).
GLCM examines the spectral as well as the spatial distribution of grey values (Pesaresi & Benediktsson, Citation2001). The GLCM emphasises the spatial dependence of the greyscale level, which is characterised by the spatial relation of the pixels in a texture pattern (Baraldi & Parmiggiani, Citation1995; Chen & Deng, Citation2002). Haralick, Shanmugan, and Dinstein (Citation1973) proposed 14 features based on GLCM for textural analysis. Referring to the previous research results (Wu et al., Citation2016), from the resulting GLCM, eight textural features are chosen for the analysis: mean (ME), variance (VA), contrast (CON), entropy (ENT), homogeneity (HOM), dissimilarity (DI), correlation (COR), and angular second moment (ASM).
Selection of feature analysis parameters
When textural measures derived from the GLCM are used, some fundamental parameters should be defined, including orientation values, step size, the window size, and image quantization level. The arrangement of buildings in an earthquake area is often complex and diverse, which means it is appropriate to take an average value of four directions (0°, 45°, 90°, and 135°) as the GLCM of the centre pixel position. The image quantization level of 64 and step size of 1 are adopted to calculate the GLCM.
The biggest impact on the feature value is the size of the window. Therefore, we design a statistical method to choose the optimal calculation parameters. Taking the mean value of VA and ENT as examples, both quantities are calculated for the change trends of different feature values using window sizes that vary from 3 × 3–51 × 51 at intervals of 4. presents the evolution of variance in relation to window size for the textural measures.
Figure 5. Evolution of variance in relation to window size for textural measures
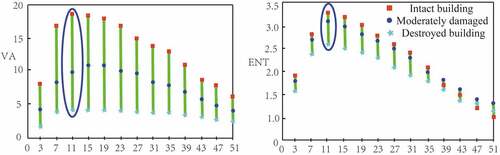
The VA of the buildings at different levels reach a maximum for a window size of 11 × 11, following which the VA decreases with window size gets larger. For ENT, the ability to distinguish between the degrees of intact and moderately damaged building is poor, but the results for destroyed building are better. The statistical results show an 11 × 11 pixel window to be an appropriate choice for the textural measures.
Optimal texture feature selection
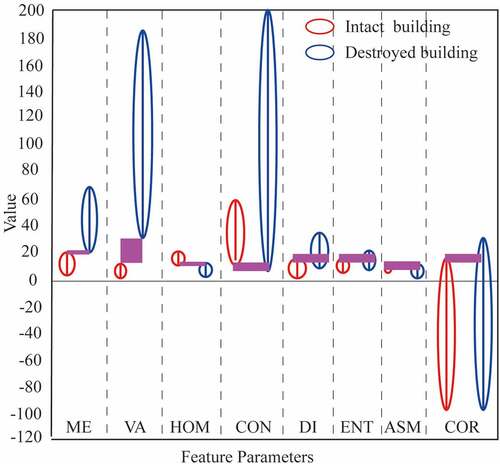
To reduce the inter-correlation of multiple texture features, it is necessary to determine optimal texture features for the study analysis. The sample statistical analysis is adopted in this experiment. The texture feature values of intact and damaged buildings can cover those of moderately damaged buildings. In addition, the selection of moderately damaged buildings is influenced by human experience. Therefore, intact and destroyed buildings are chosen to participate in the analysis.
Note that in the sample selection the samples are uniformly distributed in the image. Finally, 25 intact building samples and 39 destroyed building samples are selected. After that, the texture feature values of the samples are computed separately. illustrates the statistical analysis of the range of the feature values. To perform the comparative analysis, the parameters in the figure are expanded by a factor of 10. The maximum and minimum values of the ME, VA, and HOM parameters are either close or have certain differences between intact and destroyed buildings. There is no intersection among different categories and the parameters can be used to distinguish different damage degrees. Therefore, the ME, VA, and HOM are all capable of characterising the buildings with different-damaged degrees in our experiment.
Figure 6. Statistical distribution of SAR image characteristic parameters of different types of building. For improved clarity, the scale of the values is enlarged by a factor of 10
Analysis of PCs
After obtaining three textural features, we need to reduce the dimension and obtain the PCs. To solve these problems, the principal component analysis (PCA) method is adopted. PCA is a simple nonparametric method and has been adopted widely in the fields of machine learning and pattern recognition (Jolliffe, Citation1986). PCA is able to determine the subspace of a feature vector that causes a dataset to be projected onto the subspace (Abdi & Williams, Citation2010; Clausen & Wechsler, Citation2000). In the field of machine learning, PCs are often considered the key features of information data and thus, PCA is often used for feature extraction and dimensionality reduction (Martis, Chakraborty, & Ray, Citation2009; Sharma, Dandapat, & Mahanta, Citation2012).
The combination of multiple texture features will have redundant information, which will affect the effectiveness of the method to a certain extent. The method of PCA can be used to reduce the dimension of redundant information and to maximise the advantage of the texture features. Since the first PC covers more than 90% of all information, we consider that the first PC might be appropriate for information detection. The first PC of texture features of ME, VA, and HOM is shown in .
Figure 7. The first PC of texture features of ME, VA, and HOM: (a) before and (b) after the earthquake
Automatic correlation analysis of PCs
To describe the changes in the PCs quantitatively before and after the earthquake, we introduce the method of correlation analysis. Correlation analysis is a change detection method based on neighbourhood, which considers adjacent regions rather than isolated pixels; thus, it can depress the influence of speckle noise. The correlation between SAR images at different time phases can be used to determine the changes between the images. Its definition is as follows:
where m and n represent the window size; and
are the feature values of the corresponding pixel of the image pre- and post-earthquake, respectively; and
and
represent the mean of the image pre- and post-earthquake, respectively. The range of the correlation coefficient
is [−1, 1]. The closer the linear relationship between the two images, the higher the degree of similarity. In this experiment, the correlation analysis calculation window size is taken as 3 and the correlation coefficient
adopts the absolute value, therefore, its value range is [0, 1].
Damage classification
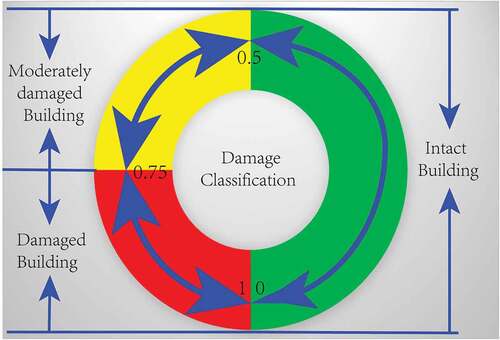
The most important step in change detection is threshold determination and identification of change information. To this aim, we considered the correlation coefficient threshold and assessed the potential to discriminate between heavy-damaged buildings and moderately damaged or intact buildings. Gong and Zhang (Citation2013) summarised the relationship between the correlation threshold and damage grade using ALOS image in the Dujiangyan area (). Since the method used is consistent, the investigation was carried out considering these threshold parameters.
Figure 8. The relationship between the correlation threshold and damage grade
Results and discussion
To verify the feasibility and accuracy of our proposed method, we displayed the numerical results using the same datasets. All experiments aimed to verify the following points: (1) to demonstrate that the proposed PC of texture features correlation change detection could provide better performance compared with intensity correlation change detection and (2) to show that change detection based on PCA of texture has more stable and higher accuracy compared with traditional change detection methods.
Correlation change detection (CCD) results
After image filtering, the texture features were calculated using the GLCM method and the three feature parameters (ME, VA, and HOM) were extracted. Then, the three features were combined and the first PCs of the texture features were obtained. presents the first PC of ME, VA, and HOM before and after the earthquake. The correlation change detection between the PCs (PTFCCD) was calculated using the independent development of correlation analysis software.
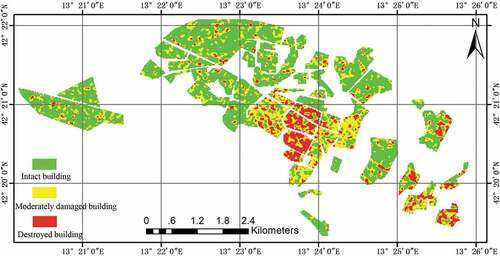
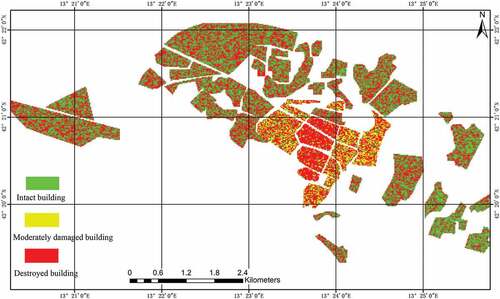
We selected an empirical threshold to segment the correlation coefficient and then merged the discrete pixels. illustrates the distribution map of damage caused by the earthquake.
Figure 9. Distribution map of earthquake damage using the PTFCCD method. The extraction results are masked by building area
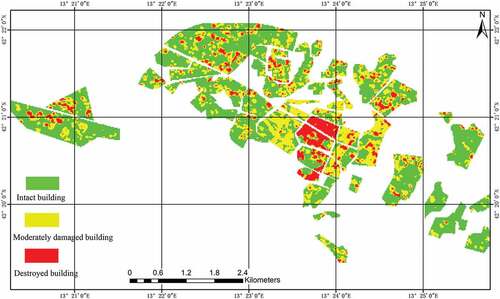
To compare the difference between multiple and single texture features, we selected the single texture feature of the HOM parameter as a representative. HOM is a measure of the local greyscale homogeneity of an image. The HOM feature was chosen as the variable for the correlation change detection (STFCCD) using the same window size and the distribution of the buildings was extracted. presents the distribution map of the earthquake damage results for L’Aquila earthquake.
Figure 10. Distribution map of earthquake damage using the STFCCD method. The discrete pixels in the result are processed by merging
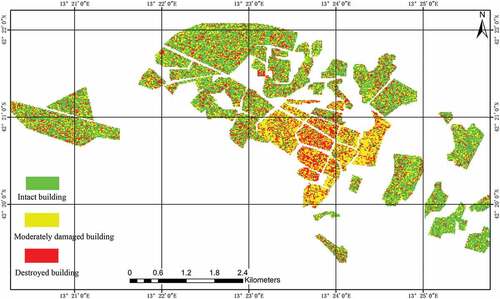
The intensity feature of SAR image is easily affected by speckle noise and the change of ground object, while the texture feature is more stable. To compare the characterisation ability of texture features, the intensity images were used directly for the correlation analysis (ICCD) to obtain the distribution of the buildings based on image pre-processing. presents the distribution map of the earthquake damage results.
Figure 11. Distribution map of earthquake damage using the ICCD method. The discrete pixels in the result are processed by merging
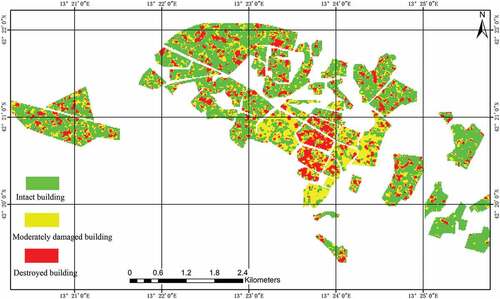
Subtraction change detection (SCD) results
We evaluated the effect on the classification performances using the traditional subtraction change detection based on intensity images (ISCD). The intensity images were used directly for the algorithmic operation to obtain the distribution of the buildings based on image pre-processing. presents the distribution map of the earthquake damage results.
Figure 12. Distribution map of earthquake damage using the ISCD method
To demonstrate the advantages of multi-texture features, we designed the subtraction change detection taking the single texture feature as the input (TFSCD). We performed this analysis with HOM, as an input to TFSCD. presents the distribution map of the earthquake damage results.
Figure 13. Distribution map of earthquake damage using the TFSCD method
Precision evaluation and comparison
Following the performance outlined in the previous sections, the performance of PTFCCD was compared with STFCCD and ICCD quantitatively using prepared interpretation images. In addition to visual inspection, four quantitative measures were used to assess the quality of the information detection. The quantitative measures include extraction accuracy (EA), missed rate (MR), false detection rate (FDR), and overall accuracy (OA), which are calculated as follows:
where is the extraction area,
is the false detection area,
is the missed area, and
is the true area (If the results of the field investigation exist, the results should be considered. If not, the visual interpretation results of the optical image will be referred).
shows that the EA of PTFCCD for the three categories of damaged buildings is about 85% and the FDR is about 10%. Image analysis showed that the section of detection error is mainly distributed along the roads. This is attributable to the correlation calculation window size, whereby road information is incorporated in the calculation causing partial false detection.
Table 2. Accuracy measures for the CCD methods. For details on the accuracy measures (EA, MR, FDR), see the main text
The OA of building extraction based on ICCD is 66.8%. The EA of moderately damaged building is 67.6% but the FDR is relatively high. The results of visual interpretation indicated that some moderately damaged building is misclassified as intact building, especially in built-up areas near road. Again, the false detection can be attributed to the influence of roads. The EA of damaged buildings by ICCD is about 61.9%. This is because some peripheral parts of destroyed building are missed or misclassified.
The OA based on STFCCD is 75.3%. The EA of intact building is high (close to 90%), whereas for destroyed building, it is about 65.7%, although the FDR is lower. Some intact buildings are classified as damaged buildings. Some moderately damaged buildings or destroyed buildings are classified as intact buildings. Compared with PTFCCD, the EA is lower. This is because the PTFCCD method combines the characteristics of multiple texture features that reflect damage information more accurately and it avoids false detection and misses. The results of the detection are more stable.
presents the performance of the SCD methods using the different input features. Firstly, it can be seen that the TFSCD method has higher OA. Moreover, its EAs of the three damage categories are better than the ISCD method (>70%). This means that the SCD method in textural features can achieve better performance than the intensity feature for detecting changes due to the building damage. Secondly, the MR and FDR of TFSCD are both lower than ISCD for moderately damaged building and destroyed building, demonstrating the textural features has a greater ability to detect slight change.
Table 3. Accuracy measures for the SCD methods. For details on the accuracy measures (EA, MR, FDR), see the main text
Results for CCD and SCD are summarised in and . When the extural feature was considered as input of the change detection algorithm, the PTFCCD method provided the best results. The method precision of STFCCD ranks behind it. This shows that texture features play an important role in the detection of earthquake damage buildings. It follows that the fusion of multiple texture features can also improve the accuracy of information detection. This proves the effectiveness of the proposed method.
As far as the sensitivity to the speckle noise is concerned, it is worth pointing out that our algorithm has a greater ability to depress the speckle noise (see ). In other word, a combination of PCA and texture features can provide the best detection results and the detection process is more stable.
When the intensity feature was considered as an input of the change detection algorithm, by looking at and , it can be noticed that ICCD method have a better result than ISCD method. This shows the correlation change detection based on texture features can improve the accuracy of information detection.
The extraction performances from satellite data at building group scale using our method were as follows: overall accuracy = 82.9%, Kappa coefficient = 72.7%, according to a paper published to which we refer for details (Dell’Acqua et al., Citation2011). Such a result suggests that the damage map obtained using satellite data can meet the needs of post-earthquake assessment and post-disaster emergency response when compared to the highly costly and time-consuming ground surveys.
Conclusions
In this paper, we have presented a CD method of mapping urban damage due to an earthquake at the scale of building group using a pair (pre- and post-event) of middle-resolution satellite SAR images. The case study considered in this research was the earthquake that hit L’Aquila historical town in 2009. The outcomes of detection of collapsed buildings were compared to the ground survey. Two novel methodological contributions distinguish this work from traditional SAR images change detection:(1) the PCA of multi-textural features is introduced into change detection for the first time and (2) the combination of PCs and CCD improved the detection accuracy of traditional change detection based on texture or intensity features significantly.
As far as image analysis techniques were concerned, among different features using the input of change detection method, the change of PCs of textural features were found as the most effective. The PTFCCD method had higher detection accuracy and more stable than STFCCD, ICCD, TFSCD and ISCD. In particular, STFCCD resulted in a fewer number of false detections. The overall detection performances where not bad (accuracy = 87.2%, Kappa coefficient = 72.7%). The element calculated by change detection is no longer an isolated pixel, but a region. Therefore, the interference factors in intensity images such as speckle noise, grey change of physical objects and seasonal variation were avoided. These made the information detection more targeted and more stable. Experimental results showed that the ME, VA, and HOM parameters could effectively characterise the different degree of earthquake-damaged buildings and the correlation analysis of PCs of the texture features can significantly improve the detection accuracy compared with traditional subtraction change detection using single texture and intensity feature.
Acknowledgments
The authors wish to thank the anonymous reviewers for their valuable comments. This work was supported by the National Natural Science Foundation of China (Grant No.41874059, No.41374050), the Special Item for Public Welfare of Scientific Research Project from Institute of Crustal Dynamics, China Earthquake Administration (Grant No.ZDJ-2018-14, ZDJ-2017-29, ZDJ-2017-16).
Disclosure statement
No potential conflict of interest was reported by the authors.
Additional information
Funding
References
- Abdi, H., & Williams, L.J. (2010). Principal component analysis. Wiley Interdisciplinary Reviews Computational Statistics, 2(4), 433–459. doi:10.1002/wics.101
- Aghababaee, H., Amini, J., & Tzeng, Y.C. (2013). Scientia Iranica. Improving Change Detection Methods of SAR Images Using Fractals, 20(1), 15–22. doi:10.1016/j.scient.2012.11.006
- Aoki, H., Matsuoka, M., & Yamazaki, F. (1998). Characteristics of satellite SAR images in the damaged areas due to the Hyogoken-Nanbu earthquake. Proc. 19th Asian Conference of Remote Sensing, C7, 1–6, Manila, Philippines.
- Baraldi, A., & Parmiggiani, F. (1995). An investigation of the textural characteristics associated with gray level co-occurrence matrix statistical parameters. IEEE Transactions onGeoscience and Remote Sensing, 33(2), 293–304. doi:10.1109/36.377929
- Beliakov, G., James, S., & Troiano, L. (2008). Texture recognition by using GLCM and various aggregation functions. In 2008 IEEE International Conference on Fuzzy Systems: proceedings FUZZ-IEEE 2008, Piscataway, N.J: IEEE, 1472–1476, DOI:10.1109/FUZZY.2008.4630566.
- Celik, T. (2010). Change detection in satellite images using a genetic algorithm approach. IEEE Geosciences Remote Sensor Letters, (7), 386–390. doi:10.1109/LGRS.2009.2037024
- Chen, F., Jiang, A., Tang, P., Yang, R., Zhou, W., Wang, H., et al. (2017). Multi-scale synthetic aperture radar remote sensing for archaeological prospection in han hangu pass, xin\”an China. Remote Sensing Letters, 8(1), 38–47. doi:10.1080/2150704X.2016.1235812
- Chen, Z.P., & Deng, P. (2002). Application of textural features to change detection in SAR Image. Remote Sensing Technology and Application, 17(3), 162–166.
- China Earthquake Administration (CEA). (2008). Chinese seismic intensity scale. GB/T 17742-2008. Beijing: Standards Press of China.
- Cihlar, J., Pultz, T.J., & Gray, A.L. (1992). Change detection with synthetic aperture radar. International Journal of Remote Sensing, 13(3), 401–414. doi:10.1080/01431169208904045
- Clausen, C., & Wechsler, H. (2000). Color image compression using pea and back propagation learning. Pattern Recognition, 33(9), 1555–1560. doi:10.2307/3172953
- Dell’Acqua, F., Bignami, C., Chini, M., Lisini, G., Polli, D., & Stramondo, S. (2011). Earthquake rapid mapping by satellite remote sensing data: L’aquila april 6th, 2009 event. IEEE Journal of Selected Topics in Applied Earth Observations & Remote Sensing, 4(4), 935–943. doi:10.1109/JSTARS.2011.2162721
- Gong, L.X., & Zhang, J.F. (2013). Seismic damage building extraction based on correlation change detection, Seismological Society Space on Earth Observation Specialized Committee 2013 Academic Seminar, China, 23.
- Gong, M.G., Yang, H.L., & Zhang, P.Z. (2017). Feature learning and change feature classification based on deep learning for ternary change detection in SAR images. Journal of Photogrammetry and Remote Sensing, 129, 212–225. doi:10.1016/j.isprsjprs.2017.05.001
- Haralick, R.M., Shanmugan, K., & Dinstein, I. (1973). Texture features for image classification. IEEE Transactions on System, Man and Cybernetics, 3, 610–621.
- He, D.C., Wang, L., & Guibert, J. (1987). Texture feature extraction. Pattern Recognition Letters, 6(4), 269–273. doi:10.1016/0167-8655(87)90087-0
- Hou, B., Wei, Q., Zheng, Y., & Wang, S. (2014). Unsupervised change detection in SAR image based on gauss-log ratio image fusion and compressed projection. IEEE Journal of Selected Topics in Applied Earth Observations & Remote Sensing, 7(8), 3297–3317. doi:10.1109/JSTARS.2014.2328344
- Hu, Z.L., Li, H.Q., & Du, P.J. (2009). Study on the extraction of texture features and its application in classifying SAR images. Journal of China University of Mining & Technology, 38(3), 422–427.
- Infoterra. (2008). Radiometric Calibration of TerraSAR-X Data: Beat Nought and Sigma Nought Coefficient Calculation. http://www.infoterra.de/fileadmin/Verzeichnisordner/Dokumente/3_TerraSAR-x/TSXX-ITD-TN-0049-radiometric_calculations_I1.00.pdf.2008
- Ito, Y., & Hosokawa, M. (2002). Damage estimation model using temporal coherence ratio. IEEE International Geoscience and Remote Sensing Symposium, (5), 2859–2861, Toronto, Ont., Canada. doi: 10.1109/IGARSS.2002.1026802.
- Ito, Y., Hosokawa, M., & Matsuoka, M. (2003). A degree estimation model of earthquake damage using temporal coherence ratio. IEEE International Geoscience and Remote Sensing Symposium, (5), 2410–2412, DOI: 10.1109/IGARSS.2002.1026802.
- Jiang, Y., Wang, C., & Zhao, X. (2010). Damage assessment of tunnels caused by the 2004 Mid Niigata prefecture earthquake using Hayashi’s quantification theory type II. Natural Hazards, 53(3), 425–441. doi:10.1007/s11069-009-9441-9
- Jolliffe, I.T. (1986). Principal component analysis. Springer, 87(100), 41–64.
- Karimzadeh, S., & Matsuoka, M. (2018). Building damage characterization for the 2016 AMATRICE earthquake using ascending-descending Cosmo-SkyMed data and topographic position index. IEEE Journal of Selected Topics in Applied Earth Observations & Remote Sensing, 99, 1–15. doi:10.1109/JSTARS.2018.2825399
- Kekre, H.B., Thepade, S.D., & Sarode, T.K. (2010). Image retrieval using texture features extracted from GLCM, LBG and KPE. International Journal of Computer and Engineering, 5(2), 1793–8201. doi:10.7763/IJCTE.2010.V2.227
- Khurana, M., & Saxena, V. (2017). Exploring the effectiveness of various texture features for change detection in remote sensing images. International Conference on Computer, Communications and Electronics. IEEE. Jaipur, India, (1), DOI: 10.1109/COMPTELIX.2017.8003945.
- Li, Q., Huang, X., Wen, D., & Liu, H. (2017). Integrating multiple textural features for remote sensing image change detection. Photogrammetric Engineering & Remote Sensing, 83(2), 109–121. doi:10.14358/PERS.83.2.109
- Lu, D., Mausel, P., Brondízio, E., & Moran, E. (2004). Change detection techniques. International Journal of Remote Sensing, 25(12), 2365–2401. doi:10.1080/0143116031000139863
- Martis, R.J., Chakraborty, C., & Ray, A.K. (2009). An integrated ecg feature extraction scheme using pea and wavelet transform. India Conference (INDICON) Annual IEEE, 1–4, DOI: 10.1109/INDCON.2009.5409439.
- Matsuoka, M., Koshimura, S., & Nojima, N. (2010b). Estimation of building damage ratio due to earthquakes and tsunamis using satellite SAR imagery. IEEE International Geoscience and Remote Sensing Symposium, 3347–3349, DOI: 10.1109/IGARSS.2010.5650550.
- Matsuoka, M., & Nojima, N. (2010a). Building damage estimation by integration of seismic intensity information and satellite L-band SAR imagery. Remote Sensing, 2(9), 2111–2126. doi:10.3390/rs2092111
- Matsuoka, M., & Yamazaki, F. (2000). Use of interferometric satellite SAR for earthquake damage detection. Proc. of 6th International Conference on Seismic Zonation, EERI, Palm Springs, California.
- Matsuoka, M., & Yamazaki, F. (2004a). Use of satellite SAR intensity imagery for detecting building areas damaged due to earthquakes. Earthquake Spectra, 20, 975–994. doi:10.1193/1.1774182
- Matsuoka, M., & Yamazaki, F. (2004b). Building damage detection using satellite SAR intensity images for the 2003 Algeria and Iran earthquakes. IEEE International Geoscience and Remote Sensing Symposium, (2), 1099–1102, DOI: 10.1109/IGARSS.2004.1368604.
- Matsuoka, M., & Yamazaki, F. (2005). Building damage mapping of the 2003 Bam, Iran, earthquake using Envisat/ASAR intensity imagery. Earthquake Spectra, 21(S1), 285–294. doi:10.1193/1.2101027
- Matsuoka, M., Yamazaki, F., & Ohkura, H. (2007). Damage mapping for the 2004 Niigata-ken Chuetsu earthquake using Radarsat images. Urban Remote Sensing Joint Event, 1–5. doi:10.1109/URS.2007.371868
- Moya, L., Mas, E., Adriano, B., Koshimura, S., & Yamazaki, F. (2017). Building damage mapping using change detection of Alos-2 Palsar-2 SAR images and strong motion data. International Symposium on Remote Sensing. Nagoya, Japan.
- Pesaresi, M., & Benediktsson, J.A. (2001). A new approach for the morphological segmentation of high-resolution satellite imagery. IEEE Transactions on Geoscience and Remote Sensing, 39(2), 309–320. doi:10.1109/36.905239
- Rignot, E.J., & van Zyl, J.J. (1993). Change detection techniques for ERS-1 SAR data. IEEE Transactions on Geoscience and Remote Sensing, (31), 896–906. doi:10.1109/36.239913
- Sharma, L.N., Dandapat, S., & Mahanta, A. (2012). Multichannel ecg data compression based on multi-scale principal component analysis. Information Technology in Biomedicine, 16(4), 730–736. doi:10.1109/TITB.2012.2195322
- Sharma, R., Tateishi, R., Hara, K., Nguyen, H., Gharechelou, S., & Nguyen, L. (2017). Earthquake Damage Visualization (EDV) technique for the rapid detection of earthquake-induced damages using SAR data. Sensors, 17, 235. doi:10.3390/s17020235
- Shi, Z., Li, P., Jin, H., Tian, Y., & Chen, Y. (2017). Improving super-resolution mapping by combining multiple realizations obtained using the indicator-geostatistics based method. Remote Sensing. 9(8), 773. doi: 10.3390/rs9080773.
- Sofina, N., & Ehlers, M. (2017). Building change detection using high resolution remotely sensed data and GIS. IEEE Journal of Selected Topics in Applied Earth Observations & Remote Sensing, 9(8), 3430–3438. doi:10.1109/JSTARS.2016.2542074
- Suyash, P. (2006). Unsupervised texture segmentation with nonparametric neighbourhood statistics. ECCV, (2), 494–507. doi:10.1007/11744047_38
- Wang, J., & Ogawa, S. (2017). Analysis of dynamic changes in land use based on landscape metrics in Nagasaki, Japan. Journal of Applied Remote Sensing, 11(1), 016022. doi:10.1117/1.jrs.11.016022
- Wu, F., Gong, L., Wang, C., Zhang, H., Zhang, B., & Xie, L. (2016). Signature analysis of building damage with TerraSAR-X new staring spotlight mode data. IEEE Geoscience and Remote Sensing Letters, 13(11), 1696–1700. doi:10.1109/lgrs.2016.2604841
- Wu, F., Gong, L., Wang, C., Zhang, H., Zhang, B., & Xie, L. (2017). Signature analysis of building damage with TerraSAR-X new staring spotlight mode data. IEEE Geoscience and Remote Sensing Letters, 13(11), 1696–1700. doi:10.1109/LGRS.2016.2604841
- Yonezawa, C., & Takeuchi, S. (1999). Detection of urban damage using interferometric SAR decorrelation. IEEE International Geoscience and Remote Sensing Symposium, (2), 925–927, DOI: 10.1109/IGARSS.1999.774487.
- Yonezawa, C., & Takeuchi, S. (2001). Decorrelation of SAR data by urban damages caused by the 1995 Hyogoken-nanbu earthquake. International Journal of Remote Sensing, 22(8), 1585–1600. doi:10.1080/01431160118187
- Zhuang, H.F., Deng, K., & Fan, H. (2016). SAR images unsupervised change detection based on combination of texture feature vector with maximum entropy principle. Acta Geodaetica Et Cartographica Sinica, 45(3), 339–346. doi:10.11947/j.AGCS.2016.20150022