
 ?Mathematical formulae have been encoded as MathML and are displayed in this HTML version using MathJax in order to improve their display. Uncheck the box to turn MathJax off. This feature requires Javascript. Click on a formula to zoom.
ABSTRACT
The Synthetic Aperture Radar (SAR) has many attractive and desired features to cope with uncertain weather conditions and also provides superlative resolution in images. In this paper, a unique multiscale approach of change detection (CD) that integrates the preprocessing and CD technique of SAR imagery is discussed. Condensed anisotropic diffusion method is employed as a preprocessing tool for despeckling, and the resultant image is processed by multiscale approach in the Laplacian pyramid (LP) domain. In each layer of LP, the difference between the pyramid coefficient of two images of the same area obtained at different periods is estimated through log ratio operation. Each layer of pyramid coefficient has explicit features at particular scale. Fine scale related to a band pass layer localizes edges of the change area and the coarse scale related to a low pass layer preserves more detail information of the change region. Reconstruction of LP provides exact difference image with perfect boundary. Otsu's algorithm is used to generate binary change map to distinguish changed and unchanged pixels. The efficiency of the proposed method is tested by using simulated and real SAR image datasets. The confusion matrix parameters are used to prove competence of the proposed CD method.
Introduction
In remote sensing, satellite images are acquired by both active and passive sensors. Synthetic Aperture Radar (SAR) comes under active microwave sensors which uses a broad range of radiometric spectrum. It can work in all weather conditions, even at day and night, which enables the SAR to extract correct information about the targets. Since the microwave sensors are self-reliant to atmosphere and a cloud cover condition, it encourages the researcher to use SAR images in various fields. The remote sensing satellites such as ENVI-ASAR, TerraSAR-X, ALOS and Radarsat-2 effectively replicate the active changes about spatial and temporal information of earth’s surface. Especially ENVI-ASAR provides constant data sets for geological monitoring (soil-moisture, agriculture, coastal (Ghosh, Kumar, & Roy, Citation2015), forest (John & Woodcock, Citation1996; Kennedy, Cohen, & Schroeder, Citation2007) and ship tracking) and mapping applications (topographic (Shalaby & Tateishi, Citation2007), ice and snow applications). The above ENVI-ASAR has broad angle coverage with excellent resolutions during every 35-days revisit cycle using ScanSAR technique. The ASAR high-resolution images have 30 m of precision and works from 15° to 45° of incident angle. The ASAR wave mode creates 5 km x 5 km sketch spaced with 100 km of azimuth resolution (VV-polarization), whereas the ASAR swath mode provides 400 km of swath coverage with 150 m resolution. The Radarsat satellite is most leading surveillance system developed by Canada centre for mapping, and earth observation is used to track atmospheric changes of flood (Hazarika, Apurba, & Borah, Citation2015), oil spill, earthquake, land use (Hadjimitsis et al., Citation2010) and change map (Ban & Yousif, Citation2012) applications. The Radarsat also provides high-quality multitemporal images with a steerable beam and single frequency to offer fine image scale and resolution. This satellite operates at 5.3 GHz/C-band, 5.6 cm wavelength with HH-polarization. The Radarsat image mode has a swath width of 100 km, incident angle span of 20– 49° with 30 m resolution.
Radar sensors play essential role in SAR imagery, particularly the realization of change map applications. Change detection (CD) is the measure of identifying the differences of same geological area observed at different times (Radke, Andra, Al-kofahi, & Roysam, Citation2005; Singh, Citation1989; Baselice et al., Citation2014). Generally, CD methods are categorized into two: unsupervised and supervised. Unsupervised method is an analysis of change and no-change classes without prior knowledge about the target image, whereas supervised method required former information. CD process consists of three stages (Dogan & Perissin, Citation2014; Mura, Benediktsson, Bovolo, & Bruzzone, Citation2008): (1) preprocessing of multitemporal SAR images; (2) image comparison to identify the changes; (3) analysis of CD by appropriate thresholding or clustering methods (Celik, T. Citation2009b).
In preprocessing stage, SAR images undergo speckle reduction, geometric correction, digital elevation model correction, co-registration, etc., and these operations are preferred according to the application area. Out of all the preprocessing steps, the speckle reduction is essential for CD application. SAR images are very sensitive to the coherent nature of multiplicative noise called speckle (Gong, Cao & Wu Citation2012). Speckle noise is a granular noise which degrades the quality of SAR image consequently. Various adaptive filtering methods are available to reduce speckle noise like Lee (Lee, Citation1980), Frost (Frost, Stiles, Shanmugan, & Holtzman, Citation1982) and Kuan (Kuan et al., Citation1985, Kuan, Sawchuk, Strand, & Chavel, Citation1987) methods; they do speckle reduction by simply converting the multiplicative noise model into additive model using a logarithmic operator. In addition, the sensitivity of the filter window size causes smear edges and blur spatial information of an image. Recently, diffusion method shows improved merit compared with adaptive filtering techniques. Diffusion filter removes speckle from an image by modifying the image by means of a partial differential equation (PDE) (you & Kaveh, Citation2000; Feddern et al., Citation2006; Krissian et al., Citation2007). Condensed Anisotropic Diffusion (CAD) (Kalaivani et al., 2012) method is used, which incorporates energy condenser into nonlinear coherent diffusion. It can reduce the speckle content with preservation of edges and fine spatial details (Masoomi, Hamzehyan, & Shirazi, Citation2012).
Then, speckle-free multitemporal SAR images are to be interpreted to identify the difference image (DI) (Bruzzone & Prieto, Citation2000) in the subsequence stage. The DI is achieved by comparing two co-registered images by various mathematical functions. In the literature, many comparison methods (Dekker, Citation1998; Lu, Mausel, Brondizio, & Moran, Citation2004; Singh, Citation1989; yousif & Ban, Citation2014) are available to find the DI such as algebra-based approach (Masroor, Dongmei, Angela, Hui, & David, Citation2013), transformation-based approach (Li & Yeh, Citation1998), classification-based approach (Jesus, Arie, & Joost, Citation2012) and similarity measures (Chesnokova & Erten, Citation2013). Out of these methods, algebra-based approach is a simple method to find DI which utilizes image differencing (Ma et al., Citation2012), image rationing, image regression, image correlation and change vector analysis (Sartajvir & Rajneesh, Citation2014). Existing methods are based on the analogy of the local neighborhood window to estimate the changes. Generally irrelevant window size would cause wrong and unwanted detection. In case of using small window size for correlation analysis, no detection will be carried on the homogeneous regions; on the other hand, larger window size will detect changes only in larger area or high-intensity regions, such cases produce a coarse resolution DI (Inglada & Mercier, Citation2007). The image differencing method and image ratio methods augment the foreground pixels by confining the background pixel information (Gong, Zhou & Jingjing Citation2012). The ratio operations have the following limitations: the mean ratio operator may fail to detect changes because the DI is emerged from the conversion of the local mean value of the input images. Image ratio operator and its distribution depend on relative change of average intensity between a pair of multitemporal SAR images. The logarithmic characteristic of log ratio (LR) method strengthens the low-intensity pixels, while deteriorating the pixels in the area of high intensity. Hence, it may not give the real changed trends to its maximum level. To overcome the above issues, multiscale approach is introduced in the CD analysis.
In image processing, the multiscale approach is a significant concept for retaining spatial information. Multiscale images are computed by orthogonal and non-orthogonal basis. Laplacian Pyramid (LP) is well-known non-orthogonal method. The representation of multiscale image is in decreased order of the image resolution and the sample density, obtained through regular steps. The Gaussian pyramid (GP) consists of a low pass version of the image. On the wavelet pyramid, decomposition is based on the outcome of the orthogonal method. Also, wavelet pyramid transforms are more computationally complex, and the decomposition is to be done recursively on the low pass band to obtain other levels.
Techniques in the literature,Bovolo and Bruzzone (Citation2005) developed CD technique by LR operation and multiresolution analysis done by stationary wavelet transform (SWT) to decompose multiple resolutions of the difference coefficient. Adaptive scale-driven approach is used to fuse the final change map. This algorithm provides considerable CD result with accuracy, but the decision threshold was elected based on manual selection of trial and error procedure. Celik (Citation2009a) proposed undecimated discrete wavelet transform to decompose the DI. Each pixel of feature vector is sampled with multiscale difference data. The binary change map is derived by k-means clustering algorithm. Though variety of sensor images acquired in multiple geometric conditions, guaranteed results are not obtained for multiple selection of sensor data. Celik (Citation2010b) adapted unsupervised CD by Bayesian interference with expected maximization algorithm. Also, dual tree-complex wavelet transform exploits multiscale approach for DI. However, this multiscale approach has not provided efficient number of scales to prefer, and also speckle filter failed to preserve the boundaries of the changed region exactly. Wang et al. (Citation2013) used multiclass segmentation method by triplet markov field model. This method obtained a better solution for CD with low miss rate and high precision at the cost of long computational time. yousif and Ban (Citation2013) developed non-local means (NLM (Coupe et al., Citation2009)) algorithm for speckle noise reduction. Principal component analysis (PCA) is used to reduce the neighborhood dimensionality of the feature vector. This NLM-PCA model takes high computational complexity. Hu and Ban (Citation2014) proposed that the satellite images are compared by ratio method and then classified by thresholding algorithm. If the DI is bimodal histogram, the Kittler Illingworth algorithm is used to classify the change map. Otherwise, multiscale region selection is executed for unimodal pixel classification. But this method has not provided the dependency information associated with parallel neighborhood pixels to increase the accuracy of change map. Ajadi et al. (Citation2016) carried CD in satellite images by multiscale-driven approach. Fast non-local filter is applied for speckle noise reduction, and SWT is employed to decompose the DI. Bayesian threshold is estimated in each decomposition layer. The localized features are fused by measurement-level fusion to obtain the change map, though this algorithm shows blur change result with false detection.
In order to improve upon previous work, pyramid-based multiscale approach is proposed. The pyramid-based multiscale approach has a great deal of significance in the representation that contains spatial localization in the spatial-frequency domain. The pyramid transformation may separate critical modules of the image pattern, hence they are more feasible to access and also more compact for data storage and transfer. Image pyramid is a data architecture designed to aid dynamic scaled convolution over the reduced sequence of the original image. It consists of recursive copies of the original image which have self-similarity form decreased in both sample density and resolution. In GP, the original image is convoluted with low pass filter ensueing with sub sample by a factor of two to earn the later pyramid levels. Most of the image processing applications require medium band resolution (band pass and low pass images), which demands LP (Adelson, Anderson, Bergen, Burt, & Ogden, Citation1984) structure. This may be achieved by differencing each GP level from immediate downstream level. Due to this, interpolation has to take place before balancing the sample density. Band pass copies of the pyramid layers provide valid details and related components residing in each decomposing level. LP have been used to analyze images at various image processing applications such as image compression (Adelson et al., Citation1984; Perry, Citation1997), texture analysis and synthesis, image mosaics and image filtering techniques. In image compression technique by LP, less significance of compression ratio with loss of information is provided (Michael, Citation1992). In texture analysis technique, the pyramid structure could not recognize complete perceptual information of natural textures (Heeger & Bergen, Citation1995). Pyramid domain on image mosaics has not supported an image with movable object and different exposures (Burt & Adelson, Citation1983a). LP-based noise filtering technique enables only with fine scale layers and does not comfort to use with course scale (Zhang, Yoo, Koh, & Kim, Citation2007). However, pyramid structure regards poor choice of selection of above-existing applications. In our paper, we exploit the strength of the LP domain for CD application to overcome the existing limitation of LR operation. Moreover, the band pass copies obtained in LP enhance the image structures, linear features and edges which are essential for image interpretation. The essential property of LP is that it gives an entire image portrayal: the degenerative stage recoups the original image absolutely, without any lose of information.
Finally, the decision theory is utilized to make perfect automatic classification of the DI. The realistic CD approach is enhanced by thresholding algorithm to provide an automatic binary change map. Threshold is a simple and effectual technique to segregate objects (changed) and the background (unchanged) pixels (Moser & Serpico, Citation2006; Rosin & Ioannidis, Citation2003; Gong et al., Citation2014) of an image. Most of the thresholding algorithms are categorized according to changed and unchanged classes in the assumptions of the specific mode (unimodal or bimodal) of the histogram of an image. In change map application, unidentified tiny portion may lead to enormous detriment of environment changes, particularly in terrain control changes such as land use, land cover, agricultural monitoring, crop area observation, deforestation, urban expansion in the agricultural area and flood risk assessment. On the above consideration, several threshold algorithms are referred to classify the DI using Kittler-Illingworth (KI) algorithm (Kittler & Illingworth, Citation1986), Otsu algorithm (Otsu, Citation1979; Yang, Shen, Long, & Chen, Citation2012), Kapur algorithm (Kapur, Sahoo, & Wong, Citation1985), Bayesian thresholding (Bovolo, Camps-Valls, & Bruzzone, Citation2010), Tsai method (Tsai, Citation1995), Rosin algorithm (Rosin, Citation2001) and Expectation-Maximization algorithm (Hao, Shi, Zhang, & Li., Citation2014). In this paper, Otsu’s thresholding algorithm is utilized for classification. The optimal threshold is chosen by either minimum value of within-class variance or maximum value of between-class variance of the histogram of an image. Otsu algorithm is preferred for the following merits. It has an unsupervised quality of threshold selection, quite simple and applies zeroth- and first-order cumulative distribution to elect gray-level thresholding. An optimal threshold is analyzed through the probability of class mean levels, which will offer automatic and constant threshold.
In order to consider the above standard processing stages, we proposed speckle-free, unsupervised CD for SAR images by following aspects: (1) preprocessing by CAD; (2) Image difference by LP-based CD; (3) Otsu thresholding algorithm for effective classification of change map. The rest of the paper is structured as follows. The Background section presents basics of the preprocessing technique. Methodology section elaborates the details of the proposed method. Result and discussion section describes experimental significance and related discussion of the proposed technique. Outcome of proposed method with future work is given in the conclusion part.
Background
Diffusion in speckle reduction
The fundamental speckle reduction technique is developed from diffusion process. Diffusion is termed as a physical process (Rajan & Kaimal, Citation2006) that equilibrates two unequal concentrations without creating or destroying mass. The physical process of diffusion is expressed by Flick’s law as,
The homogeneity between the flux and gradient
is represented by the diffusion tensor
, which is a positive scalar symmetric matrix. Diffusion related to the image processing is the concentration of gray-level value in a particular location. Perona & Malik (Citation1990) proposed anisotropic diffusion using nonlinear PDE. Nonlinear diffusion uses scalar valued diffusivity instead of the diffusion tensor.
where is the divergence operator,
is the gradient,
is diffusion function,
is scalar function and
is the initial image. This diffusivity provides maximum likelihood value. Generally, the second-order PDE-based approach is subjected to feature blocky effects (Kalaivani et al., Citation2012b). To overcome the above issue, fourth-order PDE-based speckle reduction method (you & Kaveh, Citation2000), which gives improved result for speckle noise removal and reduces edge sensitivity formation, is used. However, fourth-order PDE method takes higher number of iterations to converge.
Methodology
This paper aims a unique multiscale approach for SAR imagery in an unsupervised CD strategy, which integrates the preprocessing and CD. The proposed method is demonstrated in sections below.
Preprocessing
A CAD method is suggested as a preprocessing tool to eliminate speckle noise in SAR images. CAD method (Kalaivani et al., Citation2012a) consists of two terms: a diffusion term and a condenser. The term of diffusion coefficient is weakening the speckle by diffusion tensor. The second term of energy condenser enhances the performance of diffusion tensor and enables to correct the feature broadening effect. Blending energy condenser into diffusion tensor leads to preserve the edges of change area, enhance the local details of lines and bar features, and also rectifies the feature broadening defect. In this method, the scalar function acts as a tensor and controls diffusion process in both gradient and contour direction. The CAD is stated by,
The anisotropic diffusion term is expressed in discrete form as,
With reference to semi-explicit form,
where and
are diffusion coefficients summarized as given,
where is a value of
pixel at time “
” and
is pixel value at time
is an average of
The
is the time interval between two consecutive iterations. The time interval is set at 0.25 to maintain
and these values are chosen by
and neighborhood pixel distance is
for the image. In case of weight factor
the image region is subjected to nonlinear coherent diffusion. When the value
, it prevents the coarsening of high-frequency structure in predominant image regions.
The diffusion is an iterative process. The stopping criterion is decided by mean absolute error (MAE) between two successive steps (Yu & Acton, Citation2002).
where are filtered images at times
and
and
are columns and rows of the image, respectively. MAE value decides finest diffusion process to earn desirable despeckling. For the implementation of CAD as a preprocessing tool, the parameters are chosen as
and
. In each iteration, the energy of
is updated by a factor of
, where
is the mean value. Hence, the proposed image has similar energy like input
. This method provides impressive speckle noise removal with condensed feature broadening effect.
Laplacian pyramid
A basic structure of image pyramid is a hierarchical representation of multiscale images. The pyramid structure consists of decomposition and a reconstruction stage, which are designed by approximation and interpolation filter (Burt & Adelson, Citation1983b; Yu, Citation2009). In the decomposition stage, the signal of the input image is consecutively decomposed into reduced copies of approximation and residual signal information. The residual signal information is estimated by the difference between the signal on the fine scale and the interpolated signal from the coarser scale. A fine scale with respect to lower pyramid layer has its size equal to the input image. Pyramidal structure is designed by its specific decimation factor, approximation and interpolation filter. The pyramid structure decomposition is done by two techniques: GP and LP. In GP, the input image is continually filtered and sub-sampled to achieve the sequence of low-resolution images
where
is number of decomposition layers. This consists of a set of low pass filter layers of the input image whose bandwidth reduces by one octave steps.
LP constructed by two standard operators: Reduce and Expand The Reduce operator in LP (Michael, Citation1992) is realised by 2D low pass filter followed by sub sampling by a factor of 2 in both directions. The Expand operator is performed by upsample with low pass filter followed by a factor of 4; the multiplication factor is essential to retain the average intensity being decreased by the insertion of zeros. This operator increases the image to double in size on both directions. For an original image I, LP at layer l is , where
and
is number of decomposition layers. The decomposition of GP and LP structures are shown in . The GP consists of different size of low pass layers of the original image and the LP decomposes the original image into the layers of band pass images and a unique low pass image. Reconstruction stage is done by simply regenerating the image from LP; it can be realized by reversing the decomposition steps.
Figure 1. Flowchart of Gaussian (Gl) and Laplacian pyramid (Ll)
Log ratio (LR) operation
Consider two despeckled SAR images acquired in the same geographical area at different time sequences, , respectively. These input images are decomposed by LP transform and are represented as
and
, respectively.
where represents the size of the each decomposition layer. Ratio operators are available to predict the differences between two images (Ashok, Varshney, & Arora, Citation2007). In that, most frequently used method is a logarithmic ratio method (Bazi, Bruzzone, & Melgani, Citation2005). Change differences can be identified by pixelwise comparison of ratio operator. Log operator is used to constrict the range of differences of the ratio image and to stabilize the values of the pixel either lesser or greater than 1. The LR operator is defined below and is expressed in a natural-logarithmic scale.
Significance of the proposed method
The aim of the LP is to decompose the multitemporal SAR images into different resolution layers in order to improve essential signal components like edges, homogeneous region and geometrical detail information of the change map image. LP decomposition of SAR images is embed with LR operator and its reconstructed image is the DI. The flow graph of the Laplacian Pyramid based change detection (LPCD) process is depicted in . The is LP decomposion of the DIs that is expressed below,
Figure 2. Block diagram of LP-based change detection
The prime objective (i.e. CD in this study) and the essential signal components (i.e. edges and change pixel information) of the DI are typically lying in different band layers as a result of different spatial components. Mainly, spatial resolution of the DI provides change information from coarse to fine scale. Coarse to fine search is a process of consecutively applying Reduce and Expand operators to the given image. They repetitively zoom in on the accurate position of an area depicted at the finest scale. The edges of the objects are enhanced by fine scale layer and detailed information is predicted in coarse scale layer. Thus, the estimation of spatial difference in medium band resolution (band pass and low pass) can efficiently detect changes without losing primary information. We have preferred four decomposition layers of the pyramid structure, each make explicit features at specific scale. The significance of different layers is given below;
First layer : This is fine scale related to a low pyramid layer and has a size equal to the input image. The Reduce and Expand operators are used in original image to obtain band pass layer of the image. LR operator is utilized in high-frequency component layer to yield exact edges, lines and bar features of the image.
Second layer : This is second band pass layer of the DI. The operators are applied in
layer and transition takes place from finest scale to next layer. Generating DI in this medium band resolution restrains unchanged pixels and enhances changed pixels exactly.
Third layer : This is third band pass layer of the DI. The Reduce and Expand operators are applied in
layer to maintain symmetry among the distribution of two (changed and unchanged) classes of the DI.
Fourth layer : This is coarse scale related to a high pyramid layer. Only Reduce operator is used in
layer to get low pass image. It can verify the hypothesized features tentatively identified at coarse scale. More detail information presents in this layer, they computationally efficient by means for applying valuable matching operator only in area of interest. .
Hence, only four layers of pyramidal structures are considered in the proposed method. The amount of information obtained from the individual layers is significantly increased when LR operator is combined with each layer of pyramid decomposition. Finally, the DI is generated by reconstructing the LP through degeneration steps. The flattening of background information is a common problem in LR method, which is significantly reduced by combining with LP.
The proposed LP-based DI is , which is expressed below,
Optimal thresholding algorithm
The CD is to detect the meaningful changes, thereby increasing the CD accuracy and reducing error rate (ER). Thresholding is one among the finest ways to deal with. This threshold algorithm is proposed by Otsu (Deng-Yuan, Ta-Wei, & Wu-Chih, Citation2011; Otsu, Citation1979) and is a proven method for selecting threshold for gray-level distribution of the image. The normalized gray-level histogram of the DI from (
is gray levels,
is number of pixels at level
and total number of pixels
) in the form of probability distribution is given by,
The total class mean of a gray-level image is,
The effectiveness of optimal threshold is followed by discriminant criterion measures either from the minimum value of the weighted within-class variance or maximum value of the between-class variance of the image. The optimized threshold by maximum between-class variance can be represented as,
is zeroth-order cumulative distribution of the gray-level histogram assigned to object (background),
is first-order cumulative distribution of the gray-level histogram up to level
.
Table
Data set
In this work, simulated images and three real SAR datasets are utilized for experiments;
Simulated Images: This is a Bolivia deforestation image, monitored by the Sentinal-1B spacecraft system under the operation of ESA during 2016. This observation has considered for large-scale deforestation for sugarcane cultivation. The simulated image is generated with consideration of agricultural field area patches placed to observe changes.
Athabasca Dataset: The Athabasca is the largest oil sand valley that contains the severe crude oil deposition in a mixed form. This is the largest basin of tar sand in the world and also applicable to large-scale open mining. These images are acquired by ENVI-ASAR satellite during 2000 and 2005 surveillance.
Alberta Dataset: This is High-river region of Alberta caused by flood in June 2013. This dataset has been tracked by RADARSAT-2 satellite in space and is major disaster to analyze the extent level of the flood.
Aare River Dataset: The Aare River flooded utterly and entered into the parts of cities and airports. This dataset was captured by ERS-2 satellite before and after flood in April and May 1999.
Quality measures
This section evaluates the performance metrics in various stages. In the first stage, the efficiency of the preprocessing method is evaluated through the typical measures like Structural Similarity Index Measure (SSIM) (Pratt, Citation1978; Michailovich & Tannenbaum, Citation2006; kalaivani et al., Citation2012b), Equivalent Number of Looks (ENL) (Patel, Easley, Chellappa, & Nasrabadi, Citation2014) and Speckle Suppression Index (SSI) (Sheng & Xia, Citation1996) that are used to examine the effectiveness of speckle and are tabulated in .
Table 1. Quality measures for speckle reduction assessment
In the second stage, the performance of CD method is qualified by various quality measures (Lal & Margret Anouncia, Citation2015; Shang, Qi., Jiao, Stolkin, & Li, Citation2014) to assess the CD image with respect to ground truth image. False positive (FP) defines the number of unchanged pixels that are wrongly classified as changed pixels. False negative (FN) defines the number of changed pixels that are wrongly classified as unchanged pixels. True negative (TN) is the number of pixels that are correctly classified as unchanged pixels. True positive (TP) is the number of pixels that are correctly classified as changed pixels. False alarm rate (FAR) is the probability of unchanged pixels that are wrongly classified as changed pixels and it is also termed as FP rate, which is close to a minimal value for ideal case. score measures the harmonic mean of detection rate and precision.
closer to one shows better score. The overall error (OE) is the sum of FP and FN pixels, and less number of OE represents better result. The ER measures the ratio between OE and total number of pixels
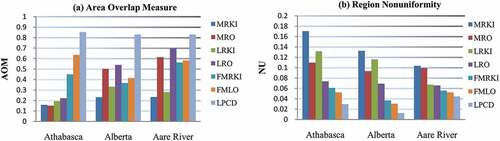
. It provides best result for minimum rate. Kappa coefficient (KC) measures the effectiveness of classification and is to be closed to 1 for ideal case. Percentage correct classification (PCC) measures accuracy of prediction. On the third stage, the critical analysis is carried on a threshold algorithm using the Region nonuniformity (NU) measure (Mehmet & Sankur, Citation2004) and Area overlap measure (AOM) (Rosenfield et al., Citation1986; Xu, Xu, Jin, & Song, Citation2011) to justify the meaningful change map.
Results and discussion
We have tested the proposed algorithm with one set of simulated image and three sets of the real SAR dataset images. The experimental results and its discussions are given below,
Preprocessing by CAD algorithm
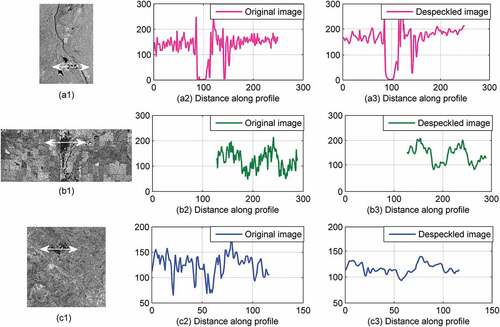
In preprocessing stage, CAD algorithm is used as a despeckling tool to perform speckle noise reduction in SAR images. Speckle-free images can able to give improved response in post-processing stages. The CAD provides excellent tool for speckle noise reduction, edge preservation and feature enhancement without broadening effect. The quality of the filtering technique is verified by effective performance metrics such as SSIM, ENL and SSI. These metric values are evaluated and tabulated in and it shows precise values for all three real SAR datasets. An additional, image profile is used to give pictorial representation to validate the intensity profile of an image, which gives visual performance to compare the original speckle image and the filtered image. In , the performance of image profile is depicted in distance along profile with respect to intensity on 330th row of Athabasca dataset, 33rd row of Alberta dataset and 67th row of the Aare river dataset. Thus, validation by above representations’ CAD algorithm exhibits excellent speckle noise reduction without disturbing structural originality of the given image. Importantly, CAD is applied as a preprocessing tool for all dataset images to maintain uniformity among the various comparison techniques and proposed method to define exact change map analysis.
Table 2. Performance of various datasets using SSIM, ENL and SSI
Figure 3. Experimental results of various dataset (a1) Athabasca image with marginal on 330th row, (a2) Image profile beside on 330th row of original image, (a3) Image profile beside on 330th row of despeckled image, (b1) Alberta image with marginal on 33rd row, (b2) Image profile beside on 33rd row of original image, (b3) Image profile beside on 33rd row of despeckled image, (c1) Aare image with marginal on 67th row, (c2) Image profile beside on 67th row of original image, (c3) Image profile beside on 67th row of despeckled image
The performance of proposed LPCD method
Flattening effect is a common problem of LR operation, which is characterized as strengthening the low-intensity pixels at the same time as reducing the strength of pixels in the area of high intensity. In order to prevent this flattening effect of high-intensity pixels and to improve the linear features and edges, LP-based CD is introduced. The proposed LP-based DI gives excellent pixel distribution between changed and unchanged classes. The LP is decomposed into layers and each decomposition layer is compared by LR operation to work under medium band resolution. The LP-based multiscale decomposition is constructed and verified by LR operation, and the performance of band pass and low pass difference coefficients is depicted in along with reconstructed image of LP. Reconstruction of LP is the DI. This multiple scale analysis enhances boundaries, lines and bars features in the first three band pass layers and verified hypothesized feature tentatively identified by a low pass layer. The proposed LP-based DI is a gray-level image and it is converted into binary change map by optimized Otsu thresholding algorithm.
Figure 4. Experimental results on LP-based multiscale decomposition combined with LR operator. Athabasca dataset (a1) L10−L20, (a2) L11−L21, (a3) L12−L22, (a4) L13−L23 and (a5) Reconstructed image; Aare River dataset (b1) L10−L20, (b2) L11−L21, (b3) L12−L22, (b4) L13−L23 and (b5) Reconstructed image; Alberta dataset (c1) L10−L20, (c2)) L11−L21, (c3) L12−L22, (c4) L13−L23 and (c5) Reconstructed image
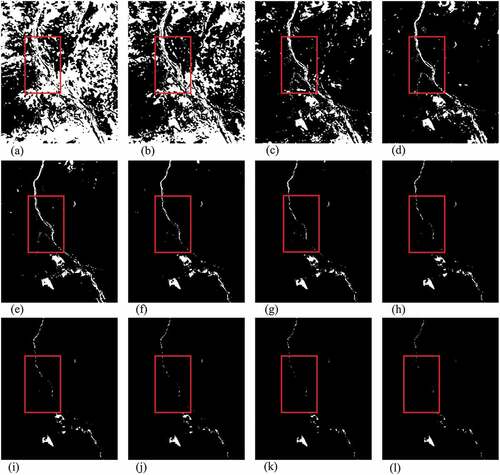
Two time series SAR images are considered as the input images to experiment for CD and the available ground truth image is manipulated with reference to the input images. The performance of the proposed LPCD method is compared with various change difference methods like Mean Ratio (MR), LR, and MR with Kittler-Illingworth algorithm (MRKI), LR with Kittler-Illingworth algorithm (LRKI), MR with Otsu algorithm (MRO), LR with Otsu algorithm (LRO), Fusing MR and LR methods with kittler-Illingworth algorithm (FMLKI) and Fusing MR and LR method with Otsu algorithm (FMLO). Comparisons with above-existing methods are depicted in – for (i) simulated dataset (ii) Athabasca dataset (iii) Alberta dataset and in (iv) Aare River dataset, respectively. It is clearly understandable that the figures mentioned above have the following observations, and the MR method finds differences by local mean value of the input images. Change map obtained by MR method represents unchanged pixels are wrongly identified as changed pixels, which carry more hot spots on the CD image. The LR method fails to detect change class pixels since the characteristics of logarithmic operator influenced to fade away the high-intensity pixels. MRKI and LRKI methods used KI algorithm for thresholding, and due to that, the error pixels are reduced when compared with direct analysis. MRO and LRO utilizes Otsu threshold algorithm, and it gives better pixel distributions of changed and unchanged classes and shows lesser hot spots. FMLKI and FMLO methods fuse MR and LR operator using principal component analysis (PCA) fusion rule. Fusing MR and LR method used thresholding techniques of KI and Otsu algorithm providing asymmetrical detection between two classes of pixels.
Figure 5. Experimental results of simulated images (a) I1 (b) I2 (c) Ground truth (d) MR (e) LR (f) MRKI (g) LRKI (h) MRO (i) LRO (j) FMLKI (k) FMLO (l) LPCD
Figure 6. Experimental results of Athabasca Dataset (a) I1 (b) I2 (c) Ground truth (d) MR (e) LR (f) MRKI (g) LRKI (h) MRO (i) LRO (j) FMLKI (k) FMLO (l) LPCD
Figure 7. Experimental results of Alberta Dataset (a) I1 (b) I2 (c) Ground truth (d) MR (e) LR (f) MRKI (g) LRKI (h) MRO (i) LRO (j) FMLKI (k) FMLO (l) LPCD
Figure 8. Experimental results of Aare River Dataset (a) I1; (b) I2; (c) Ground truth; (d) MR; (e) LR; (f) MRKI; (g) LRKI; (h) MRO; (i) LRO; (j) FMLKI; (k) FMLO; (l) LPCD
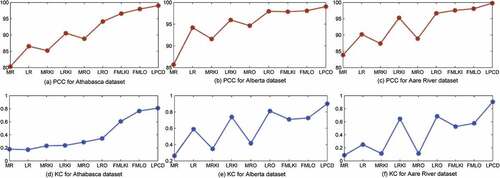
The proposed method is compared with above CD methods and evaluated by performance measures using confusion matrix parameters and are tabulated in – with respective (i), (ii), (iii) and (iv) datasets. The comparison results are proved that the proposed method is competent and afford excellent KC value of 0.9574 for (i), 0.8099 for (ii), 0.9018 for (iii) and 0.9064 for (iv) datasets and provide highest PCC of 99.21% for (i), 99.02% for (ii), 99.05% for (iii) and 99.78% (iv) datasets, respectively. ER 0.0079 for (i), 0.0098 for (ii), 0.0095 for (iii) and 0.0022 for (iv) are acquired, and it shows that the proposed method illustrates most of the changed pixels are identified correctly with minimum misclassification error. The rate of FAR and Miss rate (MsR) are lesser, which implicit the better class distribution of LPCD method. F1 scores obtained by LPCD method are 0.9618 for (i), 0.8148 for (ii), 0.9068 for (iii) and 0.9075 for (iv) dataset, which are comparatively higher than above-existing methods. The Detection Rate (DR) is more for LPCD, which shows the perfect classification of the proposed CD method. The pixel classifications by FN, FP and OE are comparatively less which proves the effective performance of the proposed method. Comparison plot for KC and PCC (%) are portrayed in .
Table 3. Evaluation of change detection for simulated images with different methods
Table 4. Evaluation of change detection for Athabasca oil sand dataset with different methods
Table 5. Evaluation of change detection for Alberta flood dataset with different methods
Table 6. Evaluation of change detection for Aare River dataset with different methods
Figure 9. Comparison Result of PCC for: (a) Athabasca dataset, (b) Alberta dataset, (c) Aare River dataset; Comparison Result of Kappa Coefficient for: (d) Athabasca dataset, (e) Alberta dataset, (f) Aare River dataset
The effectiveness of the proposed method is verified by comparing with other multiscale approaches like wavelet-based multiscale decomposition method with scale-driven approach (SDA) (Bovolo & Bruzzone, Citation2005), multiscale change analysis of similarity measure (KL-MCP) (Inglada & Mercier, Citation2007), multiscale CD by bayesian approach (BA-MCD) (Celik, Citation2010a) and multiscale SAR image preparation by the kennaugh element framework (K matrix-MS) (Schmitt, Wendleder, & Hinz, Citation2015), and the comparison result is shown in . The analysis of above various multiscale representations give the following facts that, in ), wavelet-based scale-driven approach showed better accuracy based on trial-and-error threshold selection, also this technique is unable to provide correct classification of change map upto the maximum extent. In ), KL-MCP is statistical similarity measure and its extension is considered for multiscale representation, which is wrongly detecting unchanged class pixels as a change class pixels and also shows false prediction on class distribution. ) shows BA-MCD approach, which has not identified number of scale selections for effective CD, and the computational complexity is more. In ), K matrix-MS is Kennaugh element framework for multiscale SAR image preparation to detect change map, which gives CD result in concern with number of looks of the SAR image. This framework gives blurring effect on the edges of each scale and takes more computation complexity. By examination of other multiscale approaches, it is obvious that the proposed LPCD method yields better performance, easy execution, exact class distribution among changed and unchanged pixels, edge enhancement and accurate area detection. The comparison of various performance measures is evaluated with above-existing approaches in terms of accuracy, FAR, ER, DR and KC, and are tabulated in . This performance measure shows that the LPCD method has better performance of high accuracy, less FAR and ER, high DR, high KC and less computation time.
Table 7. Comparison of different multiscale methods
Figure 10. Experiment results of comparison with multiscale methods (a) SDA (b) KL-MCP (c) BA-MCD (d) K matrix-MS (e) Proposed LPCD method
Class distribution by Otsu thresholding algorithm
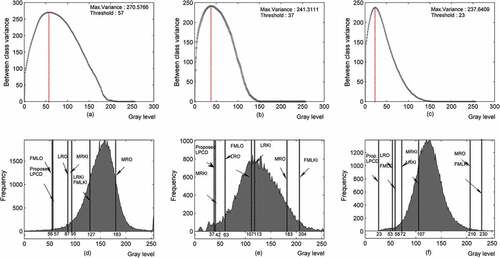
The perfect classification of the CD is carried out by Otsu thresholding algorithm. The optimal threshold value depends on the maximum class probability and class mean, where the class mean is the first-order statistical criterion (cumulative probability). In our proposed technique, Otsu method selects the threshold by exploiting the between-class variance
. The shows the pictorial representation of between-class variance
for various dataset images (Fan & Lei, Citation2012). ,) represents the plot of
value with corresponding gray-level value. ,) represents the histogram of an image with corresponding threshold value adapted by various CD methods (Muthukumaran, Gopalakrishnan, Purna, Soumitra, & Saravanan, Citation2017) and shows effective class distribution and automatic thresholding of the proposed method.
Figure 11. Otsu thresholding results: Vs gray level (a) Athabasca image, (b) Alberta image, (c) Aare river image; Histogram with threshold values: (a) Athabasca image, (b) Alberta image, (c) Aare river image
Thresholding method offers fine distribution of changed and unchanged pixels of the image. Here, Otsu algorithm is capable to distinguish the changed/unchanged criterion automatically, even the number of changed pixels is lesser than 5% of the whole image pixels. In , small change area (tiny portion with <5% of changed pixels) of the image is considered for testing.
Figure 12. Experiment results of Alberta dataset for Otsu thresholding (a) (b)
Otsu’s approach is experimented with (within-class variance) and
(between-class variance). The maximum value of between-class variance
can detect number of changed pixels closely and provides less OE. The simulation result of
and
are experimented for small percentage of changed pixels. This experiment shows
detected number of 3020 changed pixels with respect to ground truth of 3033 pixels, but
detected only a number of 2150 pixels. This shows minimum value of within-class variance
is fails to detect foreground pixels exactly and spatial information are not considered into an account. Hence, the within-class variance
is not suitable to classify less than 5% of change area of the whole image (Alexander et al., Citation2011) which is verified by NU and AOM, and is tabulated in .
Table 8. Experimental results for small percentage of changed pixels
The above experiment results show provides valid information of changed and unchanged class distribution compared to
. The proposed LPCD method is classified by the maximum value of between-class variance at
and is obtained at threshold value of
. The consideration of
dataset (ii) is used to experiment for various values of between-class variance, and the test image is classified by minimum to maximum threshold values in . The ) represents that the foreground and background pixels are effectively classified compared to other
values. carries the performance of AOM evaluated for different values of between-class variance
.
Table 9. Area overlap measure (AOM) for Otsu thresholding for different between class variance value in values.
Figure 13. Otsu segmentation result for Athabasca image (a) = 124.76; Threshold = 7, (b)
; Threshold = 14, (c)
; Threshold = 27, (d)
; Threshold = 39, (e)
; Threshold = 58, (f)
; Threshold = 88, (g)
; Threshold = 104, (h)
; Threshold = 115, (i)
; Threshold = 126, (j)
; Threshold = 135, (k)
; Threshold = 145, (l)
; Threshold = 154
The region NU and AOM are performance measurements for evaluating the effective classification of the thresholding algorithm. The assessment of effective classification of LPCD and various change map techniques are measured by AOM and NU, shown in ) respectively. The performance measures of NU and AOM are itemized in and respectively.
Table 10. Performance measures (region nonuniformity)
Table 11. Performance measures (area overlap measure)
Figure 14. Comparison results of (a) area overlap measure (AOM), (b) region nonuniformity (NU)
From an analysis of the proposed LPCD method it can be seen that the overall performance perceives best change map detection. The LP-based multiscale DI incorporated with speckle reduction and thresholding algorithm provide appreciable CD results. It enables speckle-free correct classification result and less computational time of 0.9639s compared to other existing multiscale methods. These significance makes LP multiscale analysis is apt for CD application and this method is suitable to work under crisis situation in disaster management. The entire experiments are executed on MATLAB in windows platform on the system configuration of Intel(R) Core(TM) i5-4210U [email protected] 2.40GHz, 4GB of RAM for SAR images.
Conclusions
In this paper, a novel CD method based on LP multiscale representation and the effective classification by thresholding algorithm is proposed. The significance of the proposed method is to restrain the unchanged class pixels ideally and to enhance the changed class pixels effectively with perfect boundaries. As specified in the literature, the characteristic of LR operation is flattening the high-intensity pixels and enhancing the pixels in the area of low intensity, which provides asymmetrical class distribution. Hence, the multiscale representation by LPCD is introduced to detect changes in medium band resolution and it provides changed and unchanged class distributions exactly. The proposed LP-based CD method is experimented with a simulated image and three real SAR image datasets.
The SAR images are highly degraded by speckle noise, hence preprocessing is an essential task for CD. In the first step, CAD is employed as a preprocessing tool for removing the speckle noise. CAD effectively suppresses the speckle content and preserve edges, enhance sharp details and reduce feature broadening effects. Profile for despeckled image shows the effective speckle reduction ability of CAD, which is proved by the computation of quality measures like SSIM, ENL and SSI. In second stage, speckle-free images are processed by LP domain, where the input images are decomposed into three band pass layers and a unique
low pass layer of the image. The proposed method preserve edges from the fine scale layers and the detailed information tentatively presents in coarse scale layer. The decomposed pyramid coefficients are manipulated by a LR operation and the reconstructed image is a DI. In the third stage, a threshold algorithm of Otsu’s method is applied on the DI to realize the automatic classification of the change map image. With the aid of thresholding experiment by two different variance approaches, it has proved that, our proposed method
can detect even less than 5% of changed class pixels (tiny area) of the whole image.
The quality of the LPCD method is analyzed by various standard measures like PCC, KC, F1- score, FAR, DR and so on. The proposed method affords perfect CD map with the preservation of required details. The correct classification of threshold algorithm is verified by the region NU measure and AOM. The efficacy of the proposed method is compared with various multiscale approaches. LP-based multiscale CD method provides exact change information from coarse to fine scale layer and can deal with a large selection of changed pixels with less computing time of 0.9639 s compared to other existing methods, which makes the proposed method is suitable to work under emergency conditions in disaster management. The future development of this work could be carried out by considering the similarity measures in pyramid layers which may provide higher number of dependency pixels between two successive layers of the image. Similarity measures are insensitive to sensor parameters, hence would make fast evaluation of changed and unchanged pixel separation framework. Also, it would be a concern to extend the proposed multiscale approach for multiband and polarimetric SAR images.
Correction Statement
This article has been republished with minor changes. These changes do not impact the academic content of the article.
Disclosure statement
No potential conflict of interest was reported by the authors.
References
- Adelson, E.H., Anderson, C.H., Bergen, J.R., Burt, P.J., & Ogden, J.M. (1984). Pyramid methods in image processing. RCA Engineer, 29(6), 33–41. Retrieved from http://persci.mit.edu/pub_pdfs/RCA84.pdf
- Ajadi, O.A., Meyer, F.J., & Webley, P.W. (2016). Change detection in synthetic aperture radar images using a multiscale-driven approach. Remote Sensing, 8(6), 1–27, 482. doi:10.3390/rs8060482
- Alexander, D., Joni-Kristian, K., Lensu, L., Vartiainen, J., Heikki, K., & Tuomas, E. (2011). Thresholding-based detection of fine and sparse details. Frontiers of Electrical and Electronics Engineering in China, 6(2), 328–338. doi:10.1007/s11460-011-0139-x
- Ashok, S., Varshney, P.K., & Arora, M.K. (2007). Robustness of change detection algorithms in the presence of registration errors. Photogrammetric Engineering and Remote Sensing, 73(4), 375–383. doi:10.14358/PERS.73.4.375
- Ban, Y., & Yousif, O.A. (2012). Multitemporal spaceborne SAR data for urban change detection in china. IEEE Journal of Selected Topics in Applied Earth Observations and Remote Sensing, 5(4), 1087–1094. doi:10.1109/JSTARS.2012.2201135
- Baselice, F., Ferraioli, G., & Pascazio, V. (2014). Markovian change detection of urban areas using very high resolution complex SAR images. IEEE Geoscience and Remote Sensing Letters, 11(5), 995–999. doi:10.1109/LGRS.2013.2284297
- Bazi, Y., Bruzzone, L., & Melgani, F. (2005). An unsupervised approach based on the generalized Gaussian model to automatic change detection in multitemporal SAR images. IEEE Transactions on Geoscience and Remote Sensing, 43(4), 874–887. doi:10.1109/TGRS.2004.842441
- Bovolo, F., & Bruzzone, L. (2005). A detail-preserving scale-driven approach to change detection in multitemporal SAR images. IEEE Transactions on Geoscience and Remote Sensing, 43(12), 2963–2972. doi:10.1109/TGRS.2005.857987
- Bovolo, F., Camps-Valls, G., & Bruzzone, L. (2010). A support vector domain method for change detection in multitemporal images. Pattern Recognition Letters, 31(10), 1148–1154. doi:10.1016/j.patrec.2009.07.002
- Bruzzone, L., & Prieto, D.F. (2000). Automatic analysis of the difference image for unsupervised change detection. IEEE Transactions on Geoscience and Remote Sensing, 38(3), 1171–1182. doi:10.1109/36.843009
- Burt, P., & Adelson, E. (1983a). Multiresolution spline with application to image mosaics. ACM Transactions on Graphics, 2, 217–236.
- Burt, P.J., & Adelson, E.H. (1983b). The Laplacian pyramid as a compact image code. IEEE Transactions on Communications, 31(4), 532–540. doi:10.1109/TCOM.1983.1095851
- Celik, T. (2009a). Multiscale change detection in multitemporal satellite images. IEEE Geoscience and Remote Sensing Letters, 6(4), 820–824. doi:10.1109/LGRS.2009.2026188
- Celik, T. (2009b). Unsupervised change detection in satellite images using principal component analysis and k-means clustering. IEEE Geoscience and Remote Sensing Letters, 6(4), 772–776. doi:10.1109/LGRS.2009.2025059
- Celik, T. (2010a). A Bayesian approach to unsupervised multiscale change detection in synthetic aperture radar images. Signal Processing, 90(5), 1471–1485. doi:10.1016/j.sigpro.2009.10.018
- Celik, T. (2010b). A Bayesian approach to unsupervised multiscale change detection in synthetic aperture radar images. Signal Processing, 90(5), 1471–1485. doi:10.1016/j.sigpro.2009.10.018
- Chesnokova, O., & Erten, E. (2013). A comparison between coherent and incoherent similarity measures in terms of crop inventory. IEEE Geoscience and Remote Sensing Letters, 10(2), 303–307. doi:10.1109/lgrs.2012.2203783
- Coupe, P., Hellier, P., Kervrann, C., & Barillot, C. (2009). Nonlocal means-based speckle filtering for ultrasound images. IEEE Transactions on Image Processing, 18(10), 2221–2229. doi:10.1109/TIP.2009.2024064
- Dekker, R.J. (1998). Speckle filtering in satellite SAR change detection imagery. International Journal of Remote Sensing, 19(6), 1133−1146. doi:10.1080/014311698215649
- Deng-Yuan, H., Ta-Wei, L., & Wu-Chih, H. (2011). Automatic multilevel thresholding based on two-stage Otsu’s method with cluster determination by valley estimation. International Journal of Innovative Computing, Information and Control, 7(10), 5631–5644. http://www.ijicic.org/ijicic-10-05033.pdf
- Dogan, O., & Perissin, D. (2014). Detection of multitransition abrupt changes in multitemporal SAR images. IEEE Journal of Selected Topics in Applied Earth Observations and Remote Sensing, 7(8), 3239–3247. doi:10.1109/JSTARS.2013.2295357
- Fan, J.-L., & Lei, B. (2012). A modified valley-emphasis method for automatic thresholding. Pattern Recognition Letters, 33(6), 703–708. doi:10.1016/j.patrec.2011.12.009
- Feddern, C., Weickert, J., Burgeth, B., & Welk, M. (2006). Curvature-driven PDE methods for matrix-valued images. International Journal of Computer Vision, 69(1), 93–107. doi:10.1007/s11263-006-6854-8
- Frost, V.S., Stiles, J.A., Shanmugan, K.S., & Holtzman, J.C. (1982). A model for radar images and its application to adaptive digital filtering of multiplicative noise. IEEE Transactions on Pattern Analysis and Machine Intelligence, PAMI-4(2), 157−166. doi:10.1109/TPAMI.1982.4767223
- Ghosh, M.K., Kumar, L., & Roy, C. (2015). Monitoring the coastline change of Hatiya Island in Bangladesh using remote sensing techniques. ISPRS Journal of Photogrammetry and Remote Sensing, 101, 137−144. doi:10.1016/j.isprsjprs.2014.12.009
- Gong, M., Cao, Y., & Wu., Q. (2012). A neighborhood-based ratio approach for change detection in SAR images. IEEE Geoscience and Remote Sensing Letters, 9(2), 307–311. doi:10.1109/LGRS.2011.2167211
- Gong, M., Yu, L., Jiao, L., Jia, M., & Su., L. (2014). SAR change detection based on intensity and texture changes. ISPRS Journal of Photogrammetry and Remote Sensing, 93, 123–135. doi:10.1016/j.isprsjprs.2014.04.010
- Gong, M., Zhou, Z., & Jingjing, M. (2012). Change detection in synthetic aperture radar images based on image fusion and fuzzy clustering. IEEE Transactions on Image Processing, 21(4), 2141–2151. doi:10.1109/TIP.2011.2170702
- Hadjimitsis, D.G., Papadavid, G., Agapiou, A., Themistocleous, K., Hadjimitsis, M.G., Retalis, A., … Clayton, C.R.I. (2010). Atmospheric correction for satellite remotely sensed data intended for agricultural applications: Impact on vegetation indices. Natural Hazards and Earth System Sciences, 10, 89–95. doi:10.5194/nhess-10-89-2010
- Hao, M., Shi, W., Zhang, H., & Li., C. (2014). Unsupervised change detection with expectation-maximization-based level set. IEEE Geoscience and Remote Sensing Letters, 11(1), 210–214. doi:10.1109/lgrs.2013.2252879
- Hazarika, N., Apurba, K.D., & Borah, S.B. (2015). Assessing land-use changes driven by river dynamics in chronically flood affected upper Brahmaputra plains, India, using RS-GIS techniques. The Egyptian Journal of Remote Sensing and Space Science, 18(1), 107−118. doi:10.1016/j.ejrs.2015.02.001
- Heeger, D.J., & Bergen, J.R. (1995). Pyramid-based texture analysis/synthesis. Proceedings, International Conference on Image Processing (pp. 648–651). doi:10.1109/ICIP.1995.537718
- Hu, H., & Ban, Y. (2014). Unsupervised change detection in multitemporal SAR images over large urban areas. IEEE Journal of Selected Topics in Applied Earth Observations and Remote Sensing, 7(8), 3248–3261. doi:10.1109/JSTARS.2014.2344017
- Inglada, J., & Mercier, G. (2007). A new statistical similarity measure for change detection in multitemporal SAR images and its extension to multiscale change analysis. IEEE Transactions on Geoscience and Remote Sensing, 45(5), 1432–1445. doi:10.1109/TGRS.2007.893568
- Jesus, A.-G., Arie, C.S., & Joost, F.D. (2012). Optimizing land cover classification accuracy for change detection, a combined pixel-based and object-based approach in a mountainous area in Mexico. Applied Geography, 34, 29–37. doi:10.1016/j.apgeog.2011.10.010
- John, B.C., & Woodcock, C.E. (1996). An assessment of several linear change detection techniques for mapping forest mortality using multitemporal landsat TM data. Remote Sensing of Environment, 56(1), 66–77. doi:10.1016/0034-4257(95)00233-2
- Kalaivani, S., & Wahidabanu, R.S.D. (2012a). Condensed anisotropic diffusion for speckle reducton and enhancement in ultrasonography. EURASIP Journal on Image and Video Processing, Springer, 1–17. doi:10.1186/1687-5281-2012-12
- Kalaivani, S., & Wahidabanu, R.S.D. (2012b). Diagnostic ultrasound image enhancement: A multiscale permutation approach. Journal of Imaging Science and Technology, 56(1), 10501(1–12). doi:10.2352/J.ImagingSci.Technol.2012.56.1.010501
- Kapur, J.N., Sahoo, P.K., & Wong, A.K.C. (1985). A new method for gray-level picture thresholding using the entropy of the histogram. Computer Vision, Graphics, and Image Processing, 29(3), 273–285. doi:10.1016/0734-189X(85)90125-2
- Kennedy, R.E., Cohen, W.B., & Schroeder, T.A. (2007). Trajectory-based change detection for automated characterization of forest disturbance dynamics. Remote Sensing of Environment, 110(3), 370–386. doi:10.1016/j.rse.2007.03.010
- Kittler, J., & Illingworth, J. (1986). Minimum error thresholding. Pattern Recognition, 19(1), 41–47. doi:10.1016/0031-3203(86)90030-0
- Krissian, K., Westin, C.-F., Kikinis, R., & Vosburgh, K.G. (2007). Oriented speckle reducing anisotropic diffusion. IEEE Transactions on Image Processing, 16(5), 1412–1424. doi:10.1109/TIP.2007.891803
- Kuan, D.T., Sawchuk, A.A., Strand, T.C., & Chavel, P. (1985). Adaptive noise smoothing filter for images with signal-dependent noise. Ieee Transactions on Pattern Analysis and Machine Intelligence, 7(2), 165−177. doi: 10.1109/tpami.1985.4767641
- Kuan, D.T., Sawchuk, A.A., Strand, T.C., & Chavel, P. (1987). Adaptive restoration of images with speckle. IEEE Transactions on Acoustics, Speech, and Signal Processing, 35(3), 373−383. doi:10.1109/tassp.1987.1165131
- Lal, A.M., & Margret Anouncia, S. (2015). Semi-supervised change detection approach combining sparse fusion and constrained k means for multi-temporal remote sensing images. The Egyptian Journal of Remote Sensing and Space Science, 18(2), 279–288. doi:10.1016/j.ejrs.2015.10.002
- Lee, J.-S. (1980). Digital image enhancement and noise filtering by use of local statistics. IEEE Transactions on Pattern Analysis and Machine Intelligence, PAMI-2(2), 165−168. doi:10.1109/TPAMI.1980.4766994
- Li, X., & Yeh, A.G.O. (1998). Principal component analysis of stacked multi-temporal images for the monitoring of rapid urban expansion in the Pearl River Delta. International Journal of Remote Sensing, 19(8), 1501–1518. doi:10.1080/014311698215315
- Lu, D., Mausel, P., Brondizio, E., & Moran, E. (2004). Change detection techniques. International Journal of Remote Sensing, 25(12), 2365−2407. doi:10.1080/0143116031000139863
- Ma, J., Gong, M., & Zhou, Z. (2012). Wavelet fusion on ratio images for change detection in SAR images. IEEE Geoscience and Remote Sensing Letters, 9(6), 1122–1126. doi:10.1109/LGRS.2012.2191387
- Masoomi, A., Hamzehyan, R., & Shirazi, N.C. (2012). Speckle reduction approach for SAR image in satellite communication. International Journal of Machine Learning and Computing, 2(1), 62–70. doi:10.1109/IGARSS.2017.8127463
- Masroor, H., Dongmei, C., Angela, C., Hui, W., & David, S. (2013). Change detection from remotely sensed images: From pixel-based to object-based approaches. ISPRS Journal of Photogrammetry and Remote Sensing, 80, 91–106. doi:10.1016/j.isprsjprs.2013.03.006
- Mehmet, S., & Sankur, B. (2004). Survey over image thresholding techniques and quantitative performance evaluation. Journal of Electronic Imaging, 13(1), 146–165. doi:10.1117/1.1631315
- Michael, U. (1992). An improved least squares laplacian pyramid for image compression. Signal Processing, 27(2), 187–203. doi:10.1016/0165-1684(92)90007-J
- Michailovich, O.V., & Tannenbaum, A. (2006). Despeckling of medical ultrasound images. IEEE Transactions on Ultrasonics, Ferroelectrics, and Frequency Control, 53(1), 64–78. doi:10.1109/TUFFC.2006.1588392
- Moser, G., & Serpico, S.B. (2006). Generalized minimum-error thresholding for unsupervised change detection from SAR amplitude imagery. IEEE Transactions on Geoscience and Remote Sensing, 44(10), 2972–2982. doi:10.1109/TGRS.2006.876288
- Mura, M.D., Benediktsson, J.A., Bovolo, F., & Bruzzone, L. (2008). An unsupervised technique based on morphological filters for change detection in very high resolution images. IEEE Geoscience and Remote Sensing Letters, 5(3), 433–437. doi:10.1109/LGRS.2008.917726
- Muthukumaran, M., Gopalakrishnan, S., Purna, C., Soumitra, K., & Saravanan, T. (2017). An improved version of Otsu’s method for segmentation of weld defects on X-radiography images. Optik, 142, 109–118. doi:10.1016/j.ijleo.2017.05.066
- Otsu, N. (1979). A Threshold selection method from gray-level histograms. IEEE Transactions on Systems, Man, and Cybernetics, 9(1), 62–66. doi:10.1109/TSMC.1979.4310076
- Patel, V.M., Easley, G.R., Chellappa, R., & Nasrabadi, N.M. (2014). Separated component-based restoration of speckled SAR images. IEEE Transactions on Geoscience and Remote Sensing, 52(2), 1019–1029. doi:10.1109/TGRS.2013.2246794
- Perona, P., & Malik, J. (1990). Scale-space and edge detection using anisotropic diffusion. IEEE Transactions on Pattern Analysis and Machine Intelligence, 12(7), 629–639. doi:10.1109/34.56205
- Perry, J. (1997). Image compression using Laplacian pyramid encoding. C/C++ Users Journal, 15(2), 35–47.
- Pratt, W.K. (1978). Digital image processing. A Wiley-Interscience Publication, John Wiley & Sons, Inc. Retrieved from https://dl.acm.org/citation.cfm?id=108781.
- Radke, R.J., Andra, S., Al-kofahi, O., & Roysam, B. (2005). Image change detection algorithms: A systematic survey. IEEE Transactions on Image Processing, 14(3), 294–307. doi:10.1109/TIP.2004.838698
- Rajan, J., & Kaimal, R.M. (2006). Speckle reduction in images with WEAD and WECD, Springer ICVGIP, LNCS 4338, 184–193. doi:10.1007/11949619_17
- Rosenfield, G.H., & Fitzpatrick-Lins, K. (1986). A coefficient of agreement as a measure of thematic classification accuracy. Photogrammetric Engineering and Remote Sensing, 52(2), 223–227.
- Rosin, P.L. (2001). Unimodal thresholding. Pattern Recognition, 34(11), 2083–2096. doi:10.1016/S0031-3203(00)00136-9
- Rosin, P.L., & Ioannidis, E. (2003). Evaluation of global image thresholding for change detection. Pattern Recognition Letters, 24(14), 2345–2356. doi:10.1016/S0167-8655(03)00060-6
- Sartajvir, S., & Rajneesh, T. (2014). A comparative study on change vector analysis based change detection techniques. Sadhana, 39(6), 1311–1331. doi:10.1007/s12046-014-0286-x
- Schmitt, A., Wendleder, A., & Hinz, S. (2015). The Kennaugh element framework for multi-scale, multi-polarized, multi-temporal and multi-frequency SAR image preparation. ISPRS Journal of Photogrammetry and Remote Sensing, 102, 122–139. doi:10.1016/j.isprsjprs.2015.01.007
- Shalaby, A., & Tateishi, R. (2007). Remote sensing and GIS for mapping and monitoring land cover and land-use changes in the Northwestern coastal zone of Egypt. Applied Geography, 27(1), 28–41. doi:10.1016/j.apgeog.2006.09.004
- Shang, R., Qi., L., Jiao, L., Stolkin, R., & Li, Y. (2014). Change detection in SAR images by artificial immune multi-objective clustering. Engineering Applications of Artificial Intelligence, 31, 53–67. doi:10.1016/j.engappai.2014.02.004
- Sheng, Y., & Xia, Z.-G. (1996). A comprehensive evaluation of filters for radar speckle suppression. International Geoscience and Remote Sensing Symposium, 1559–1561, doi:10.1109/IGARSS.1996.516730
- Singh, A. (1989). Review article digital change detection techniques using remotely-sensed data. International Journal of Remote Sensing, 10(6), 989–1003. doi:10.1080/01431168908903939
- Tsai, D.-M. (1995). A fast thresholding selection procedure for multimodal and unimodal histograms. Pattern Recognition Letters, 16(6), 653–666. doi:10.1016/0167-8655(95)80011-H
- Wang, F., Wu, Y., Zhang, Q., Zhang, P., Ming, L., & Yunlong, L. (2013). Unsupervised change detection on SAR images using Triplet Markov field model. IEEE Geoscience and Remote Sensing Letters, 10(4), 697–701. doi:10.1109/LGRS.2012.2219494
- Xu, X., Xu, S., Jin, L., & Song, E. (2011). Characteristic analysis of Otsu threshold and its applications. Pattern Recognition Letters, 32(7), 956–961. doi:10.1016/j.patrec.2011.01.021
- Yang, X., Shen, X., Long, J., & Chen, H. (2012). An improved median-based Otsu image thresholding algorithm. AASRI Procedia, 3, 468–473. doi:10.1016/j.aasri.2012.11.074
- you, Y.-L., & Kaveh, M. (2000). Fourth-order partial differential equations for noise removal. IEEE Transactions on Image Processing, 9(10), 1723–1730. doi:10.1109/83.869184
- yousif, O., & Ban, Y. (2013). Improving urban change detection from multitemporal SAR images using PCA-NLM. IEEE Transactions on Geoscience and Remote Sensing, 51(4), 2032–2041. doi:10.1109/TGRS.2013.2245900
- yousif, O., & Ban, Y. (2014). Improving SAR-based urban change detection by combining MAP-MRF classifier and nonlocal means similarly weights. IEEE Journal of Selected Topics in Applied Earth Observations and Remote Sensing, 7(10), 4288–4300. doi:10.1109/jstars.2014.2347171
- Yu, S.X. (2009). Edge-preserving Laplacian pyramid. 5th International Symposium on Visual computing, USA, 1–10.
- Yu, Y., & Acton, S.T. (2002). Speckle reducing anisotropic diffusion. IEEE Transactions on Image Processing, 11(11), 1260–1270. doi:10.1109/TIP.2002.804276
- Zhang, F., Yoo, Y.M., Koh, L.M., & Kim, Y. (2007). Nonlinear diffusion in Laplacian pyramid domain for ultrasonic speckle reduction. IEEE Transactions on Medical Imaging, 26(2), 200–211. doi:10.1109/TMI.2006.889735