
 ?Mathematical formulae have been encoded as MathML and are displayed in this HTML version using MathJax in order to improve their display. Uncheck the box to turn MathJax off. This feature requires Javascript. Click on a formula to zoom.
ABSTRACT
Ratio and log ratio operators were widely used in change detection of synthetic aperture radar (SAR) images. It is well known for the researchers who focus on change detection of SAR images that log ratio outperforms ratio because logarithmic transformation can not only transform multiplicative noise into additive noise but also compress the value range of ratio. Nevertheless, this is a misunderstanding because 1) we have proven that the difference images before and after logarithmic transformation have the same receiver operating characteristic (ROC) curve; and 2) by comparing their capability in detecting different change types, we figured out the reason of the inaccurate results is that there are two intensity change types in multi-temporal SAR images and many scholars regarded them as one type (intensity increasing or decreasing). Experimental results on three original and stitched data sets confirm that: log ratio outperforms ratio is a misunderstanding in change detection of SAR images.
Introduction
Change detection techniques can be applied to detect the land cover changes that have occurred in the investigated area by using remote sensing images acquired in the same geographical area at two different dates (Bruzzone & Prieto, Citation2000). In the last decades, these techniques have been widely used in environmental monitoring, urban studies, disaster assessment, etc. (Bovolo, Marin, & Bruzzone, Citation2013; Chehata, Orny, Boukir, Guyon, & Wigneron, Citation2014; Lu, Mausel, & Moran, Citation2004; Zhuang, Deng, Fan, & Yu, Citation2016).
Compared with optical remote sensing satellites, synthetic aperture radar (SAR) can penetrate thin clouds, fog, and haze to obtain the images, and is insensitive to sun-illumination conditions. In recent years, with the launch of more SAR satellites and the development of SAR images processing techniques, change detection has become one of the most interesting topics in information extraction from SAR images (Akbari, Anfinsen, Doulgeris, & Eltoft, Citation2016; Hachicha & Chaabane, Citation2014; Zhuang, Fan, Deng, & Yu, Citation2018).
Generating difference image is a key step for change detection in SAR images (Lu et al., Citation2004; Zhuang, Deng, Fan, & Ma, Citation2018). Compared with subtraction method, ratio method is more suitable for obtaining difference image from SAR images because it can decrease the influence of calibration and radiometric errors (Lu et al., Citation2004; Rignot & Van Zyl, Citation1993; Singh, Citation1989). However, the accuracy of change detection in SAR images is limited by the inherent speckle noise (Argenti & Alparone, Citation2002; Gleich & Datcu, Citation2006). Considering the multiplicative nature of speckle noise, log ratio method was proposed and widely used in change detection of SAR images because logarithmic transformation can not only transform multiplicative noise into additive noise but also compress the value range of ratio method (Bovolo & Bruzzone, Citation2005; Bovolo et al., Citation2013; Dekker, Citation1998; Gong, Cao, & Wu, Citation2012). For instance, ratioing multi-temporal SAR images and logarithmic scaling of the ratio-image are two stages used to obtain the difference image in the literature (Dekker, Citation1998). The ratio operator represented in the logarithmic scale is used to compare the multi-temporal SAR images (Bazi, Bruzzone, & Melgani, Citation2005). Instead of ratio operator, log ratio operator was selected to obtain the difference image in the literature (Bovolo & Bruzzone, Citation2005). It is well known for the researchers who focus on change detection of SAR images that the performance of log ratio is better than ratio (Bovolo & Bruzzone, Citation2005; Zhuang, Fan, Deng, & Yao, Citation2018; Zhuang, Fan, Deng, & Yu, Citation2018).Footnote1 Therefore, log ratio was employed as one of the competitive approaches in many literature focusing on change detection of SAR images (Gong, Cao, & Wu, Citation2012; Su, Gong, & Sun, Citation2014; Zhuang, Deng, Fan, & Ma, Citation2018). And we believed this situation until we found that the difference images before and after logarithmic transformation have the same receiver operating characteristic (ROC) curve, which is effective and widely used to compare the difference images obtained with different methods (Ma, Gong, & Zhou, Citation2012; Webb & Ting, Citation2005; Zhuang, Deng, Fan, & Ma, Citation2018). Then, we thought of the recognized experience that log ratio performs better than ratio in change detection of SAR images and suspected that the aforementioned experimental result was wrong. However, we once again confirmed that this experimental result was correct by checking experimental settings. At this point, we fall into the thought why the performance of log ratio is better than the ratio in change detection of SAR images? Through comparing the capability of ratio and log ratio operators in detecting different change types by intensive testing, we found that many scholars ignored that there are more than one change types in the change detection tasks and only regarded them as one type (intensity increasing or decreasing), which leads to that log ratio outperforms ratio in many change detection experiments.Footnote2 In order to correct the recognized experience, we will analyze and prove this problem in detail. The flowchart of this study is shown in .
Figure 1. The flowchart of this study
Methods and problem analysis
The description of the symbols used in this study is shown in .
Table 1. List of symbols used in this study
Ratio operator
Let us consider two SAR images and
obtained on the same geographical area at two dates. Let
and
represent the intensity of the pixels at position
in images
and
, respectively. Then, original ratio (OR) (Singh, Citation1989) and improved ratio (IR)Footnote3 (Oliver & Quegan, Citation2004) operators can be shown as EquationEquations (1)
(1)
(1) and (Equation2
(2)
(2) )
where and
are the difference values acquired with OR and IR, respectively. In the difference image obtained with IR (such as ), the changed pixel has a large difference value while the unchanged pixel has a small difference value.
There are two intensity change types in multi-temporal SAR images (Zhuang, Fan, Deng, &Yu Citation2018): 1) the intensity value of pixel in the image acquired in is smaller than
which is denoted as
(i.e. intensity increasing); and 2) the intensity value of pixel in the image acquired in
is larger than
which is denoted as
(i.e. intensity decreasing).
computed with EquationEquation (1)
(1)
(1) is smaller than 1 for the first change type while it is larger than 1 for the second change type;
is approximately equal to 1 in the case of an unchanged pixel. For IR, the changed pixels with change types
and
have similar difference values, thus IR can detect the changed pixels with different change types simultaneously.
Log ratio operator
Original log ratio (OLR) (Bovolo & Bruzzone, Citation2005; Bovolo et al., Citation2013) and improved log ratio (ILR)Footnote4 (Ma et al., Citation2012) operators are shown in EquationEquations (3)(3)
(3) and (Equation4
(4)
(4) )
Where and
are the difference values acquired with OLR and ILR, respectively.
for change type
;
for change type
. Therefore, in the literature focusing on change detection of SAR images (Bazi et al., Citation2005; Bruzzone & Prieto, Citation2000; Zhuang, Fan, Deng, & Yu, Citation2018), OLR can only detect one of the two change types (i.e. only the changed pixels with one type have large intensities) with a threshold. However, ILR can simultaneously highlight the changed pixels of both change types because
of changed pixel with types
or
is larger than the unchanged pixel.
To clearly validate that logarithmic transformation cannot change the ROC curve of difference image, we define EquationEquation (5)(5)
(5) (named log IR (LIR)) by applying the logarithmic transformation to EquationEquation (2)
(2)
(2)
where is the difference value acquired with LIR.
Problem analysis
In an experiment, we got two difference images generated with IR and LIR and plotted their ROC curves. We were surprised at the experimental results that they have the same ROC curve. Through analyzing the effect of logarithmic transformation on the ROC curve, we found that if you use a monotonically increasing linear or non-linear function to transform a difference image to obtain a new difference image, then the ROC curve of the new difference image is the same as that of the original difference image. This is because, for any pixel value
in the original image and any given threshold
,
if and only if
. Hence, the false alarm rate and detection rate of the original difference image, segmented with a threshold
, are the same as those of the new difference image segmented with the threshold
.
Given the fact that logarithmic transformation does not change the ROC curve of difference image, why does log ratio perform better than ratio in change detection of SAR images? OLR should perform worse than IR because IR can detect two change types with a threshold while OLR can only detect one of the two change types. However, on the contrary, it is well known for the researchers who focus on change detection of SAR images that log ratio performs better than ratio. This situation made us very confused. We thought that there may be a link between OLR can only detect one change type and it performs better than ratio in change detection of SAR images. The reason will be explored by the following experiments on comparing the capability of ratio and log ratio operators in detecting different change types.
Experiments and discussion
Experimental data sets
The first data set (i.e. )) used in this study represents a section (301 × 301 pixels with resolution 30 m) of two images acquired by ERS-2 over an area in Berne, Switzerland, in April 1999 and May 1999. , the reference map used to calculate ROC curves (Webb & Ting, Citation2005) of difference images, was defined manually according to an accurate and time-consuming visual inspection of the considered SAR images. The first data set only includes the change type . To get a data set containing two change types such that we can well compare the performances of IR, OLR, and ILR, the multi-temporal images in Berne were stitched together to obtain a new data set. This new data set is shown in , the changed pixels in its left part are of the change type
while the changed pixels in its right part are of the change type
.
Figure 2. Multi-temporal images acquired by ERS-2 in Berne, Switzerland and their stitched images containing two change types. (a) Image acquired in April 1999. (b) Image acquired in May 1999. (c) Reference map. (d) stitched image acquired at , the left part is the same as Figure 2(a) and the right part is the same as Figure 2(b). (e) Stitched image acquired at
, the left part is the same as Figure 2(b) and the right part is the same as Figure 2(a). (f) Reference map of stitched images
The second data set is composed of two images (i.e. ) acquired in the same area through the Radarsat-1 satellite. The area shown in two images is a section (290 × 350 pixels with resolution 30 m) of a scene acquired in Ottawa, Canada, in May 1997 and August 1997. , defined as , is the reference map used to calculate ROC curves (Webb & Ting, Citation2005) of difference images. The second data set only includes the change type . Similar to Berne data set, we stitched the multi-temporal images in Ottawa to obtain a new stitched data set which containing two change types. This new data set is shown in , the changed pixels in its left part are of the change type
while the changed pixels in its right part are of the change type
.
The third dataset (i.e. ) used in this study represents a section (400 × 400 pixels with resolution 3 m) of two images acquired through Radarsat-2 over an area in FengFeng, China, in April 2015 and March 2016. , defined as ) and , is the reference map used to calculate ROC curves (Webb & Ting, Citation2005) of difference images. The third data set includes two change types and
simultaneously. The changed pixels of change type
are larger than that of change type
. Similar to Berne and Ottawa data set, we stitched the multi-temporal images in FengFeng to obtain a new stitched data set which contains two change types with balanced proportion. This new data set is shown in , the most changed pixels in its left part are of the change type
while the most changed pixels in its right part are of the change type
.
Figure 3. Multi-temporal images acquired by radarsat-1 in Ottawa, Canada and their stitched images containing two change types. (a) Image acquired in May 1997. (b) Image acquired in August 1997. (c) Reference map. (d) stitched image acquired at , the left part is the same as Figure 3(a) and the right part is the same as Figure 3(b). (e) Stitched image acquired at
, the left part is the same as Figure 3(b) and the right part is the same as Figure 3(a). (f) Reference map of stitched images
Figure 4. Multi-temporal images acquired by radarsat-2 in FengFeng, China and their stitched images containing two change types. (a) Image acquired in April 2015. (b) Image acquired in March 2016. (c) Reference map. (d) Stitched image acquired at , the left part is the same as Figure 4 (a) and the right part is the same as Figure 4(b). (e) Stitched image acquired at
, the left part is the same as Figure 4(b) and the right part is the same as Figure 4(a). (f) Reference map of stitched images
Description of the experiments
The experiments are first carried out on three original data sets to compare the performances of different methods. The original Berne data set only include the change type while the original Ottawa data set only include the change type
. The original FengFeng data set includes two change types
and
simultaneously, however, the changed pixels of change type
are larger than that of change type
. Therefore, the experiments performed on three original data sets cannot compare the performances of different methods adequately. To overcome the limit of the original data sets, the experiments are carried out on three stitched data sets to clearly compare the performances of different methods because the number of changed pixels of change type
is the same as that of change type
in the stitched data sets.
The ROC curve originated from statistical decision theory for explaining the relationship of classification between hit and false alarm rates (Zhuang, Deng, Fan, & Ma, Citation2018). It is intuitive to compare the performances of different classifiers if their ROC curves are plotted on the same coordinate system (Webb & Ting, Citation2005). The performance of the classifier is better when the ROC curve is closer to the upper left corner. Change detection can be considered as a binary classification problem in which a pixel is divided into changed or unchanged type (Zhuang, Deng, Fan, & Ma, Citation2018). IR, LIR, OLR, and ILR can be considered as the specific binary classifiers designed for change detection. Therefore, we compare the performances of different operators through their ROC curves. OR is rarely used for change detection in SAR images, thus it is not employed to compare with other methods in this study.
Experimental results of original data sets
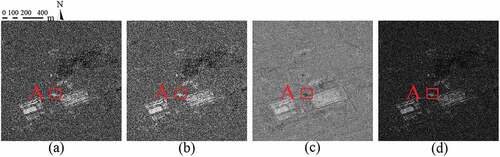
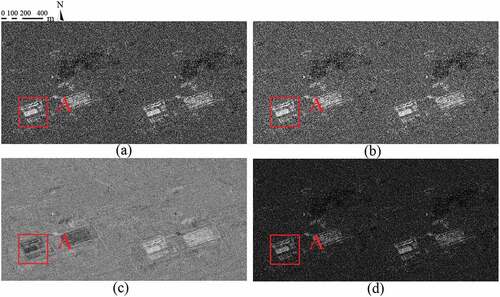
The difference images generated with IR, LIR, OLR, and ILR in original data sets are shown in , , and separately. IR, LIR, OLR, and ILR can highlight the changed area in original Berne and Ottawa data sets because they only include one change type. For FengFeng data set with two change types, OLR cannot highlight the changed pixels in the rectangle A while IR, LIR and ILR can highlight the changed pixels with two change types simultaneously.
Figure 5. Difference images generated from Berne data set by using (a) IR, (b) LIR, (c) OLR, and (d) ILR
Figure 6. Difference images generated from Ottawa data set by using (a) IR, (b) LIR, (c) OLR, and (d) ILR
Figure 7. Difference images generated from FengFeng data set by using (a) IR, (b) LIR, (c) OLR, and (d) ILR
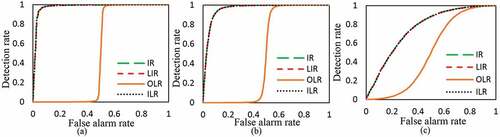
ROC curves of the difference images generated in three original data set by using different methods are shown in . The performance of the method is better when the ROC curve is closer to the upper left corner (Ma et al., Citation2012; Webb & Ting, Citation2005). For example, in , the ROC curves of IR, LIR, and ILR are under OLR, for the same false alarm rate, the detection rate of OLR is larger than IR, LIR, and ILR, thus OLR performs better than IR, LIR, and ILR in the special data set with one real change type. This is because OLR can only highlight the changed pixels of change type while ignoring the changed pixels of change type
. And the pixels of change type
in the original Berne data set are false alarm changed pixels caused by inherent speckle noise in SAR images (Argenti & Alparone, Citation2002).
Figure 8. ROC curves of the difference images generated with IR, LIR, OLR, and ILR in original (a) Berne, (b) Ottawa, and (c) FengFeng data sets
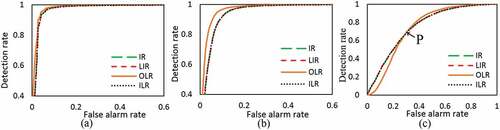
The ROC curves of the difference images obtained in original FengFeng data set are obviously different from that in original Berne and Ottawa data sets. There is a cross-point between the ROC curves of IR and OLR. In , in the left of
, the ROC curve corresponding to IR is on top of that corresponding to OLR because IR can highlight the changed pixels of two change types while OLR can only highlight one change type and there are changed pixels of two change types in original FengFeng data set while the original Berne and Ottawa data sets only include the changed pixels of one type. Nevertheless, with the increasing of false alarm rate, in the right of P, the ROC curve corresponding to OLR is on top of that corresponding to IR because the false alarm changed pixels of change type
are larger than detected changed pixels of change type
.
For all three original data sets, it is clear that ROC curve of the difference image obtained with IR is the same as that of LIR, which shows that logarithmic transformation (a monotonically increasing transformation) cannot change ROC curve of difference image. Moreover, it can be seen that the ROC curves of IR and ILR are highly coincident, which indicates that IR and ILR have the same performance in change detection of SAR images.
Experimental results of stitched data sets
The difference images generated with IR, LIR, OLR, and ILR in the stitched FengFeng data sets are shown in .Footnote5 Experimental results on the stitched data sets are similar. Compared with IR, LIR, and ILR, OLR cannot highlight the changed pixels in rectangle A which also confirms that OLR can only highlight one of the two change types.
Figure 9. Difference images generated from stitched FengFeng data set by using (a) IR, (b) LIR, (c) OLR, and (d) ILR
The stitched data sets are specially designed for clearly comparing the performances of different methods, of which the number of changed pixels of change type is the same as that of change type
. ROC curves of the difference images acquired with IR, LIR, OLR, and ILR in three stitched data sets are shown in . Obviously, the performance of ILR is the same as IR, and the performance of OLR is worse than IR in all three stitched data sets, which once again validates the viewpoint of this study that log ratio performs better than ratio is a misunderstanding.
Figure 10. ROC curves of the difference images generated with IR, LIR, OLR, and ILR in stitched (a) Berne, (b) Ottawa, and (c) FengFeng data sets
Discussion on the study
It is worth noting that the purpose of this study is not to simply compare the performances of ratio and log ratio methods in change detection of SAR images. This study aims to report and correct a well-known but inaccurate experience that log ratio performs better than ratio in change detection of SAR images, which was accidentally discovered in one of our experiments. Obviously, the performance of OLR with dual threshold is the same as IR and ILR with single threshold, however the single threshold is usually used for OLR in change detection of SAR images (Bazi et al., Citation2005; Bruzzone & Prieto, Citation2000; Zhuang, Fan, Deng, & Yu, Citation2018), which makes OLR performs better than IR in the data set with one real change type. Experiments were conducted on three original and stitched data sets to prove the findings of this study. To objectively compare the performances of ratio and log ratio methods, ROC curve was used to compare the difference images acquired with them. The parameters such as missed alarms, overall error and detected changes can be used to compare the change map usually obtained with a threshold, however they are not necessary for the purpose of this study. And ROC curve is effective and enough to compare and analyze different methods because it shows the detection and false alarm rates corresponding to all possible thresholds. Experiments show that the well-known but inaccurate experience was formed because the data sets used in many literature focusing on change detection of SAR images only include one real change type ( or
). In this special case, for OLR, the false alarm changed pixels with another change type (
or
) will be treated as unchanged pixels such that OLR performs better than IR. In other words, the shortcoming that OLR can only detect one change type with a threshold makes it perform better than IR in the data sets only including one real change type. Experimental results indicate that the performance of ILR is the same as IR which verifies the theoretical analysis that logarithmic transformation (a monotonically increasing transformation) does not change the ROC curve of difference image. In addition, OLR performs better than IR in two special cases: 1) the data set only has one real change type; and 2) the data set has two real change types, but the real changed pixels of one change type are smaller than the false alarm changed pixels of the same change type. What’s more, OLR performs worse than IR when the data set has two change types and the real changed pixels of any one of the two change types are larger than the false alarm changed pixels of the same change type.
Conclusions
This study reported and corrected a well-known but inaccurate experience that log ratio performs better than ratio in change detection of SAR images. It is of great enlightenment and guiding significance for the researchers who focus on change detection of SAR images. Experiments on three original data sets reveal two special cases that OLR outperforms IR in change detection of SAR images. Experimental results on three stitched data sets show that: 1) the performance of OLR is worse than IR; and 2) the performance of IR is the same as ILR. This work contributes to: 1) we validated that the monotonically increasing linear or non-linear transformation cannot change the ROC curve of a difference image; and 2) we found and confirmed the reason that log ratio performs better than ratio is a misunderstanding in change detection of SAR images. The reasons are: 1) the intensity change in multi-temporal SAR images can be divided into two main types (i.e. intensity increasing and intensity decreasing); 2) the data sets used in many literature focusing on change detection of SAR images only include one real change type; 3) OLR can only detect one of the two change types while the false alarm changed pixels with another change type caused by noise are ignored; and 4) IR can detect two change types simultaneously.
In addition, the experiments in this study also indicate that ratio operator is suitable for generating difference image in the data set with multiplicative noise while subtraction operator is suitable for the data set with additive noise (in EquationEquations (3)(3)
(3) and (Equation4
(4)
(4) ), log ratio is equivalent to using subtraction operator in logarithmic transformation domain). Generating difference image by using ratio in the data set with multiplicative noise is equivalent to generating difference image by using subtraction operator in the data set that the multiplicative noise has been converted into additive noise by logarithmic transformation.
Acknowledgments
This work was partially supported by the National Natural Science Foundation of China under Grants 51774270, 41604005 and 41701504, the National Key Research and Development Program of China under Grants 2017YFE0107100.
Disclosure statement
No potential conflict of interest was reported by the authors.
Additional information
Funding
Notes
1 In a manuscript submitted to IEEE Transactions on Geoscience & Remote Sensing, an anonymous review expert presented an opinion on the difference images acquired with ratio and log ratio in Berne data set (see ): “Actually, according to my experience, log ratio would work much better than ratio in the generation of difference image in SAR images.”
2 Erenow, we believed this idea without a shadow of doubt because the experiments carried out on many data sets show it is right.
3 It is worth noting that IR was called “ratio” in many literature. In this study, it is named IR to clearly show the development history of ratio operator (including OR and IR in this study).
4 It is worth noting that both OLR and ILR were called “log ratio” in other literature. In this study, we use the names OLR and ILR to clearly show the development history of log ratio operator. And the name log ratio represents both OLR and ILR in this study.
5 To avoid repetition, only the difference images of the stitched FengFeng data set are shown in this study.
References
- Akbari, V., Anfinsen, S.N., Doulgeris, A.P., & Eltoft, T. (2016). Polarimetric SAR change detection with the complex Hotelling–Lawley trace statistic. IEEE Transactions on Geoscience & Remote Sensing, 54(7), 3953–3966. doi:10.1109/TGRS.2016.2532320
- Argenti, F., & Alparone, L. (2002). Speckle removal from SAR images in the undecimated wavelet domain. IEEE Transactions on Geoscience & Remote Sensing, 40(11), 2363–2374. doi:10.1109/TGRS.2002.805083
- Bazi, Y., Bruzzone, L., & Melgani, F. (2005). An unsupervised approach based on the generalized Gaussian model to automatic change detection in multitemporal SAR images. IEEE Transactions on Geoscience & Remote Sensing, 43(4), 874–887. doi:10.1109/TGRS.2004.842441
- Bovolo, F., & Bruzzone, L. (2005). A detail-preserving scale-driven approach to change detection in multitemporal SAR images. IEEE Transactions on Geoscience & Remote Sensing, 43(12), 2963–2972. doi:10.1109/TGRS.2005.857987
- Bovolo, F., Marin, C., & Bruzzone, L. (2013). A hierarchical approach to change detection in very high resolution SAR images for surveillance applications. IEEE Transactions on Geoscience & Remote Sensing, 51(4), 2042–2054. doi:10.1109/TGRS.2012.2223219
- Bruzzone, L., & Prieto, D.F. (2000). Automatic analysis of the difference image for unsupervised change detection. IEEE Transactions on Geoscience & Remote Sensing, 38(3), 1171–1182. doi:10.1109/36.843009
- Chehata, N., Orny, C., Boukir, S., Guyon, D., & Wigneron, J.P. (2014). Object-based change detection in wind storm-damaged forest using high-resolution multispectral images. International Journal of Remote Sensing, 35(13), 4758–4777. doi:10.1080/01431161.2014.930199
- Dekker, R.J. (1998). Speckle filtering in satellite SAR change detection imagery. International Journal of Remote Sensing, 19(6), 1133–1146. doi:10.1080/014311698215649
- Gleich, D., & Datcu, M. (2006). Gauss-Markov model for wavelet-based SAR image despeckling. IEEE Signal Processing Letters, 13(6), 365–368. doi:10.1109/LSP.2006.871712
- Gong, M., Cao, Y., & Wu, Q. (2012). A neighborhood-based ratio approach for change detection in SAR images. IEEE Geoscience & Remote Sensing Letters, 9(2), 307–311. doi:10.1109/LGRS.2011.2167211
- Hachicha, S., & Chaabane, F. (2014). On the SAR change detection review and optimal decision. International Journal of Remote Sensing, 35(5), 1693–1714. doi:10.1080/01431161.2014.882030
- Lu, D., Mausel, P., & Moran, E.B.E. (2004). Change detection techniques. International Journal of Remote Sensing, 25(12), 2365–2401. doi:10.1080/0143116031000139863
- Ma, J., Gong, M., & Zhou, Z. (2012). Wavelet fusion on ratio images for change detection in SAR images. IEEE Geoscience & Remote Sensing Letters, 9(6), 1122–1126. doi:10.1109/LGRS.2012.2191387
- Oliver, C., & Quegan, S. (2004). Understanding synthetic aperture radar images. Raleigh: SciTech Publishing.
- Rignot, E.J.M., & Van Zyl, J.J. (1993). Change detection techniques for ERS-1 SAR data. IEEE Transactions on Geoscience & Remote Sensing, 31(4), 896–906. doi:10.1109/36.239913
- Singh, A. (1989). Review article digital change detection techniques using remotely sensed data. International Journal of Remote Sensing, 10(6), 989–1003. doi:10.1080/01431168908903939
- Su, L., Gong, M., & Sun, B. (2014). Change detection in synthetic aperture radar images based on non-local means with ratio similarity measurement. International Journal of Remote Sensing, 35(22), 7673–7690. doi:10.1080/01431161.2014.975378
- Webb, G.I., & Ting, K. (2005). On the application of ROC analysis to predict classification performance under varying class distributions. Machine Learning, 58(1), 25–32. doi:10.1007/s10994-005-4257-7
- Zhuang, H., Deng, K., Fan, H., & Ma, S. (2018). A novel approach based on structural information for change detection in SAR images. International Journal of Remote Sensing, 39(8), 2341–2365. doi:10.1080/01431161.2017.1421794
- Zhuang, H., Deng, K., Fan, H., & Yu, M. (2016). Strategies combining spectral angle mapper and change vector analysis to unsupervised change detection in multispectral images. IEEE Geoscience & Remote Sensing Letters, 13(5), 681–685. doi:10.1109/LGRS.2016.2536058
- Zhuang, H., Fan, H., Deng, K., & Yao, G. (2018). A spatial-temporal adaptive neighborhood-based ratio approach for change detection in SAR images. Remote Sensing, 10(8), 1295. doi:10.3390/rs10081295
- Zhuang, H., Fan, H., Deng, K., & Yu, Y. (2018). An improved neighborhood-based ratio approach for change detection in SAR images. European Journal of Remote Sensing, 51(1), 723–738. doi:10.1080/22797254.2018.1482523