
 ?Mathematical formulae have been encoded as MathML and are displayed in this HTML version using MathJax in order to improve their display. Uncheck the box to turn MathJax off. This feature requires Javascript. Click on a formula to zoom.
ABSTRACT
This study analysed the spectral characters of corn grown in metal-spiked soil, and thus to develop a new vegetation index to characterize copper and lead concentrations in corn leaves. The significant correlation between the leaf-metal and the leaf-spectra suggested that the Cu and Pb stress caused the spectra changes in visible and near-infrared ranges. Heavy Metal Stress Vegetation Indices based on the first difference reflectance (dVIs) were established using the characteristic wavelengths. The results of regression models show that the index that combines the first difference reflectance in 497, 632 and 677 nm wavelengths is the best potential indicator of the Cu stress, and the index that combines the first difference reflectance in 456, 668 and 686 nm wavelengths most strongly indicates the Pb stress. In addition, compared with six normal vegetation indices, the proposed dVI has better robustness and effectiveness. This study may provide a theoretical basis for the monitoring of heavy metal stress at corn canopy scale.
Introduction
The sources of heavy metals in the environment are geogenic and factitious. Agricultural soils may become contaminated with heavy metals from industrial and agricultural activities such as mining, wastewater irrigation and the use of mineral (Srivastava et al., Citation2017). High levels of heavy metal concentration may disrupt physiological activities through oxidative tissue damage and negatively influence plant growth (Newete, Erasmus, Weiersbye, Cho, & Byrne, Citation2014). And if these heavy metals pass into the agricultural crops, they threaten animal, human, and environmental health. Therefore, the rapid and effective monitoring of heavy metal pollution in crops is of great significance to environmental protection and food security. Traditional assessment methods of the heavy metal contamination in soils are costly and complex (Hang et al., Citation2009). With the advantages of real-time and rapid observation, remote sensing makes up for the shortcomings of traditional methods, and it has been widely applied to detect the heavy metal concentration in crops.
Various stressors, including heavy metal, result in some changes in spectral reflectance of vegetation, so vegetation indices that indicate the spectral changes are used to evaluate plant stress. Red edge (680–780 nm) is used to detect heavy metal in plants usually. A number of studies had analysed the relationships between red edge-based vegetation indices and heavy metal stress (Amer et al., Citation2017; Clevers, Kooistra, & Salas, Citation2004; Sridhar, Han, Diehl, Monts, & Su, Citation2007; Zhou et al., Citation2018). We reviewed these studies and found that some vegetation indices, such as red-edge position (REP) and normalized difference vegetation index (NDVI), were significantly correlated with the heavy metal concentration of plants. In many studies, these vegetation indices were used to detect spectral changes of vegetation under heavy metal contamination, and evaluate the effect of the heavy metal stress in plants (Asmaryan, Warner, Muradyan, & Nerisyaan, Citation2013; Gotze, Jung, Merbach, Wnnrich, & Glasser, Citation2010; Van Deventer & Cho, Citation2014). Martinez et al. (Citation2015) established a multiple linear regression model based on REP, NDVI and other eight vegetation indices to assess the CsCI stress degree on Arabidopsis thaliana plants. Rathod et al. (Citation2015) pointed out that chlorophyll and water stress indices and band depth were significantly correlated with the arsenic (As) contents in vegetation leaves, which could be used to monitor the heavy metal stress level. Liu, Wang, Skidmore, and Liu (Citation2018) suggested that regional heavy metal stress may be accurately detected using multi-temporal Sentinel-2 images combined with vegetation indices related to red-edge bands. Most of these studies focused on the existing vegetation indices. However, most of these red-edge measurements respond similarly to various biological stress (Sridhar et al., Citation2007). For instance, NDVI is sensitive not only to heavy metal stress but also to changes in cellular structure. Other new indices that relate to heavy metal cases have been proposed, such as the wavelet area and wavelet high-frequency coefficient (Liu, Liu, Cao, Li, & Wu, Citation2011; Wang, Wang, Shi, Wu, & Skidmore, Citation2015). However, besides the complexity of calculation, the selection of wavelet decomposition level has a direct effect on estimate quality, so it is limited for the wavelet transform to be wildly applied in practice.
Therefore, it is imperative to search for spectral changes that relate to the heavy metal contents in plants and develop new indices with simple calculation and good stability. The purpose of the present study is to analyse the spectral characteristics of corn grown in metal-contaminated soil, and thus to develop a simple and feasible index as a sensitive indicator of plant stress.
Materials
Growth experiment design
A pot experiment was performed under controlled conditions in a greenhouse. The treatments included two corn cultivars, and three cultivation periods and two stress agents. Pots (22-cm diam., 20-cm height) were filled with a mixture of 5Kg soil and stress solution. “Minuo No.8” corn seeds were primed on 10 May 2017 and received Cu-stress and Pb-stress treatments: 10 levels of CuSO4•5H2O solutions (0, 50, 100, 150, 200, 300, 400, 600, 800, 1000 μg/g) and 10 levels of Pb(NO3) solutions (0, 50, 100, 150, 200, 300, 400, 600, 800, 1000 μg/g), were added to pots as stressors. The “Zhongnuo No.1” corn seeds were primed on 6 May 2014 and received Cu-stress and Pb-stress treatments: 2 levels of CuSO4•5H2O solutions (0, 250 μg/g) and 3 levels Pb(NO3) solutions (0, 250, 500μg/g). The “Zhongnuo No.1” corn seeds were primed on May 2016 and received Cu-stress treatment: eight levels of CuSO4•5H2O solutions (0, 100, 200, 300, 400, 500, 600, 700 μg/g). For every stress level, there were three parallel experimental pots. During the cultivation, the greenhouse was kept ventilatory, and pots were rotated weekly as to their positions within the greenhouse to avoid the effect of growing condition difference.
Spectral and heavy metal content measurements
Spectral reflectance was measured using a spectrograph (SVC HR-1024I, USA) with a wavelength range of 350–2500 nm, a sampling interval of 1.5 nm between 350 and 1000 nm, and a sampling interval of 3.6 nm between 1000 and 1900 nm and a sampling interval of 2.5 nm between 1900–2900 nm. The spectrometer is equipped with a 1 m long fiber optic sensor with a 25° field of view. To control the atmospheric and illumination conditions, spectral measurement processed in a dark and enclosed room. To provide lighting on the leaf, a 50 W halogen light was placed above the corn leaf. The fibre sensor was positioned ~5 cm above the leaf sample with a 25°field of view (Dunagan, Gilmore, & Varekamp, Citation2007), producing a viewing area of 2 cm in diameter. Reflectance spectra were normalized with a white Spectralon panel (Dunagan et al., Citation2007).
Leaf spectral reflectance measurements were taken on heading-stage leaves. The corn leaves were divided into old (O), middle (M) and new (N) leaves according to their development degrees. The old (O) leaves were leaves at the plant base, and the middle (M) leaves were in the middle part of the plant, and the new (N) leaves were on the plant top. One leaf of each was selected for spectral measurement, and three leaves were sampled per plant. Individual spectral measurement was an average of three scans and each leaf was sampled 3 times and averaged for further analysis (Dunagan et al., Citation2007). The mean value of reflectance of three kinds of the leaf (O, N, M) was taken as the reflectance of the plant in every pot. Finally, spectral measurements ware from a total of 83 group leaf samples. Six mean spectral reflectance from the “Zhongnuo No.1” corn of the Cu case in the year 2014. Nine mean spectral reflectance from the “Zhongnuo No.1” corn of the Pb case in the year 2014. Eight mean spectral reflectance from the “Zhongnuo No.1” corn of the Cu case in the year 2016. Thirty groups of spectral data of O, M, N leaves from the “Minuo No.8” corn of the Cu treatment and the Pb treatment, respectively, in the year 2017.
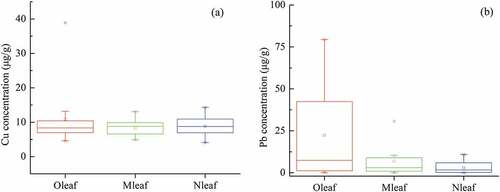
After washing, drying and pulverizing, the samples of corn leaves were packed into the sample bags, then the heavy metal contents in corn leaves were measured using inductively coupled plasma atomic emission spectrometer (ICP-OES, Thermo Fisher Co., USA)(Guo, Yang, Cheng, & Wang, Citation2019). The results of Cu and Pb contents in leaves from “Minuo No.8” corn are shown in .
Figure 1. Heavy metal contents in corn leaves (O, M, N) stressed by different (a) Cu concentrations and (b) Pb concentrations
The data set was divided into two parts, viz.: 70% of the data for calibration included 30 leaf samples for the Cu treatment and 25 leaf samples from the Pb treatment both from “Minuo No.8” corn, and 30% of the data for validation, included eight leaf samples from Cu treatment of “Zhongnuo No.1” corn in 2016 year, six leaf samples from Cu treatment of “Zhongnuo No.1” corn in 2014 year, and five leaf samples from Pb treatment of “Minuo No.8” corn in 2017 year, in addition nine leaf samples from Pb treatment of “Zhongnuo No.1” corn in 2014 year.
Method
Spectral analysis
Spectral data used in the analysis were limited to the visible and very-near-infrared (400–1000 nm) spectral range, because visible rather than infrared reflectance responds most consistently to plant stress (Carter, Citation1994). The first difference spectra were calculated (EquationEquation 1(1)
(1) ; Yoder & Pettigrew-Crosby, Citation1995) since this method eliminates background noise (Aguirre Castro & Garbulsky, Citation2018; Demetriades-Shah, Steven, & Clark, Citation1990).
where is first difference reflectance for one wavelength (λi),
and
are reflectance values for the wavelengths located in the 4 spectral bands above and under the wavelength λi, respectively, i = 1, 2, …, n (the total number of wavelengths).
Sensitive wavelength selection
Sensitive wavelengths for Cu stress
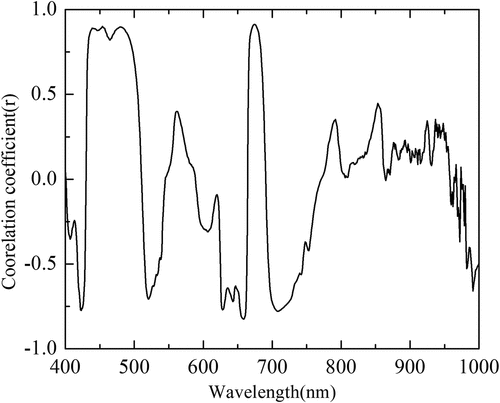
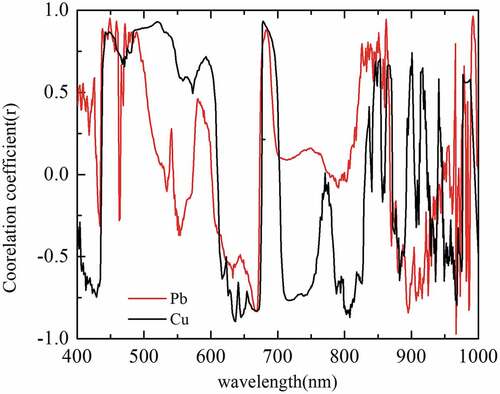
To select stress-sensitive bands based on the calibration data, correlation coefficients (r) were calculated between the foliar Cu concentration and the reflectance and the first difference reflectance across the entire spectrum. Correlation coefficients for the first difference reflectance were generally greater than those for the reflectance, especially in the blue, red and red-edge regions of the spectrum (,). In addition, the shapes of the correlation coefficient curves for the corn leaves of different development degrees were similar. So in order to reduce the error, the mean spectrum of O, M, N leaves of each plant was calculated for further analysis. The correlation coefficients between the first difference reflectance of the mean spectrum of corn plants and the foliar Cu concentration showed significant positive correlation (r > 0.8, p < 0.01) at 450–497 nm and 677 nm wavelengths, and significant negative correlation (|r|>0.7, p < 0.01) at 632 nm wavelength (). So, it can be concluded that these three bands were related to Cu stress and could be used as the sensitive bands to monitor the copper stress.
Figure 2. Correlation coefficients between Cu content in leaves of different development degrees and (a) reflectance and (b) first difference reflectance
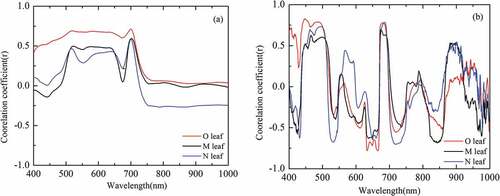
Figure 3. Correlation coefficients between Cu content in leaves of different development degrees and first difference reflectance of the mean spectrum
Sensitive wavelengths for Pb stress
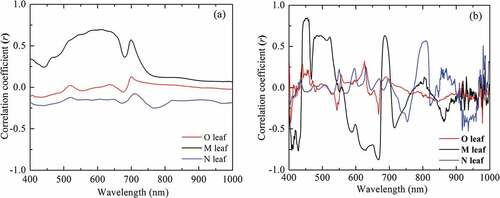
Correlation coefficients (r) between the foliar Pb concentration and the reflectance and the first difference reflectance across the entire spectrum were calculated based on the calibration dataset. The correlation coefficients for the M leaves were generally greater than those for the O and N leaves (,). According to , the small correlation coefficients may be associated with the spectral changes approaching saturation at high Pb contents in O leaves and the weak spectral response at low Pb contents in N leaves. Based on the above analysis, we selected the correlation coefficient curve of M leaves as the basis to screen sensitive bands. The correlation coefficients for M leaves showed significant positive correlations (r > 0.6, p < 0.05) at 450–460 nm and 686 nm wavelengths, and a significant negative correlation (|r|>0.7, p < 0.05) at 668 nm wavelength (). So, it can be concluded that these three bands were related to Pb stress and could be used as sensitive bands to monitor the Pb stress.
Figure 4. Correlation coefficients between Pb content in leaves of different development degrees and (a) reflectance and (b) first difference reflectance
Definition of dVI
In order to make full use of the three characteristic bands and reduce the influence of external factors, according to the theory of combination of band ratios can minimize the effects of spectral convolution (Blackburn, Citation1999; Kong, Huang, Zhou, & Song, Citation2016), the heavy metal stress vegetation index based on the first difference reflectance (dVI) is established as EquationEquation (2)(2)
(2) :
Where is the first difference reflectance for one wavelength (λ). For the Cu stress treatment, λ1 is the wavelengths between 450 and 497 nm, and λ2, λ3 are the wavelengths at 632 nm and 677 nm. For the Pb stress treatment, λ1 is the wavelengths between 450 and 460 nm, and λ2, λ3 are the wavelengths at 668 nm and 686 nm. With different values of λ1, the calculated indices (dVIs) were different, so the dVI corresponding to one wavelength (λ1) was denoted as dVI(λ1).
Each of the dVIs (VIs) generated was regressed against the Cu and Pb and the correlations were evaluated through the coefficient of determination (R2) and the root mean square error (RMSE). ANOVA was used to determine if there were statistical differences in leaf metal concentration among different treatment groups (p < 0.05). Finally, the dVI was compared with several red-edge vegetation indices of the most commonly used in metal detection: NDVI (Rouse, Haas, Schell, & Deering, Citation1974), Red-edge chlorophyll index (CIred-edge) (Gitelson, Keydan, & Merzlyak, Citation2006), red edge position (REP) (Guyot & Baret, Citation1988), MERIS terrestrial chlorophyll index (MTCI) of Dash and Curran (Citation2004), photochemical reflectance index (PRI) of Gamon, Peñuelas, and Field (Citation1992), ratios of leaf reflectances (R695/R420) of Carter (Citation1994) and Wavelet-Based Area (Swt(605–720)) (Wang et al., Citation2015).
Results
Validation on sensitive bands
The correlation coefficients between Cu, Pb contents in leaves and the first difference reflectance across the entire spectrum (validation dataset) are shown in . For the Cu concentration, the correlation coefficients still showed significant correlations (|r|>0.65, p < 0.05) at 450 ~ 497 nm, 632 nm and 677 nm wavelengths (). For the Pb concentration, the correlation coefficients showed significant correlations (r > 0.85, p < 0.05) at 450–451 nm and 458–460 nm and 682 nm wavelengths (). The above results demonstrate that the wavelength position of bands sensitive to heavy metal stress remained steady and invariable for the different datasets.
Figure 5. Correlation coefficients of the first difference reflectance and heavy metal contents in leaves under (a) Cu stress and (b) Pb stress
Correlations between dVIs and leaf metal concentrations
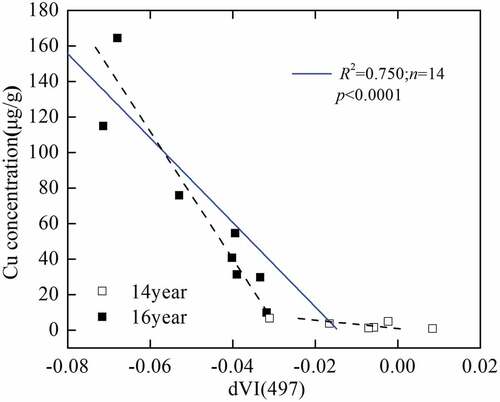
The regression results were sorted in descending order of R2 values, and the top 10% for the Cu stress treatment and the top 50% for the Pb stress treatment are shown in and . For both calibration and validation datasets of the Cu group, the dVI (497) was found to be the best indicator of Cu concentration. This index showed the highest R2 value and lowest RMSE for both datasets. shows the fitting results of dVI (497) and copper contents based on “Zhongnuo No.1” datasets from the years 2014 and 2016. The dVI (497) was significantly correlated with Cu. The R2 value was 0.750, p < 0.0001. The results demonstrate that dVI(497) is stable and effective in different cultivation periods.
Table 1. Results of regression analysis of dVI and heavy metal content in corn leaves under Cu case
Table 2. Results of regression analysis of dVI and heavy metal content in corn leaves under Pb case
Figure 6. Results of regression analysis of dVI and heavy metal contents in leaves under the Cu case from “Zhongnuo No.1” corn in the years 2014 2016
For the calibration dataset of Pb stress group, dVI(451) explained 64% of Pb concentration variations, but it explained little for the validation dataset (p > 0.05). The dVI(456) was found to be a significant indicator (p < 0.05) for both tow datasets of the Pb stress group. This index explained 60% and 80% of Pb concentration variations for calibration and validation datasets, respectively.
Comparisons between dVI and other vegetation indices
In this section, in order to demonstrate that dVI(497) and dVI(456) were better Cu and Pb indicators, respectively, we selected six vegetation indices () sensitive to heavy metal and compared with dVI proposed in this research. For the validation dataset of Cu case, just SIPI explained more than 60% of the Cu concentration variations (). The REP was the best Cu indicator among the six mentioned indices. However, this index had lower R2cal values (R2cal = 0.707) and higher RMSE than dVI(497) (R2val = 0.793 and RMSE = 0.013). For the Pb stress group, none of the six vegetation indices was sensitive to Pb stress (R2 < 0.6) ().
Table 3. Results of regression of published indices and heavy metal content in the corn leaves under the Cu case and Pb case
To further demonstrate that the dVI(456) has an advantage over other vegetation indices, we also applied dVI(456) on leaves data from the Pb treatment of “Zhongnuo No.1” corn in the year 2014. The Pb contents and spectral reflectance are not from M leaf, but an average of the data from O leaves and M leaves and N leaves. The dVI(456) is developed for M leaves, so the Pearson correlation coefficient (r) between the Pb contents in plant leaves and dVI(456) is low (r = 0.6)(). However, compared with the regular VIs, the dVI(456) has a higher value of Pearson correlation coefficient.
Table 4. The absolute value of Pearson correlation coefficient (r) between Pb contents in leaves and VIs (“Zhongnuo No.1” corn in the year 2014)
Discussion and conclusions
The wavebands at red-edge region were significantly correlated with a heavy metal concentration in leaves. As reported by Kanke, red edge provides key information on vegetation state (Kanke, Tubaña, Dalen, & Harrell, Citation2016). All treatment showed similar behaviour in red-edge region, with positive correlated coefficients at 677 nm and 686 nm for the Cu case and the Pb case, respectively. Previous studies, e.g. Sridhar et al. (Citation2007), suggested that the wavelength in red-edge region at 680 nm was related to strong absorption of chlorophyll. Moreover, the wavelengths at 489–497 nm and 632 nm showed a significant correlation with Cu stress. Wavelengths at 450 ~ 460 nm and 668 nm were correlated with the Pb stress. Dunagan et al. (Citation2007) showed that the wavelength in 450 nm was sensitive to chlorophylls and the wavelength in 700 nm was correlated with foliar Hg content.
A stable and simple-calculation index was developed to monitor the Cu and Pb concentration in leaves. For the Cu case, the best index combined the first difference reflectance in 497 nm, 632 nm and 677 nm (). For the Pb case, the index combining the first difference reflectance in 456 nm, 668 nm and 686 nm (
) was the best indicator. The best published indices selected for this study to characterize Cu stress were REP. In comparison with the proposed dVI(497), REP generated reduction in R2 value. For the Pb case, none of the published indices performed well.
The findings from this study indicated that the metal concentration made the main contribution on changes of spectral reflectance, while no effect of leaf’ development degree on the spectrum was observed in this study. There was no difference in the Cu contents for leaves of different development stages. However, the Pb contents in three kinds of leaves varied greatly, which resulted in a different spectral response to the Pb case. Thus, the results demonstrate that the corn leaves have a higher accumulation ability of Pb than that of Cu.
The development of dVI was based on corn-leaf spectra, which means that the metal stress of corn could only be monitored at the leaf scale. Moreover, dVI(456) has more limited application and appears to be suitable only to identify Pb differences in M leaves of corn. Further study should focus on monitoring metal stress of corn at the canopy scale.
Acknowledgments
This work was supported by the National Natural Science Foundation of China (41971401), and the State Key Laboratory of Coal Resources and Safe Mining 2017 Open Foundation (SKLCRSM17KFA09); and the National Natural Science Foundation of China (41271436); and the Fundamental Research Funds for the Central Universities (2009QD02). We thank the Institute of Plant Nutrition and Resources, Beijing Academy of Agriculture and Forestry Sciences for metal content analysis and test.
Disclosure statement
No potential conflict of interest was reported by the authors.
Additional information
Funding
References
- Aguirre Castro, P., & Garbulsky, M.F. (2018). Spectral normalized indices related with forage quality in temperate grasses: Scaling up from leaves to canopies. International Journal of Remote Sensing, 39(10), 3138–3163. doi:10.1080/01431161.2018.1430394
- Amer, M., Tyler, A., Fouda, T., Hunter, P., Elmetwalli, A., Wilson, C., & Vallejo-Marin, M. (2017). Spectral characteristics for estimation heavy metals accumulation in wheat plants and grain. Scientific Papers Series: Management, Economic Engineering and Rural Development, 17(3), 47–55. http://hdl.handle.net/1893/26619
- Asmaryan, S., Warner, T.A., Muradyan, V., & Nerisyaan, G. (2013). Mapping tree stress associated with urban pollution using the WorldView-2 Red Edge band. Remote Sensing Letters, 4(2), 200–209. doi:10.1080/2150704X.2012.715771
- Blackburn, G.A. (1999). Relationships between spectral reflectance and pigment concentrations in stacks of deciduous broadleaves. Remote Sensing of Environment, 70(2), 224–237. doi:10.1016/S0034-4257(99)00048-6
- Carter, G.A. (1994). Ratios of leaf reflectance in narrow wavebands as indicators of plant stress. International Journal of Remote Sensing, 15(3), 697–703. doi:10.1080/01431169408954109
- Clevers, J.G.P.W., Kooistra, L., & Salas, E.A.L. (2004). Study of heavy metal contamination in river floodplains using the red–Edge position in spectroscopic data. International Journal of Remote Sensing, 25(19), 3883–3895. doi:10.1080/01431160310001654473
- Dash, J., & Curran, P.J. (2004) MTCI: The MERIS terrestrial chlorophyll index. In MERIS User Workshop, 1–11. Frascati, Italy.
- Demetriades-Shah, T.H., Steven, M.D., & Clark, J.A. (1990). High resolution derivative spectra in remote sensing. Remote Sensing of Environment, 33(1), 55–64. doi:10.1016/0034-4257(90)90055-Q
- Dunagan, S.C., Gilmore, M.S., & Varekamp, J.C. (2007). Effects of mercury on visible/near-infrared reflectance spectra of mustard spinach plants (Brassica rapa P.). Environmental Pollution, 148(1), 0–311. doi:10.1016/j.envpol.2006.10.023
- Gamon, J.A., Peñuelas, J., & Field, C.B. (1992). A narrow-waveband spectral index that tracks diurnal changes in photosynthetic efficiency. Remote Sensing of Environment, 41(1), 35–44. doi:10.1016/0034-4257(92)90059-S
- Gitelson, A.A., Keydan, G.P., & Merzlyak, M.N. (2006). Three‐band model for noninvasive estimation of chlorophyll, carotenoids, and anthocyanin contents in higher plant leaves. Geophysical Research Letters, 33(11), 431–433. doi:10.1029/2006GL026457
- Gotze, C., Jung, A., Merbach, I., Wnnrich, R., & Glasser, C. (2010). Spectrometric analyses in comparison to the physiological condition of heavy metal stressed floodplain vegetation in a standardised experiment. Central European Journal of Geosciences, 2(2), 132–137. doi:10.2478/v10085-010-0002-y
- Guo, H., Yang, K., Cheng, L., & Wang, M. (2019). Using the characteristic parameters of Hilbert marginal spectrum for indirectly estimating copper content in maize leaves under copper stress. Remote Sensing Letters, 10(11), 1067–1076. doi:10.1080/2150704X.2019.1646932
- Guyot, G., & Baret, F. (1988). Utilisation de la haute resolution spectrale pour suivre l’etat des couverts vegetaux. Spectral Signatures of Objects in Remote Sensing, 287, 279–286. European Space Agency, Nordwijk. http://adsabs.harvard.edu/full/1988esasp.287.279g
- Hang, X., Wang, H., Zhou, J., Ma, C., Du, C., & Chen, X. (2009). - Risk assessment of potentially toxic element pollution in soils and rice (Oryza Sativa) in a typical area of the Yangtze River Delta. Environmental Pollution, 157(8–9), 2542–2549. doi:10.1016/j.envpol.2009.03.002
- Kanke, Y., Tubaña, B., Dalen, M., & Harrell, D. (2016). Evaluation of red and red-edge reflectance-based vegetation indices for rice biomass and grain yield prediction models in paddy fields. Precision Agriculture, 17(5), 507–530. doi:10.1007/s11119-016-9433-1
- Kong, W., Huang, W., Zhou, X., & Song, X. (2016). Estimation of carotenoid content at the canopy scale using the carotenoid triangle ratio index from\r, in situ\r, and simulated hyperspectral data. Journal of Applied Remote Sensing, 10(2), 026035. doi:10.1117/1.JRS.10.026035
- Liu, M., Liu, X., Cao, S., Li, T., & Wu, L. (2011). Assessment of Pb-induced stress levels on rice based on fractal characteristic of spectral high-frequency components. Journal of Remote Sensing, 15(4), 811–830. doi:10.11834/jrs.20110142
- Liu, M., Wang, T., Skidmore, A.K., & Liu, X. (2018). Heavy metal-induced stress in rice crops detected using multi-temporal Sentinel-2 satellite images. Science of the Total Environment, 637–638, 18–29. doi:10.1016/j.scitotenv.2018.04.415
- Martinez, N.E., Sharp, J.L., Kuhne, W.W., Johnson, T.E., Stafford, C.T., & Duff, M.C. (2015). Assessing the use of reflectance spectroscopy in determining CsCl stress in the model species Arabidopsis thaliana. International Journal of Remote Sensing, 36(23), 5887–5915. doi:10.1080/01431161.2015.1110258
- Newete, S.W., Erasmus, B.F.N., Weiersbye, I.M., Cho, M.A., & Byrne, M.J. (2014). Hyperspectral reflectance features of water hyacinth growing under feeding stresses of Neochetina spp. and different heavy metal pollutants. International Journal of Remote Sensing, 35(3), 799–817. doi:10.1080/01431161.2013.873145
- Rathod, P.H., Brackhage, C., Van Der Meer, F.D., Mueller, I., Noomen, M.F., Rossiter, D.G., & Dudel, G.E. (2015). Spectral changes in the leaves of barley plant due to phytoremediation of metals—Results from a pot study. European Journal of Remote Sensing, 48(1), 283–302. doi:10.5721/EuJRS20154816
- Rouse, J.W.J., Haas, H.R., Schell, J.A., & Deering, D.W. (1974). Monitoring vegetation systems in the great plains with ERTS. Nasa Special Publication, 351: 309. In 3th Earth Resources Technology Satellite-1 Symposium (S.C. Freden, E.P. Mercanti, & M. Becker, edited by, 309–317). Washington, DC: National Aeronautics and Space Administration (NASA SP-351).
- Sridhar, B.B.M., Han, F.X., Diehl, S.V., Monts, D.L., & Su, Y. (2007). Spectral reflectance and leaf internal structure changes of barley plants due to phytoextraction of zinc and cadmium. International Journal of Remote Sensing, 28(5), 1041–1054. doi:10.1080/01431160500075832
- Srivastava, V., Sarkar, A., Singh, S., Singh, P., Araujo, A.A., & Singh, R.P. (2017). Agroecological responses of heavy metal pollution with special emphasis on soil health and plant performances. Frontiers in Environmental Science, 5, 64. doi:10.3389/fenvs.2017.00064
- Van Deventer, H., & Cho, M.A. (2014). Assessing leaf spectral properties of Phragmites australis impacted by acid mine drainage. South African Journal of Science, 110(7–8), 1–12. doi:10.1590/sajs.2014/20130184
- Wang, J., Wang, T., Shi, T., Wu, G., & Skidmore, A.K. (2015). A wavelet-based area parameter for indirectly estimating copper concentration in carex leaves from canopy reflectance. Remote Sensing, 7(11), 15340–15360. doi:10.3390/rs71115340
- Yoder, B.J., & Pettigrew-Crosby, R.E. (1995). Predicting nitrogen and chlorophyll content and concentrations from reflectance spectra (400–2500 nm) at leaf and canopy scales. Remote Sensing of Environment, 53, 199–211. doi:10.1016/0034-4257(95)00135-N
- Zhou, C., Chen, S.B., Zhang, Y.Z., Zhao, G.H., Song, D.R., & Liu, D.W. (2018). Evaluating metal effects on the reflectance spectra of plant leaves during different seasons in post-mining areas. Remote Sensing, 10(8), 1211. doi:10.3390/rs10081211