
 ?Mathematical formulae have been encoded as MathML and are displayed in this HTML version using MathJax in order to improve their display. Uncheck the box to turn MathJax off. This feature requires Javascript. Click on a formula to zoom.
ABSTRACT
Change detection from multi-temporal remote sensing images is an effective way to identify the burned areas after forest fires. However, the complex image scenario and the similar spectral signatures in multispectral bands may lead to many false positive errors, which make it difficult to exact the burned areas accurately. In this paper, a novel-burned area change detection approach is proposed. It is designed based on a new Normalized Burn Ratio-SWIR (NBRSWIR) index and an automatic thresholding algorithm. The effectiveness of the proposed approach is validated on three Landsat-8 data sets presenting various fire disaster events worldwide. Compared to eight index-based detection methods that developed in the literature, the proposed approach has the best performance in terms of class separability (2.49, 1.74 and 2.06) and accuracy (98.93%, 98.57% and 99.51%) in detecting the burned areas. Simultaneously, it can also better suppress the complex irrelevant changes in the background.
Introduction
As one of the major natural disasters, wildfires often lead to ecosystem imbalance and local structural damages. From WWF’s point of view, the extent of burned areas increased dramatically in recent years in regions such as the western United States, southeast Australia and Europe (Hirschberger, Citation2016). More communities should focus on the increasing fire risk to prevent deadly threats. Accordingly, more accurate and real-time data should be acquired, and more advanced techniques should be designed to monitor wildfires.
Traditional ground surveys are often difficult and costly to carry out due to many limitations such as complex terrain morphology, large scene and bad weather conditions; in particular, in the burned area detection case this task is almost impossible. Remote sensing satellites are able to quickly locate fire spots by analyzing multitemporal remote sensing images covering the fire scenario. In the past decades, extensive studies have been carried out on the detection of the burned areas (Quintano et al., Citation2018; Teodoro & Amaral, Citation2019). High temporal resolution satellite images such as EOS/MODIS and NOAA/AVHRR are widely utilized to identify fire spots and to produce coarse fire maps. However, they cannot accurately depict the burned areas and their temporal changes due to their low spatial resolution. Medium-resolution satellites such as Landsat series greatly improve the capability to detect the burned areas at a finer scale (i.e. with spatial resolution of 30 m). The latest Landsat-8 OLI sensor can acquire multispectral images covering several spectral wavelength ranges, where the near-infrared (NIR) band (0.85–0.88 μm) and two short wave infrared (SWIR) bands (1.57–1.65 μm and 2.11–2.29 μm) are quite often used in burned areas identification. A variety of methods have been employed for burned area detection including spectral indices (Tucker, Citation1979), surface temperature inversion (Mukherjee et al., Citation2018), Principal Component Analysis (PCA) (Richards, Citation1984), images classification (Mitri & Gitas, Citation2004), neural network (Gómez & Martín, Citation2011) and spectral mixture analysis (Smith et al., Citation2007). Spectral features are more intuitive and effective in identifying different land-cover objects, thus the spectral index-based method becomes popular in burned area detection due to its simple implementation and high accuracy.
In particular, there are mainly two kinds of spectral indices that can be used for burned area detection, including vegetation index and fire index. Since the forest fires have occurred with the vegetation changes (loss of trees), the distinction between burned and unburned areas can be achieved by some vegetation indices, such as Normalized Difference Vegetation Index (NDVI) (Tucker, Citation1979), Global Environmental Monitoring Index (GEMI) (Pinty & Verstraete, Citation1992), among others. Many fire indices were specifically designed based on carbon signal and the temperature after the burning of land-cover features. The post-fire spectral signal will lead to a rapid increase and decrease in the reflectance of SWIR and NIR, respectively. Based on this theory, the Normalized Burned Ratio (NBR) (García & Caselles, Citation1991), the Normalized Difference SWIR (NDSWIR) (Gerard et al., Citation2003) and the Burning Area Index (BAI) (Martín & Chuvieco, Citation1998) fire indices were designed to detect the burned areas. Some researchers found that the combination of the SWIR bands showed a strong spectral separation on burned and unburned areas. Therefore, the mid-infrared bi-spectral index (MIRBI) (Trigg & Flasse, Citation2001) was designed with these bands. Moreover, burned areas could show a temperature of 5–6°C higher than unburned areas within 1 month after burning (García & Caselles, Citation1991); thus, the thermal infrared (TIR) bands usually are utilized to detect the burned areas during the fire occurrence period. Both the NBR-Thermal (NBRT) (Smith et al., Citation2007) and the NIR-SWIR Temperature Version 2 (NSTV2) (Veraverbeke et al., Citation2011) indices introduce the bright temperature (BT) obtained by the TIR band to improve the fire detection accuracy. However, these indices only consider the abrupt changes such as vegetation to burned area, low temperature to high temperature, while interferences coming from other land-cover changes are ignored. This will lead to an increase of false positive errors in the burned area detection.
The current existing vegetation spectral indices can reflect the burned area changes due to the vegetation decrease in the pre-fire and post-fire images. Nevertheless, it should be noted that other land-cover features might have similar spectral behaviours in some specific bands such as NIR and SWIR bands. This will lead to an increase in commission errors in the background. In order to overcome this limitation and improve the performance of burned area detection, a burned area change detection (CD) approach based on a new fire index named Normalized Burned Ratio SWIR (NBRSWIR) is proposed. In particular, the designed new index takes advantages of two SWIR bands in Landsat-8 OLI data. It can increase the spectral separability of burned and unburned areas, while it is capable to suppress the background information such as water, outperforming other indices. It is worth noting that the proposed approach is useful and effective for automatic burned area detection in multitemporal images without relying on any ground reference data.
Data and methodology
Data and preprocessing
Considering the land coverage complexity, processing difficulty and data availability, three data sets presenting wildfire events were selected, including the Sockeye Fire (SF), the Sampson Flat Fire (SFF) and the Grampians National Park Fire (GNPF). In particular, the SF was located in Alaska, USA, and the wildfire broke out on 14 June 2015. The combination of dry, hot weather and strong winds contributed to a rapid spread of the fire and generated a lot of smoke. The SFF occurred in Adelaide, Australia. On 2 January 2015, the hot weather and strong wind ignited the fire and over 120 square kilometres of forest burned until 7 January. On 15 January 2014, lightning sparked a brushfire in the Grampians National Park of southeast Australia and sparked many small fire spots.
For the three data sets used in the experiments, the Level-1 C products of Landsat-8 OLI data with 30 m spatial resolution were downloaded from the U.S. Geological Survey (USGS) website (https://earthexplorer.usgs.gov/). Radiometric and atmospheric corrections were carried out by using the ENVI software. shows the detailed information of the three bi-temporal image pairs including both the before- and after-fire images.
Table 1. Characteristics of the three Landsat-8 OLI data sets and the change reference (CR) maps
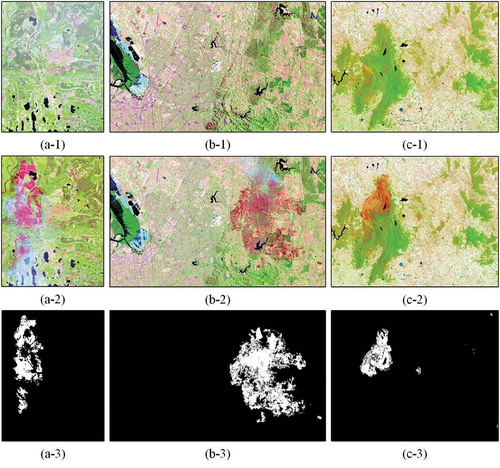
Bi-temporal images of the three data sets (i.e. SF, SFF and GNPF) are presented in ), respectively. The burned areas are shown in dark red (see row 2) in the after-fire images and in white in the change reference (CR) images (see row 3). The CR images were produced through careful visual interpretation and multitemporal comparison.
Figure 1. False-colour composite (7, 5, 4 bands) of the bi-temporal-burned images acquired by Landsat-8 OLI sensor. First row: before-fire images; second row: after-fire images (burned images), and third row: the corresponding CR images. Columns (a–c) represent the SF, SFF and GNPF three data sets, respectively
Change detection methods for burned area detection
Taking into account accuracy and efficiency, spectral index-based methods represent the most popular and applicable group of methods for extracting burned areas (Veraverbeke et al., Citation2011). Indices applied to burned area extraction included single date and bi-temporal approaches (Epting et al., Citation2005). The former identifies the burned areas in the post-fire image. Although it is less time consuming, it is always difficult to correctly separate different land-cover classes especially for those having highly spectral similarity in specific spectral wavelength ranges (i.e. senescent vegetation) (Koutsias et al., Citation1999; Pereira, Citation1999). Compared with the single date approach, the bi-temporal CD method can eliminate irrelevant land-cover features, but also increases the contrast between the unchanged background (unburned areas) and the change target (burned areas) towards the temporal difference. Hence, the latter is more suitable for detecting burned area changes especially from the unsupervised point of view.
Burned area CD methods based on typical indices
Constructing a suitable index is the key to implement the index-based CD methods for burned area detection (Liu et al., Citation2019). To this end, we analysed in detail the spectral signatures of several typical land-cover features from different data sets (see ). The most significant spectral difference between the forestland and burned areas appears in the NIR (0.87 μm) and SWIR2 (2.2 μm) bands (see ). In NIR, the reflectance of forestland reaches the peak and far over the burned area. After that, it decreases rapidly and much lower than the burned area in SWIR2 band. The burned areas have the opposite behaviour with forestland in NIR and SWIR (see the black lines in )), but this theory neglects other land-cover types with the similar change (i.e. water, smoke and bareland) as the burned area.
Figure 2. Spectral curves of typical land-cover classes on the (a) SF, (b) SFF and (c) GNPF data sets and the spectral curve of water from the (d) USGS digital spectral library
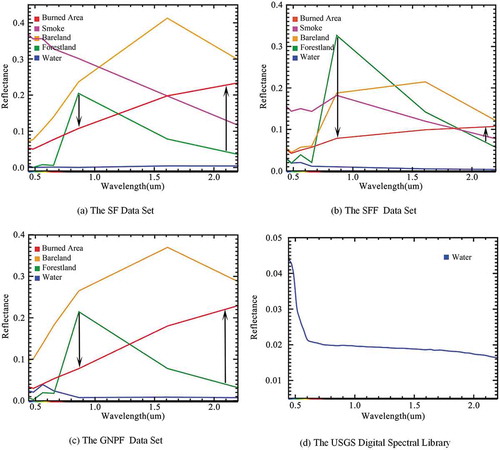
After experiments carried out by using the NDVI, GEMI, NBR, BAI, NDSWIR, NBRT and NSTV2 indices (see ), the obtained results showed that many commission errors were generated due to wrongly detection in water, smoke and other features. This may be caused by the following reasons: (1) Existing spectral indices consider the changes between forestland and burned areas whereas ignoring the irrelevant background changes (e.g. forestland changed into bareland); (2) The reflectivity of water is very low (almost 0) throughout the whole spectrum range. Therefore, the magnitude of the water is much lower than any other class (usually lower 10−1). When performing the band ratio operation, a small value in the numerator will amplify the water pixels.
Table 2. Popular spectral indices used for fire detection
Proposed burned area CD method based on the new-designed fire index
Comparing the average spectral curves of irrelevant land-cover features with burned areas in ), we can see that: (1) The reflectance values of burned areas increase in the wavelength range of 0.45–2.35 μm; (2) These typical features such as forestland and bareland decrease within the wavelength range of 1.57–2.29 μm; (3) The reflectance of water is close to 0 in the whole spectral range. The standard spectrum of water (obtained from the USGS digital spectral library) within the wavelength range of Landsat-8 OLI is illustrated in . A decreasing trend of the water reflectance is clearly shown. Especially for the SWIR wavelength range (1.57–2.29 μm), the reflectance values are below 0.02. To further validate this, we manually selected different waterbodies as ROIs (Regions of Interest) on three data sets: the statistics are provided in . As one can see, the reflectance values of water are all lower than 0.02 except for the maximum value of the SWIR1 band on the SF study area. Besides, in the whole Landsat-8 multispectral range, the reflectivity value of water is lower than 0.1, whereas other land-cover features are basically higher than 0.1. Therefore, from the above observations, we can conclude that spectral reflectance values of other land-cover features are at least one order of magnitude higher than water (see ).
Table 3. Water reflection value on three data sets
Based on the above important observations, a new fire index NBRSWIR is proposed to identify the burned areas while separating them from other irrelevant classes and suppressing the water. This index utilizes two SWIR bands (SWIR1 and SWIR2) of Landsat-8 OLI. First, in the numerator, the constant value of 0.02 is subtracted in order to set the changes in water close to zero or even negative. Second, a decimal 0.1 (the minimum threshold) is added in the denominator, in order to avoid the positive amplification of some abnormal water changes. These two small constants will not largely impact on other land-cover features when considering the differencing ratio formulation.
Let I1 and I2 be the index maps generated on before-fire and after-fire images, respectively. The difference image dI can be computed to represent the significant changes occurred on the bi-temporal images that are associated with the burned area changes.
Then, the “maximum between-class variance” algorithm (Otsu algorithm; Otsu, Citation1979) is adopted to extract the binary CD result, assuming that the difference image has L grey levels [1, 2, …, L]. According to the Otsu algorithm, the image can be divided into the burned and unburned area classes by a threshold t (1 < t < L). The between-class variance g is defined as:
where wb and wnb represent the proportions of burned and unburned areas. μb and μnb are the mean values for two class samples. The optimal threshold T maximizing the interclass variance is estimated by an iterative process (Otsu, Citation1979):
Finally, the difference image is segmented by T to generate the binary CD result.
Quantitative analysis methods
For a comparison purpose, the proposed new fire index NBRSWIR is compared with other eight popular spectral indices (see ), including: (1) vegetation indices: NDVI and GEMI; (2) fire indices: NBR, BAI, NDSWIR, MIRBI, NBRT and NSTV2 (Epting et al., Citation2005; Lozano et al., Citation2007; Veraverbeke et al., Citation2011). For an objective evaluation, two quantitative methods are implemented. First, the separation index (SI) (Kaufman & Remer, Citation1994) is used to evaluate the separation ability of two classes in the difference map, which is defined as:
where μf (μnf ) and σf (σnf ) are the mean value and standard deviation value for burn (unburned) area samples. Higher SI values show better separation between two classes (Lasaponara, Citation2006). Note that burned and unburned samples are randomly generated according to the CR images (see ).
Table 4. Sample on three data sets
Furthermore, an assessment based on the confusion matrix is carried out to evaluate the detection accuracy of the burned areas by using different index-based CD approaches. Five indicators: Overall Accuracy (OA), Kappa Coefficient (K), Commission Error (CE), Omission Error (OE) and Total Error (TE) are calculated to analyse in detail the detection performance.
Results and discussion
Qualitative analysis
Qualitative analysis was made by visually comparing different spectral difference image dI based on the proposed and the reference indices. In particular, NBRSWIR, MIRBI, NBR, NBRT and NSTV2 indices with the highest CD accuracies are analysed in detail (more details could be found in the next subsection).
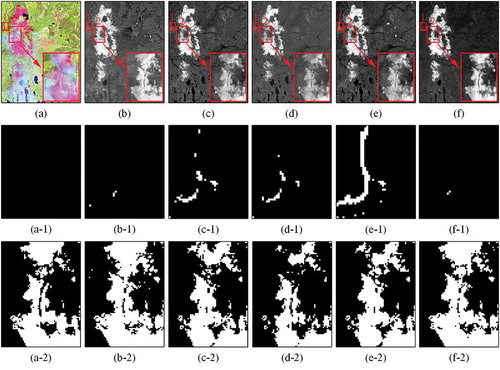
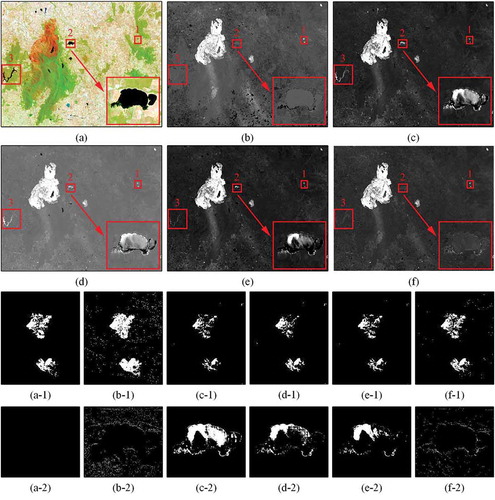
shows the comparison of five spectral index difference maps and their binary detection results at local scale on the SF data set. The red area in the original image (see ) is the largest burned area and that produced the heavy smoke. In this fire scenario, many small waterbodies were randomly distributed. For instance, the highlighted subset 2 (see row 1) is a burned area affected by the smoke. The NBR, NBRT and NSTV2 difference maps display a lower grayscale contrast. So a large number of pixels were not discriminated in the CD results (see ). Moreover, these difference maps also present a high intensity in the river (see the subset 2 in row 1), which led to many commission errors in the final CD results (see ). Compared with other indices, the global contrast of the NBRSWIR difference map (see ) is more significant. By taking advantages of the proposed index, the enhancement of burned area reduced the omission errors (see ), and the good suppression on the water decreased the commission pixels (see ).
Figure 3. The spectral index difference maps and their binary detection results at local scale on the SF data set. (a) Original image (7, 5, 4 bands); (b) MIRBI; (c) NBR; (d) NBRT; (e) NSTV2; (f) NBRSWIR, where row 1 represents the difference maps, row 2 and row 3 represent the two local binary detection results of a river (subset 1) and an enlarged burned area (subset 2)
The post-fire image on the SFF data set was about a year after the pre-fire image. Such large temporal difference leads to more complex and new land-cover changes occurred in the unburned background (e.g. vegetation to bareland). In , subset 1 is a salt field close to the seaside, subset 2 represents a reservoir. According to the difference maps based on MIRBI, NBR, NBRT and NSTV2, many pixels associated with these two subsets showed high change values as the burned areas (see ). This leads to numerous commission errors in the final CD results as shown in . However, the proposed NBRSWIR resulted in better performance with the advantages to suppress those false alarms as can be seen in ).
Figure 4. The spectral index difference maps and their binary detection results at local scale on the SFF data set. (a) Original image (7, 5, 4 bands); (b) MIRBI; (c) NBR; (d) NBRT; (e) NSTV2; (f) NBRSWIR, where rows 1–2 represent the difference maps, row 3 and row 4 represent the two local binary detection results of a salt field (subset 1) and a reservoir (subset 2)
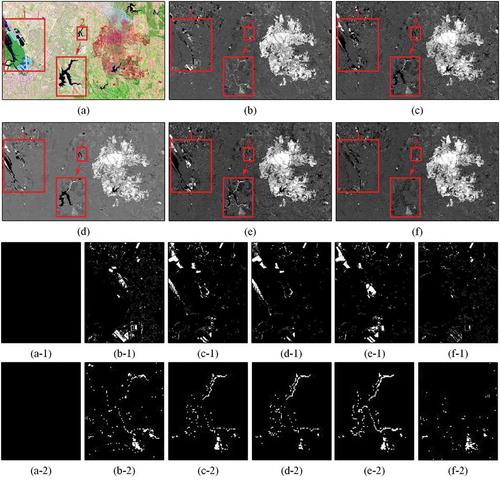
On the GNPF data set, subsets 1–3 (see ) represent an enlarged burned area and two waterbodies, respectively. In the reference indices, difference maps and their subset CD results, false alarms occurred on the water areas were more serious than in the proposed approach, which can be seen in row 3. There are also more omission errors for the burned areas in reference index-based methods when comparing with the NBRSWIR CD result in row 4.
Figure 5. The spectral index difference maps and their binary detection results at local scale on the GNPF data set. (a) Original image (7, 5, 4 bands); (b) MIRBI; (c) NBR; (d) NBRT; (e) NSTV2; (f) NBRSWIR, where rows 1–2 represent the difference maps, row 3 and row 4 represent the local binary detection results of a small-burned area (subset 1) and a lake (subset 2). The subset 3 represents a reservoir in rows 1–2
From the above visual evaluations on the three data sets, we can see that the difference map and binary CD result obtained by NBRSWIR can provide a more satisfactory result than the other reference methods.
Quantitative analysis
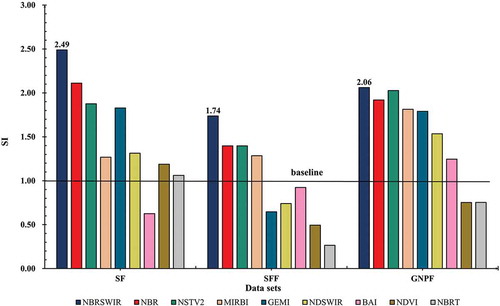
Regarding the quantitative analysis, the separation between burned and unburned areas in different index difference maps is first evaluated. More significant is the separability and more accurate burned areas are expected to be extracted in the next binary detection step. As shown in , different index difference maps have different separability performances. In general, the fire indices performed better than the vegetation indices in terms of general higher separability values. Among all indices, the proposed NBRSWIR outperformed all the others with the highest SI values equal to 2.49, 1.74 and 2.06 in three data sets, respectively.
Figure 6. SI results of burned and unburned areas based on different index maps on three data sets
The numeric detection accuracy results are provided in . For SF and SFF data sets, the proposed method achieves the highest performance with OA values equal to 98.93% and 98.57%, respectively. For the GNPF data set, the accuracies of NSTV2 and the proposed NBRSWIR are quite similar. NSTV2 is just slightly higher in terms of OA values than the NBRSWIR (99.52% compared to 99.51%), but with more than 10000 pixels omission error respect to the proposed NBRSWIR.
Table 5. The accuracy evaluation of the detection results on three data sets
To sum up, experimental results obtained on all data sets confirmed that the NBRSWIR CD method has its clear advantages in burned areas detection. Then followed by the typical fire index-based CD methods including the NBR, NSTV2, NBRT, MIRBI and NDSWIR. The two vegetation indices (GEMI, NDVI) show poor accuracy on the three data sets analysed, which indicates that the vegetation indices may not be suitable for burned area detection in practical applications at a fine level.
Conclusions
In this paper, a novel-burned area change detection method based on the design of a new fire index (i.e. NBRSWIR) for Landsat-8 OLI has been proposed. Its aim is to extract the burned area in a more accurate and automatic way. The obtained experimental results on three real bi-temporal Landsat-8 OLI data sets confirmed that the proposed approach outperforms the other index-based CD methods. In particular, it is more effective to enhance the burned area from the temporal change point of view and to implement an unsupervised detection without relying on the ground truth, and can as well suppress the other land-cover features such as waterbodies, the smoke and the salt field. For future developments, the spectral-spatial joint approach will be carefully analyzed in order to highlight the burned changed areas and further suppress the irrelevant background changes. In addition, multitemporal Sentinel-2 data (with two SWIR bands, 11 and 12) will also be considered to detect burned areas with its higher spatial and temporal resolution and as complement of the Landsat mission.
Disclosure Statement
No potential conflict of interest was reported by the authors.
Correction Statement
This article has been republished with minor changes. These changes do not impact the academic content of the article.
Additional information
Funding
References
- Epting, J. , Verbyla, D. , & Sorbel, B. (2005). Evaluation of remotely sensed indices for assessing burn severity in interior Alaska using Landsat TM and ETM+. Remote Sensing of Environment , 96(3), 328–339. https://doi.org/10.1016/j.rse.2005.03.002
- García, M.J.L. , & Caselles, V. (1991). Mapping burns and natural reforestation using thematic mapper data. Geocarto International , 6(1), 31–37. https://doi.org/10.1080/10106049109354290
- Gerard, F. , Plummer, S. , Wadsworth, R. , Sanfeliu, A.F. , Iliffe, L. , Balzter, H. , & Wyatt, B. (2003). Forest fire scar detection in the boreal forest with multitemporal spot-vegetation data. IEEE Transactions on Geoscience and Remote Sensing , 41(11), 2575–2585. https://doi.org/10.1109/TGRS.2003.819190
- Gómez, I. , & Martín, M.P. (2011). Prototyping an artificial neural network for burned area mapping on a regional scale in Mediterranean areas using MODIS images. International Journal of Applied Earth Observation and Geoinformation , 13(5), 741–752. https://doi.org/10.1016/j.jag.2011.05.002
- Hirschberger, P. 2016. Forests ablaze: Causes and effects of global forest fires. WWF Deutschland: Berlin, Germany, 5-7.
- Kaufman, Y. J , & Remer, L. A. (1994). Detection of forests using mid-ir reflectance: an application for aerosol studies. Ieee Transactions on Geoscience and Remote Sensing , 32(3), 672–683. doi:10.1109/36.297984
- Koutsias, N. , Karteris, M. , Fernández-Palacios, A. , Navarro, C. , Jurado, J. , & Navarro, R. (1999). Burnt land mapping at local scale. Remote Sensing of Large Wildfires , 157–187. https://doi.org/10.1007/978-3-642-60164-4_9
- Lasaponara, R. (2006). Estimating spectral separability of satellite derived parameters for burned area mapping in the Calabria region by using SPOT-Vegetation data. Ecological Modelling , 196(1–2), 265–270. https://doi.org/10.1016/j.ecolmodel.2006.02.025
- Liu, S. , Marinelli, D. , Bruzzone, L. , & Bovolo, F. (2019). A review of change detection in multitemporal hyperspectral images: Current techniques, applications, and challenges. IEEE Geoscience and Remote Sensing Magazine , 7(2), 140–158. https://doi.org/10.1109/MGRS.2019.2898520
- Lozano, F.J. , Suárez-Seoane, S. , & Luis, D.E. (2007). Assessment of several spectral indices derived from multi-temporal Landsat data for fire occurrence probability modelling. Remote Sensing of Environment , 107(4), 533–544. https://doi.org/10.1016/j.rse.2006.10.001
- Martín, M.P , & Chuvieco, E. (1998). Cartografía de grandes incendios forestales en la península ibérica a partir de imágenes noaa-avhrr. Serie Geográfica , 7, 248–251.
- Mitri, G.H. , & Gitas, I.Z. (2004). A semi-automated object-oriented model for burned area mapping in the Mediterranean region using Landsat-TM imagery. International Journal of Wildland Fire , 13(3), 367–376. https://doi.org/10.1071/WF03079
- Mukherjee, J. , Mukherjee, J., & Chakravarty, D. (2018). Detection of coal seam fires in summer seasons from Landsat 8 OLI/TIRS in Dhanbad. National Conference on Computer Vision , Springer.In: Rameshan R., Arora C., Dutta Roy S. (eds) Computer Vision, Pattern Recognition, Image Processing, and Graphics. NCVPRIPG 2017. Communications in Computer and Information Science. Springer, Singapore, 841, 529-539. https://doi.org/10.1007/978-981-13-0020-2_46
- Otsu, N. (1979). A threshold selection method from gray level histograms. IEEE Transactions on Systems, Man, and Cybernetics, 9(1), 62–66. https://doi.org/10.1109/TSMC.1979.4310076
- Pereira, J.M.C. (1999). A comparative evaluation of NOAA/AVHRR vegetation indexes for burned surface detection and mapping. IEEE Transactions on Geoscience and Remote Sensing , 37(1), 217–226. https://doi.org/10.1109/36.739156
- Pinty, B. , & Verstraete, M.M. (1992). GEMI: A non-linear index to monitor global vegetation from satellites. Vegetatio, 101(1), 15–20. https://doi.org/10.1007/BF00031911
- Quintano, C. , Fernández-Manso, A. , & Fernández-Manso, O. (2018). Combination of Landsat and Sentinel-2 MSI data for initial assessing of burn severity. International Journal of Applied Earth Observation and Geoinformation , 64, 221–225. https://doi.org/10.3390/environments6030036
- Richards, J.A. (1984). Thematic mapping from multitemporal image data using the principal components transformation. Remote Sensing of Environment , 16(1), 35–46. https://doi.org/10.1016/0034-4257(84)90025-7
- Smith, A.M.S. , Drake, N.A. , Wooster, M.J. , Hudak, A.T. , Holden, Z.A. , & Gibbons, C.J. (2007). Production of Landsat ETM+ reference imagery of burned areas within Southern African savannahs: Comparison of methods and application to MODIS. International Journal of Remote Sensing , 28(12), 2753–2775. https://doi.org/10.1080/01431160600954704
- Teodoro, A. , & Amaral, A. (2019). A statistical and spatial analysis of Portuguese forest fires in summer 2016 considering Landsat 8 and Sentinel 2A data. Environments , 6(3), 36. https://doi.org/10.3390/environments6030036
- Trigg, S. , & Flasse, S. (2001). An evaluation of different bi-spectral spaces for discriminating burned shrub-savannah. International Journal of Remote Sensing , 22(13), 2641–2647. https://doi.org/10.1080/01431160110053185
- Tucker, C.J. (1979). Red and photographic infrared linear combinations for monitoring vegetation. Remote Sensing of Environment , 8(2), 127–150. https://doi.org/10.1016/0034-4257(79)90013-0
- Veraverbeke, S. , Harris, S. , & Hook, S. (2011). Evaluating spectral indices for burned area discrimination using MODIS/-ASTER (MASTER) airborne simulator data. Remote Sensing of Environment , 115(10), 2702–2709. https://doi.org/10.1016/j.rse.2011.06.010