
 ?Mathematical formulae have been encoded as MathML and are displayed in this HTML version using MathJax in order to improve their display. Uncheck the box to turn MathJax off. This feature requires Javascript. Click on a formula to zoom.
ABSTRACT
Grasslands are a major component of the natural vegetation in South Africa, it covers almost one-third of the country’s land surface. The current study focuses on assessing the impact of drought stress on communal and commercial grasslands in Eastern Cape Province using multi-temporal analysis of Sentinel-1 SAR data. Data analysis included retrieval of biophysical parameters of grasslands using Sentinel-1 SAR backscattering coefficients. Correlation analysis was performed between SAR data and NDVI values derived from Landsat-8 optical data. A linear mixed-effects regression analysis was performed for detecting the impact of drought on communal and commercial grasslands during a drought and non-drought growing seasons. Our results indicate that vegetation dynamics in grasslands in the study area are highly responsive to the climatic fluctuations. A significant correlation between backscattering coefficients of Sentinel-1 SAR data (VH and VV) and NDVI was observed for both communal and commercial grasslands (R2 = 0.89). Results also demonstrated that communal grasslands are more affected by drought impact than commercial grasslands. In commercial grasslands, management activities can improve the growing conditions of grasslands, reduce the impact of drought, and subsequently increase the resilience and productivity of this ecosystem.
Introduction
Grasslands cover more than 40% of the Earth’s land surface, and are widely used for livestock grazing and fodder production, thereby contributing to global food production in major ways (Food and Agriculture Organization [FAO], Citation2006). They are a major component of the natural vegetation in South Africa, and covers almost one-third of the country’s land surface, with a biome comprising 295,233 km2 of the central regions of the country, extending across the boundaries of seven provinces, and spanning a complex array of socio-economic situations and land use contexts (Palmer et al., Citation2005). They provide a range of ecosystem services including the protection of soil fertility, control of soil erosion, and influencing the hydrological cycle (Weigelt et al., Citation2009). In addition, grasslands are among the species-richest vegetation communities in the world, and therefore have important conservation value (Linnell et al., Citation2015). However, the ecosystem services provided by grasslands, they are facing several pressures due to the impact of climate change and unsustainable land management practices.
Climate change is commonly recognized as one of the most important drivers affecting plant ecosystems (Piras et al., Citation2016). Drying and warming climate usually decreases vegetation productivity (Li et al., Citation2013). Grasslands productivity is largely controlled by the amount and timing of precipitation and corresponding seasonal fluctuations in soil water content (Parton et al., Citation2012). Temperature is also an important regulator of grassland productivity (Liu et al., Citation2006). Drought has been a major factor influencing vegetation dynamics in grasslands (Cook et al., Citation2007), with substantial social and economic consequences (Wilhite & Buchanan-Smith, Citation2005). Severe drought can limit grasslands production (Knapp & Smith, Citation2001), alter nutrient cycling (Evans & Burke, Citation2013), and increase wildfire risk and susceptibility to invasive plant species (Abatzoglou & Kolden, Citation2011). Quantifying the economic and social impacts of drought on grasslands is complex due to the wide range of ecosystem services impacted. There is a critical need to understand how drought affects grasslands, because drought severity and drought-associated grasslands disturbances are expected to increase with climatic change.
Remote sensing offers a unique perspective for drought monitoring that complements the in situ–based climate data traditionally used for this application. Spaceborne sensors provide repeat coverage of spatially continuous measurements collected in a systematic, and objective manner. Vegetation estimates from MODIS and AVHRR have been extensively used for studying vegetation dynamics (Piñeiro et al., Citation2006), but complex spatial patterns that result from the interaction of disturbances with soils, topography, and vegetation are often undetectable with moderate-low resolution sensors (0.25–1 km). Satellite-based indices such as the Normalized Difference Vegetation Index (NDVI) became increasingly used for various environmental monitoring applications including drought monitoring (Kogan, Citation1997; Peters et al., Citation2002).
Although optical data are useful for drought monitoring, there is a limitation for data acquisition due to cloud contamination. Synthetic Aperture Radar (SAR) data have been used to complement the cloud problems of optical data because SAR data are not influenced by weather conditions (Lang & McCarty, Citation2008). Due to their sensitivity to dielectric and structural land surface features, SAR remote sensing techniques have shown their potential to derive spatial information from land surfaces, especially radar backscatter from polarimetric SAR systems allows a detailed description of different vegetation properties.
Several operational mapping algorithms rely on SAR backscattering from single-polarized (e.g. HH, HV, or VV), dual-polarized (HH/HV or VV/VH), or quad-polarized (HH/HV/VV/VH) SAR data (Morandeira et al., Citation2016). C- and X-band SAR data are used more often for the remote sensing of short vegetation including grasslands (McNairn et al., Citation2009; Wiseman et al., Citation2014), though L-band data are used sometimes as well (Yekkehkhany et al., Citation2014). Most of the studies employing SAR data for monitoring of grasslands focus on the analysis of SAR backscattering intensity and polarimetric parameters of single scenes or time series. For example, Schuster et al. (Citation2011) demonstrated the potential of TerraSAR-X HH-polarization backscattering intensity for detecting swath events over Natura 2000 habitats. Voormansik et al. (Citation2013) have analyzed dual polarimetric signatures of agricultural grasslands at X-band, indicating several potentially promising polarimetric parameters for detecting mowing events.
Despite these advantages, there are few SAR-based studies on the assessment of vegetation dynamics in grasslands and drought monitoring. The main reason these products have not been developed is the limited availability of SAR data (Santoro et al., Citation2015), which results in spatial and temporal discontinuities when quantifying vegetation dynamics as a result of climate change across broader geographic regions. Until recently, systematically collected SAR datasets, such as that from the Sentinel-1 satellite (Berger et al., Citation2012), have not been available. The European Space Agency currently provides Sentinel-1 SAR data with potentially global coverage that may greatly improve land surface monitoring.
The main objective of this study is to assess the impact of drought stress on communal and commercial grasslands in Eastern Cape Province based on the analysis of multi-temporal data of Sentinel-1. Specific objectives are; (a) evaluation of the potential of Sentinel-1 data in monitoring and retrieval of the biophysical parameters of grasslands, (b) characterization and interpretation of the backscattering parameters of grasslands, and (c) assessment of the impact of drought on both communal and commercial grasslands in the study area.
Materials and methods
Study area
The study area is located in Eastern Cape Province, the second largest province in South Africa, characterized by topographic and climatic complexity and diversity (Clark et al., Citation2009). The mountainous region in the study area form part of the Great Escarpment Mountains and dominated primarily by grasslands, with large patches of forest on the southern aspects (Hoare & Bredenkamp, Citation2001). Land ownership in the study area is divided into two tenure systems; a privately (commercially) owned land tenure system, and communally owned land tenure system. Communal land was predominantly located within the former homeland territories and on municipal land around each town in South Africa.
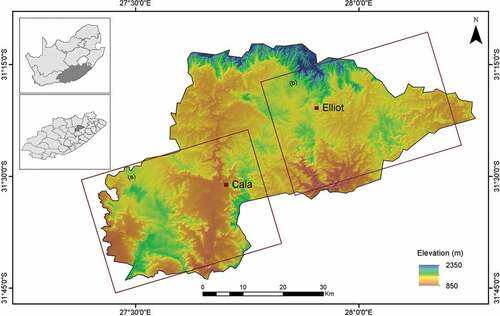
The climatic conditions in Eastern Cape vary from mild warm temperatures to subtropical conditions at the coast. Droughts can occur throughout the year, but grasslands are particularly vulnerable to droughts in summer during the growing season, which mainly goes from September to March. The precipitation regime is characterized by a large variability at various time scales from intra-seasonal, through inter-annual to decadal and multi-decadal (Kane, Citation2009). Two main study locations were selected in Sakhisizwe municipality in Eastern Cape, covering the two main grasslands tenure systems; communal and commercial grasslands ().
Figure 1. Map showing the location of the study area in Eastern Cape Province overlaid on SRTM digital elevation model; (a) communal grasslands, and (b) commercial grasslands.
Remote sensing data
Sentinel-1 SAR data covering the study area were acquired from the European Space Agency (ESA). As part of the Copernicus mission, Sentinel-1 carries a single C-band synthetic aperture radar instrument operating at a centre frequency of 5.405 GHz, and composed of a constellation of two satellites (Sentinel-1A and B) to assure data continuity provided by the ERS-1/2 and ENVISAT satellites (Torres et al., Citation2012). Sentinel-1A was launched in April 2014, and Sentinel-1B was launched in April 2016, jointly provide a nominal 6-day repeat cycle (12-day in South Africa), allowing for continuous monitoring of land surfaces. Sentinel-1 operates in four image modes with various observation strategies, swath widths, and spatial resolutions; the Strip Map mode (SM), Interferometric Wide swath mode (IW), Extra Wide swath mode (EW), and Wave swath mode (WV). Twenty-four scenes of Sentinel-1 SAR data were acquired, covering two growing seasons; drought season (2015/2016), and non-drought season (2016/2017). All the acquired data were in dual-polarization VV/VH, acquired in the Interferometric Wide swath mode (IW), in the ground range detected format (GRD). They were in a range and azimuth resolution of 5 m and 20 m, respectively. shows the specifications of Sentinel-1 data used in the current study.
Table 1. Sentinel-1 SAR data used in the current study. All data are in IW mode.
In addition to SAR data, Landsat-8 Operational Land Imager (OLI) optical data were used in the current study (). Landsat provides the longest continuous archive of optical satellite data for land surface mapping and monitoring. The launch of the Landsat-8 in particular has brought new opportunities and a platform for continuity in optical remote sensing. Landsat-8 surface reflectance scenes covering the study area in Eastern Cape during the two growing seasons of grasslands (2015/2016 and 2016/2017) were used in the current study to calculate the Normalized Difference Vegetation Index (NDVI) (Tucker, Citation1979).
Table 2. Landsat-8 data used in the current study.
Climate data
Meteorological data were acquired from the South African Weather Organization. The original climatic data were the daily records of precipitation and temperature from 2014 to 2017. Records were derived from five local meteorological stations covering both communal and commercial grasslands and the surrounded area in the Eastern Cape Province. In addition, precipitation information based on the Climate Hazards Group Infrared Precipitation with Station (CHIRPS) data were used in the current. The CHIRPS product provides daily precipitation data for the quasi-global coverage of 50°N-50°S from 1981 to present. The latest product is Version 2.0. It belongs to the “satellite-gauge” category (Funk et al., Citation2015). CHIRPS data covering the study area during the drought and non-drought seasons were downloaded, geometrically corrected, cropped to the extent of the study area, aggregated, and resampled to (30 m.).
Reference data
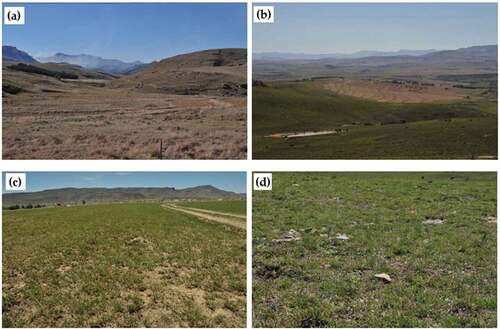
Fieldwork was carried out in the study area in Eastern Cape Province in October 2017 for validating the remote sensing data analysis. During the fieldwork, field measurements with the corresponding description were collected using the previously predefined test sites in the study area covering the two main study locations in commercial and communal grasslands (). Identification of the grasslands into the two different tenure systems; communal and commercial grasslands, was also carried out during the fieldwork in the study area. Additionally, land cover information covering the study area were obtained based on the South African National Land-cover dataset produced by GEOTERRAIMAGE in 2013–2014 with an overall accuracy of 81.73%, which used to extract the grasslands layer (Graw et al., Citation2017).
Figure 2. Photographs collected during the fieldwork showing the different landforms, and different terrain and topography, as well as the different grasslands conditions; (a–b) in commercial grasslands, and (c–d) in communal grasslands.
Data pre-processing
Sentinel-1 intensities data covering the study area consists of cross-polarized (VH), and co-polarized (VV) data were speckle-filtered, multi-looked, geocoded, and terrain corrected, followed by calculation of the backscattering coefficients (σ°) in decibel-scale (dB) (Small, Citation2011). Lee-Sigma filter with a combination of 5 × 5 kernels was used to reduce the speckle noise (Lee et al., Citation2009). The image pixels were multi-looked to 30 m square pixels using a bilinear method to be consistent with the Landsat-8 data. Terrain correction was conducted using the recently released STRM 1 arc-second (approximately 30 m) digital elevation model (DEM). SNAP toolbox (Sentinel Application Platform) developed by ESA was used for SAR data processing.
Landsat-8 images were gathered and processed in Google Earth Engine (Google Earth Engine [GEE], Citation2015). GEE stores surface reflectance data scenes, which have been pre-processed. The pre-processing steps include geometric and atmospheric correction, cloud masking and resampling to 30 m. Landsat-8 images were further processed in the GEE environment to calculate the Normalized Difference Vegetation Index (NDVI). NDVI is one of the most frequently used parameters in vegetation monitoring and eco-climatological studies and is computed as:
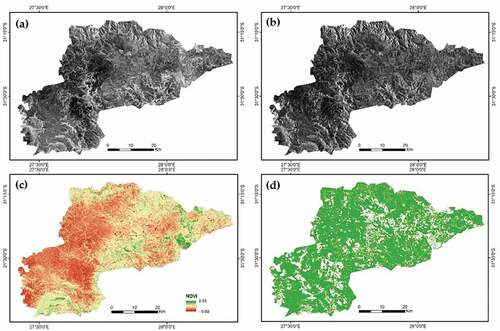
Where ρnir and ρr are the surface reflectances in the near-infrared and red spectral range, respectively. Grasslands information were extracted from the land cover dataset of the study area, ) shows the calculated and extracted products from the remote sensing data used in the current study.
Figure 3. Calculated and extracted products used in the current study during the growing season of 2015/2016; (a) VH backscattering coefficient, (b) VV backscattering coefficient, (c) Landsat-8 derived NDVI, and (d) grasslands layer extracted from the land cover dataset.
Data analysis
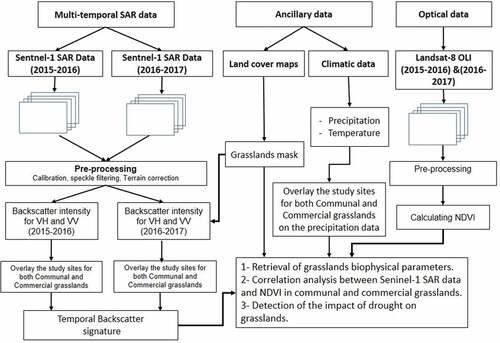
Data analysis consists of three main steps, (a) multi-temporal analysis of Sentinel-1 SAR data and retrieval of grasslands biophysical parameters, (b) assessment of the relationship between Sentinel-1 SAR data and Landsat-8 NDVI, and (c) detection of the impact of drought on communal and commercial grasslands. ) provides an overview of the entire approach adopted in this study.
Figure 4. Flowchart of the methodology adopted in the current study.
Temporal analysis of Sentinel-1 SAR data and retrieval of grasslands biophysical parameters
Time series analysis of the remotely sensed data is a useful tool for monitoring and characterization of land surface features across large areas. In the current study, a time series analysis was performed using Sentinel-1 SAR data to retrieve the biophysical parameters of grasslands in the study area during the drought and non-drought seasons. The outcomes of the time series analysis were information on the phenological parameters (growth stages of grasslands) for both communal and commercial grasslands during the two growing seasons. Afterwards, the backscattering was overlaid on the Precipitation data for better interpretation of the backscattering parameters and understanding the relationship between changes in the backscattering intensities and the corresponding change in precipitation in the study area. In the last step, we compared the backscattering coefficients between the two different study locations with communal and commercial grasslands during the two growing seasons.
Relationship between Sentinel-1 SAR data and Landsat-8 NDVI
Pearson’s correlation analysis was used to test the relationship between Sentinel-1 SAR data (backscattering of VH and VV), and Landsat-8 NDVI in both communal and commercial grasslands during the drought and non-drought seasons. The relationships between SAR data and NDVI were analyzed and compared to investigate the potential of using SAR data of Sentinel-1 with Landsat-8 NDVI to estimate the variations between grasslands in communal and commercial grasslands during the drought and non-drought seasons. The relationship between SAR backscattering and NDVI is described by the following linear model:
Where a0 and a1 are coefficients of the regression modeling, and D is the vegetation index NDVI. In addition, as Precipitation has a varied impact on vegetation growth in grasslands ecosystems, we compared the vegetation-precipitation dynamics to evaluate the response of grasslands to the variation in precipitation over communal and commercial grasslands during the drought and non-drought seasons. Data analysis were performed using R program version 3.5.0.
Detection of the impact of drought on grasslands
We applied a panel data analysis to compare the impact of drought on communal and commercial grasslands in Eastern Cape. Regression analysis was performed using the time series of SAR data; VH and VV backscattering during the drought and non-drought seasons. Additionally, regression analysis was also conducted using the time series of NDVI. We applied a linear mixed-effects maximum likelihood (ML) regression model according to the following equation:
Where y is the n x 1 vector of responses, X is the n x p fixed-effects design matrix, are the fixed effects, Z is the n x q random-effects design matrix, u are the random effects,
is the n x 1 vector of errors (McLean et al., Citation1991). All statistical analysis was performed using STATA 14 software.
Results
Characteristics of the climatic conditions in the study area
In South Africa, extreme droughts are sometimes triggered by El Niño Southern Oscillation (ENSO), a quasi-periodic invasion of warm sea surface waters into the central and eastern tropical Pacific Ocean, returning at least once in any ten-year period (Rouault & Richard, Citation2005). In 2015/2016, South Africa experienced a combined effects of a severe drought and a strong El Niño event. National authorities in South Africa qualified it as the worst in 23 years (Vogel & Van Zyl, Citation2016). This severe drought resulted in significant declines in the harvest in particular during 2016, and seriously depleted the water reserves, the drought has also had a ripple effect on the country’s economy that contributed to a decline in Gross Domestic Product. The socio-economic effects of drought across the region are evident, extensive and have negatively affected key sectors of the economy, such as agriculture and food security (Baudoin et al., Citation2017).
We compared the mean temperature and total precipitation during the drought season 2015/2016 and the non-drought season 2016/2017 in commercial and communal grasslands in the study area. The results highlighted the climatic variations between the two study locations. Communal grasslands received the least amount of rainfall within the growing season, accompanied with increased mean annual temperature than commercial grasslands, with higher mean temperature in the drought season than the normal growing season ().
Temporal analysis of Sentinel-1 SAR data and retrieval of grasslands biophysical parameters
) shows the backscattering variation in VH and VV polarizations in commercial and communal grasslands in the study area during the drought and non-drought growing seasons. The signals of grasslands in VV backscattering were higher than in VH, and the change in the magnitude of the signal (between grasslands types commercial and communal and also between dates) was greater in VV than in VH, and was greater in commercial grasslands than in communal grasslands. ) shows a wide range of grasslands backscattering variation in VH from the beginning of the growing season in September until the end of the season in March. This wide range is explained by the multiple scattering caused by the grasses stems. The signal variation of grasslands particularly in VH comes from two mechanisms that dominate during the growth cycle of grasslands, double-bounce scattering, and volume scattering.
Temporal variations of the backscattering coefficients revealed the phenological changes of grasslands in the study area, which can be differentiated into three main phases; (a) vegetative phase: grasslands backscattering increases with time, it increases from low values (around −21 dB in VH and −15 dB in VV) to higher values (around −19 dB in VH, and −13 dB in VV). At the beginning of the season, the backscattering coefficient σ0 is low since the fields are dry, then the incident radar signal is distributed. Only a small proportion of the emitted energy is backscattered to the sensor; the σ0 of the field is very low in both polarizations, followed by an increase in the backscattering takes place after a rainfall event at the beginning of the growing season. Conversely, at the end of the vegetative phase, when the grasses grow in number and height, the signal was particularly strong, it can be explained by the high proportion of the emitted energy that returns to the sensor because of the double-bounce scattering, (b) reproductive phase: when grasses reach their maximum height, the panicles develop, the leaves change direction and the stem dries. From this phase until the end of the season, the σ0 decreases. However, there is a slight increase in σ0 during the reproductive phase, it can be explained by the increase in the proportion of the transmitted signal due to the increased volume of vegetation, and (c) maturation phase: during this period, the grasses enter the senescence phase, the leaves and stem continue to dry, the plants move towards the ground, and the σ0 decreased in both VH and VV. This change is related to the decrease in the water content of the grasses which affects σ0 since dried plants have a lower dielectric constant.
Relationship between Sentinel-1 SAR data and Landsat-8 NDVI
The temporal analysis was conducted by correlating SAR backscattering (VH and VV) over communal and commercial grasslands with corresponding NDVI values. A spatial correlation was performed based on the mean values of SAR backscattering of each grasslands type and the Landsat-8 NDVI accordingly for both drought and non-drought growing seasons.
shows the correlations between SAR backscattering coefficients (VH and VV) and NDVI over the communal grasslands in the study area. Results revealed that, during the drought season, VH backscattering was positively correlated with NDVI (R2 = 0.89) (). In contrast, in the non-drought season when biomass reached a high level, VH backscattering changed, and the correlation of VH backscattering against NDVI decreased (R2 = 0.79) (). VV backscattering was positively correlated with NDVI in the drought season (R2 = 0.66) (), which also decreased in the non-drought season (R2 = 0.52) (). Results also showed that the correlation of VH backscattering with NDVI is higher than the correlation of VV backscattering with NDVI during both the drought and non-drought growing seasons ().
) shows the correlations between SAR backscattering coefficients (VH and VV) and NDVI over the commercial grasslands. A positive correlation was found between SAR backscattering coefficients and NDVI in commercial grasslands with a linear relationship. The correlation of VH backscattering with NDVI appeared higher in the drought season (R2 = 0.65), and lower in the non-drought season (R2 = 0.48). The correlation of VV backscattering with NDVI was also higher in the drought season (R2 = 0.46) than in the non-drought growing season, which weakly correlated to NDVI (). Similar to the correlations in communal grasslands, the correlation of VH backscattering was higher than the correlation of VV backscattering with NDVI. To compare between the correlation results for both communal and commercial grasslands, the correlation between Sentinel-1 SAR backscattering for both VH and VV was higher in communal grasslands than in commercial grasslands with strong correlations for VH backscattering with NDVI and weaker correlation for VV backscattering with NDVI.
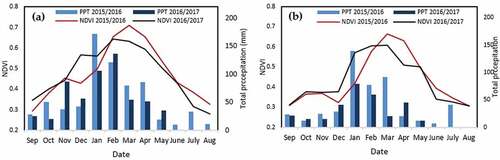
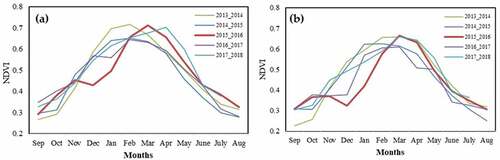
We compared the NDVI for commercial and communal grasslands in the study area during the last five years from 2013–2018. Results showed that, in most years, a single NDVI peak was observed during the growing seasons of grasslands, except for the growing season of 2015/2016 (the drought season), a double NDVI-peak was observed, which varied between commercial and communal grasslands (). This change in the pattern of grasslands growth from single–peak to double-peak during the drought season could be explained by the less rainfall received and the increased mean temperature occurred during the drought season 2015/2016, which suppress the growth of grasslands during this period, and subsequently lead to a change in the pattern of the growing season of grasslands. also showed that communal grasslands are more affected by this impact more than commercial grasslands.
We compared the NDVI-precipitation dynamics between commercial and communal grasslands during the drought and non-drought growing seasons. The main active vegetation dynamics in grasslands can be observed between September and March/April, which closely corresponds to the precipitation rates, which increase in October and drop in April ().
Figure 10. Annual normalized difference vegetation index (NDVI) overlaid on total precipitation during the drought and non-drought seasons; (a) commercial grasslands, and (b) communal grasslands.
Impact of drought on communal and commercial grasslands
shows the results of the regression analysis of Sentinel-1 SAR data over communal and commercial grasslands in Eastern Cape during the two growing seasons. Results showed that the drought season has a significant influence on the VH backscattering for both communal and commercial grasslands, with a higher impact on communal grasslands than commercial grasslands. There is a negative association between the drought season over communal grasslands and VH backscattering (β = – 0.69, p < 0.05) (). The variation between the impacts of drought on communal and commercial grasslands is very clear in VV than in VH backscattering, with a higher impact on communal grasslands than in commercial grasslands. A negative association between the drought season over communal grasslands and VV backscattering was detected (β = – 0.90, p < 0.01) (). Our results also showed that the drought season has a significant influence on NDVI values, there is a negative association between the drought season and NDVI (β = – 0.68, p < 0.01), and a negative association between communal grasslands and NDVI (β = – 0.69, p < 0.05) ().
Figure 11. Regression analysis in communal and commercial grasslands during the drought and non-drought growing seasons; (a) VH backscattering, (b) VV backscattering, and (c) NDVI.
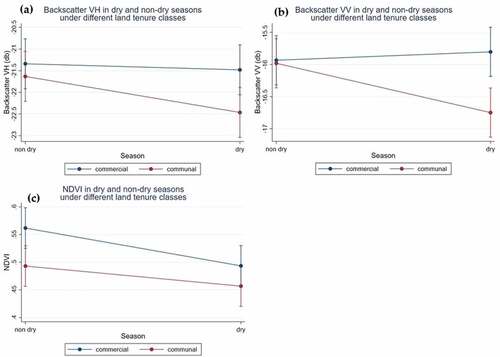
Figure 5. Overview of the mean temperature and total precipitation in the study area; (a) in commercial grasslands, and (b) in communal grasslands, during the growing season 2015/2016; and (c & d) during the growing season 2016/2017.
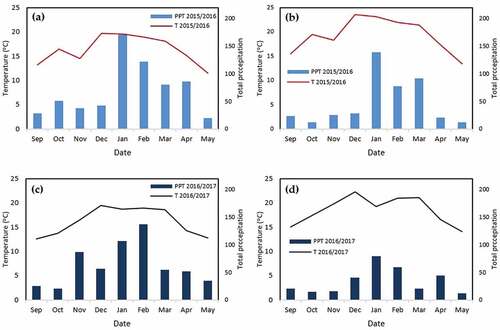
Figure 6. Comparing SAR backscattering over grasslands in Eastern Cape, (a–b) VH and VV backscattering during 2015/2016 season, and (c–d) VH and VV backscattering during the 2016/2017 season. The x-axis of the figures indicates Julian days of the respective years.
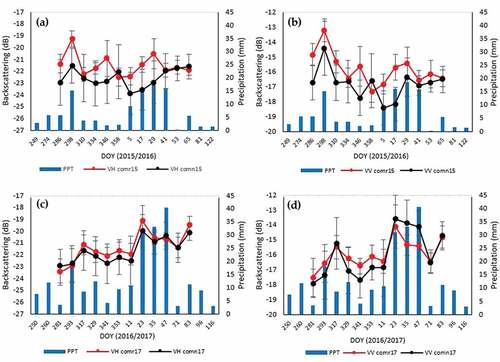
Figure 7. Correlation analysis between Sentinel-1 SAR data and NDVI over communal grasslands; (a–b) VH and VV backscattering with NDVI during the drought season 2015/2016, (c–d) VH and VV backscattering with NDVI during the non-drought growing season 2016/2017.
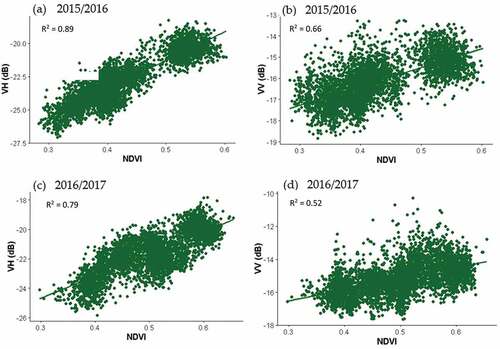
Figure 8. Correlation analysis between Sentinel-1 SAR data and NDVI over commercial grasslands; (a–b) VH and VV backscattering with NDVI during the drought season 2015/2016, and (c–d) VH and VV backscattering with NDVI during the non-drought season 2016/2017.
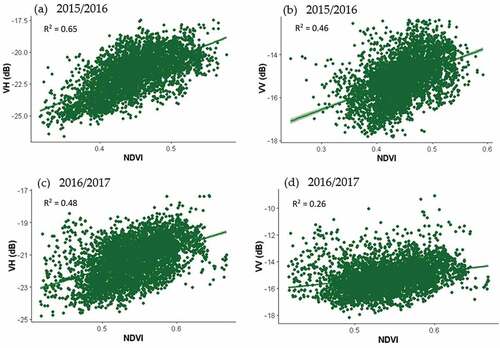
Figure 9. Annual normalized difference vegetation index (NDVI) in Eastern Cape during the last 5 years; (a) commercial grasslands, and (b) communal grasslands. The 2015/2016 season is highlighted with bold red line.
Discussion
We investigated the potential of multi-temporal SAR data of Sentinel-1 integrated with climatic data and field observations for monitoring grasslands and detection of the impact of drought on communal and commercial grasslands in Eastern Cape Province. Several studies used SAR data for vegetation mapping and monitoring, but SAR applications for grasslands monitoring have been much fewer relative to optical data. The reasons for this include limited availability of SAR data, and complex data structures relative to optical data. This condition changed after the launch of Sentinel-1 SAR data (Torres et al., Citation2012), which provided high spatial resolution (<30 m), and temporally frequent SAR data at the scales needed to support grasslands monitoring, and addressing the impact of climate change on vegetation dynamics in grasslands.
Studies which used SAR data have detailed vegetation backscattering responses for varying wavelengths, polarizations, incidence angles, scales, and field properties. SAR backscattering signal differs at various bands. SAR data with C-band (wavelength of ≃ 5 cm) were used more often for the monitoring of grasslands and agricultural crops due to the relatively small size of plants (McNairn et al., Citation2009; Wiseman et al., Citation2014). In case of low frequency (C-band), the total backscattering is a combination of contributions from soil and vegetation layer, while in case of high frequency, the total backscattering is the contribution of vegetation layer only (Wang et al., Citation2013).
Results of the current study demonstrated the potential of multi-temporal Sentinel-1 SAR data for monitoring the spatio-temporal variations in grasslands, and retrieval of the biophysical parameters of grasslands. Results showed that the signals of grasslands in VV backscattering were higher than in VH backscattering. Our results are in agreement with several studies used SAR data for monitoring of grasslands and agricultural crops, and focused on the analysis of SAR backscattering and polarimetric parameters; for example, McNeill et al. (Citation2010), found that TerraSAR-X HH+HV backscatter performed the best among all polarization combinations in pasture areas in New Zealand. Voormansik et al. (Citation2013), analyzed dual polarimetric signatures of agricultural grasslands at X-band, indicating several potentially promising polarimetric parameters for detecting mowing events.
Multi-temporal NDVI data derived from Landsat-8 optical data were used in the current study to contribute to our understanding of the ability of SAR data for monitoring of grasslands and detection of the impact of drought. Vegetation indices are less sensitive to image-to-image noise, viewing geometry, and atmospheric attenuation, making them particularly advantageous over reflectance products when using large areas (Banskota et al., Citation2014; Vermote et al., Citation2016). Our results revealed a positive correlation between SAR backscattering and NDVI in both communal and commercial grasslands, with a higher correlation of VH backscattering with NDVI in communal grasslands, this is probably related to the fact that VH signal has more capability than optical indices to estimate properties of grass of high biomass. Meanwhile, fluctuation of VH backscattering was also largely attributed to rainfall. Water on leaves after rainfall can cause substantial change of the backscattering coefficient (Wang et al., Citation2013), Correlation between Sentinel-1 SAR backscattering for both VH and VV was higher in communal grasslands than in commercial grasslands may be explained by communal grasslands received more rainfall (during a few rainfall events) in comparison to commercial grasslands, which in turns increase Sentinel-1 SAR backscattering and subsequently increase the correlation coefficients with NDVI, this in agreement with Ali et al. (Citation2013), they used COSMO-SkyMed SAR data in a study of nature conservation sites in the Alpine region, and found that the potential of VV backscatter to detect grazing or mowing activities was undermined by rainfall events, which made backscatter signal increase sharply.
During the last decade, the frequency and impact of natural disasters in the farming community in South Africa have increased significantly, and the most common type of disaster is drought. Data from the Centre for Research on the Epidemiology of Disaster show that drought is a major disaster in South Africa in terms of the number of people affected and total economic loss (Ngaka, Citation2012). Our results revealed seasonal dynamics of grasslands in the study area and provided insights into explaining the response of grasslands in communal and commercial grasslands to the changes in precipitation and the impact of drought. Other studies such as Graw et al. (Citation2017), used optical data only, and compared the precipitation-vegetation dynamics in croplands using Vegetation Condition Index (VCI) based on the MODIS EVI, indicated other drivers for productivity change and drought impact besides rainfall.
Results of the regression analysis in the current study revealed that communal grasslands are more affected by the impact of drought than commercial grasslands. People living in rural areas and resource-poor farmers in communal grasslands are often cited as more vulnerable to the impact of drought (Pelser et al., Citation2005), their suffering and vulnerability are often exacerbated by a lack of progress in effective drought management, while in commercial grasslands, management activities including; organizing the livestock grazing, firing, resting the fields, and grasslands mowing, were able to improve the growing conditions of commercial grasslands, reduced the impact of drought, and subsequently increased the grasslands resilience and productivity. Limitations of the current study include the short time series of SAR data, explained by the lack of Sentinel-1 data before 2015. In future work, we will combine multi-source SAR data for better prediction of the impact of drought on grasslands.
Conclusion
Grasslands are one of the main biomes in Eastern Cape Province, better management of grasslands is of great importance for profitability and sustainability. This study focused on investigating the potential of using multi-temporal SAR data of Sentinel-1 for monitoring and detecting the impact of drought on communal and commercial grasslands in Eastern Cape. The availability of multi-temporal SAR data with high temporal and spatial resolution allows for the analysis of seasonal vegetation dynamics in grasslands and retrieval of the biophysical parameters. Correlation between VH backscattering and NDVI was higher than VV backscattering and was higher in communal grasslands than in commercial grasslands. Findings presented in this study revealed that communal grasslands are more affected by the impact of drought than commercial grasslands. Our results demonstrated the feasibility of using multi-temporal SAR data of Sentinel-1 for grasslands monitoring and detection of the impact of drought on communal and commercial grasslands.
Acknowledgments
This study was carried out within the framework of the project “Earth observation-based information products for drought risk on a national level” (EvIDENz). We would like to acknowledge the European Space Agency (ESA) and the National Aeronautics and Space Administration (NASA) for providing Sentinel-1 SAR, and Landsat-8 data, the South African Weather Service Organization for providing the climatic data. Thanks also to Prof. Andries Jordaan for the local insights during the fieldwork, and Dr. Guido Lüchters for his feedback on the statistical analysis.
Disclosure statement
No potential conflict of interest was reported by the authors.
References
- Abatzoglou, J. T., & Kolden, C. A. (2011). Climate change in western U.S. deserts: Potential for increased wildfire and invasive annual grasses. Rangeland Ecology & Management, 64, 471–478. https://doi.org/10.2111/REM-D-09-00151.1
- Ali, I., Schuster, C., Zebisch, M., Forster, M., Kleinschmit, B., & Notarnicola, C. (2013). First results of monitoring nature conservation sites in alpine region by using very high resolution (VHR) X-band SAR data. IEEE Journal of Selected Topics in Applied Earth Observations and Remote Sensing, 6(5), 2265–2274. https://doi.org/10.1109/JSTARS.2013.2241735
- Banskota, A., Kayastha, N., Falkowski, M. J., Wulder, M. A., Froese, R. E., & White, J. C. (2014). Forest monitoring using landsat time series data: A review. Canadian Journal of Remote Sensing, 40(5), 362–384. https://doi.org/10.1080/07038992.2014.987376
- Baudoin, M. A., Vogel, C., Nortje, K., & Naik, M. (2017). Living with drought in South Africa: Lessons learnt from the recent El Niño drought period. International Journal of Disaster Risk Reduction, 23, 128–137. https://doi.org/10.1016/j.ijdrr.2017.05.005
- Berger, M., Moreno, J., Johannessen, J. A., Levelt, P. F., & Hanssen, R. F. (2012). ESA’s sentinel missions in support of earth system science. Remote Sensing of Environment, 120, 84–90. https://doi.org/10.1016/j.rse.2011.07.023
- Clark, V. R., Barker, N. P., & Mucina, L. (2009). The sneeuberg: A new centre of floristic endemism on the Great Escarpment, South Africa. South African Journal of Botany, 75(2), 196–238. https://doi.org/10.1016/j.sajb.2008.10.010
- Cook, E. R., Seager, R., Cane, M. A., & Stahle, D. V. (2007). North American drought: Reconstructions, causes, and consequences. Earth-Science Reviews, 81(1), 93–134. https://doi.org/10.1016/j.earscirev.2006.12.002
- Evans, S. E., & Burke, I. C. (2013). Carbon and nitrogen decoupling under an 11-year drought in the shortgrass steppe. Ecosystems, 16(1), 20–33. https://doi.org/10.1007/s10021-012-9593-4
- Food and Agriculture Organization [FAO]. (2006). Livestock’s long shadows: Environmental issues and options.
- Funk, C., Peterson, P., Landsfeld, M., Pedreros, D., Verdin, J., Shukla, S., … Hoell, A. (2015). The climate hazards infrared precipitation with stations - A new environmental record for monitoring extremes. Scientific Data, 2(1), 150066. https://doi.org/10.1038/sdata.2015.66
- Google Earth Engine [GEE]. (2015). A planetary-scale geospatial analysis platform. Retrieved May 6, 2017, from https://eathengine.google.com
- Graw, V., Ghazaryan, G., Dall, K., Gómez, A. D., Abdel-Hamid, A., Jordaan, A., … Dubovyk, O. (2017). Drought dynamics and vegetation productivity in different land management systems of Eastern Cape, South Africa - A remote sensing perspective. Sustainability, 9(10), 1728. https://doi.org/10.3390/su9101728
- Hoare, D. B., & Bredenkamp, G. J. (2001). Syntaxonomy and environmental gradients of the grasslands of the stormberg/drakensberg mountain region of the Eastern Cape, South Africa. South African Journal of Botany, 67, 595–608.
- Kane, R. P. (2009). Periodicities, ENSO effects and trends of some South African rainfall series: An update. South African Journal of Science, 105, 5–6. https://doi.org/10.4102/sajs.v105i5/6.90
- Knapp, A. K., & Smith, M. D. (2001). Variation among biomes in temporal dynamics of aboveground primary production. Science, 291(5503), 481–484. https://doi.org/10.1126/science.291.5503.481
- Kogan, F. N. (1997). Global drought watch from space. Bulletin of the American Meteorological Society, 78(4), 621–636. http://web.iitd.ac.in/~sagnik/C2.pdf
- Lang, M. W., & McCarty, G. W. (2008). Remote sensing data for regional Wetland mapping in the United States: Trends and future prospects. In R.E. Russo (Ed.), Wetlands: Ecology, conservation and restoration (pp. 1–40). Nova Science Publishers.
- Lee, J. S., Wen, J.-H., Ainsworth, T. L., Chen, K. S., & Chen, A. J. (2009). Improved sigma filter for speckle filtering of SAR imagery. IEEE Transactions on Geoscience and Remote Sensing, 47(1), 202–213. https://doi.org/10.1109/TGRS.2008.2002881
- Li, S., Xie, Y., Brown, D. G., Bai, Y., Hua, J., & Judd, K. (2013). Spatial variability of the adaptation of grassland vegetation to climatic change in Inner Mongolia of China. Applied Geography, 43, 1–12. https://doi.org/10.1016/j.apgeog.2013.05.008
- Linnell, J. D. C., Kaczensky, P., Wotschikowsky, U., Lescureux, N., & Boitani, L. (2015). Framing the relationship between people and nature in the context of European conservation. Conservation Biology, 29(4), 978–985. https://doi.org/10.1111/cobi.12534
- Liu, X., Yin, Z.-Y., Shao, X., & Qin, N. (2006). Temporal trends and variability of daily maximum and minimum, extreme temperature events, and growing season length over the eastern and central Tibetan Plateau during 1961–2003. Journal of Geophysical Research, Atmospheres, 111(D19), D19. https://doi.org/10.1029/2005JD006915
- McLean, R. A., Sanders, W. L., & Stroup, W. W. (1991). A unified approach to mixed linear models. The American statistician. American Statistical Association, 45, 54–64. doi: 10.1080/00031305.1991.10475767
- McNairn, H., Shang, J., Champagne, C., & Jiao, X. (2009, July) TerraSAR-X and RADARSAT-2 for crop classification and acreage estimation,” In Proceeding of the IEEE International Geoscience and Remote Sensing Symposium (IGARSS’09), 2, II-898–II-901.
- McNeill, S., Pairman, D., Belliss, S., Dalley, D., & Dynes, R. (2010, July). Robust estimation of pasture biomass using dual-polarisation TerrASAR-X imagery. In Proceedings of IEEE International Geoscience and Remote Sensing Symposium IGARSS, Honolulu, HI, (pp. 3094–3097)
- Morandeira, N., Grings, F., Facchinetti, C., & Kandus, P. (2016). Mapping plant functional types in floodplain wetlands: An analysis of c-band polarimetric SAR data from Radarsat-2. Remote Sensing, 8(3), 174. https://doi.org/10.3390/rs8030174
- Ngaka, M. J. (2012). Drought preparedness, impact and response: A case of the Eastern Cape and free state provinces of South Africa. Journal of Disaster Risk Studies, 4, 1. https://doi.org/10.4102/jamba.v4i1.47
- Palmer, A. R., & Ainslie, A. M. (2005). Grasslands of South Africa. In Food and Agriculture Organization Ed., Grasslands of the world (pp. 77–120).
- Parton, W., Morgan, J., Smith, D., Del Grosso, S., Prihodko, L., LeCain, D., … Lutz, S. (2012). Impact of precipitation dynamics on net ecosystem productivity. Global Change Biology, 18(3), 915–927.
- Pelser, A. J., Redelinghuys, N., Viljoen, M. F., & Teweldemehin, M. Y. (2005). Policy guidelines for the evaluation of social, economic and political impacts of drought and aridity. University of Free State.
- Peters, A. J., Walter-Shea, E. A., Ji, L., Vina, A., Hayes, M., & Svoboda, M. (2002). Drought monitoring with NDVI-based standardized vegetation index. Photogrammetric Engineering and Remote Sensing, 68(1), 71–75.
- Piñeiro, G., Oesterheld, M., & Paruelo, J. M. (2006). Seasonal variation in aboveground production and radiation-use efficiency of temperate rangelands estimated through remote sensing. Ecosystems, 9(3), 357–373. https://doi.org/10.1007/s10021-005-0013-x
- Piras, M., Mascaro, G., Deidda, R., & Vivoni, E. R. (2016). Impacts of climate change on precipitation and discharge extremes through the use of statistical downscaling approaches in a mediterranean basin. Science of the Total Environment, 543, 952–964. https://doi.org/10.1016/j.scitotenv.2015.06.088
- Rouault, M., & Richard, Y. (2005). Intensity and spatial extent of droughts in Southern Africa. Geophysical Research Letters, 32(15), 15702. https://doi.org/10.1029/2005GL022436
- Santoro, M., Wegmüller, U., Lamarche, C., Bontemps, S., Defourny, P., & Arino, O. (2015). Strengths and weaknesses of multi-year ENVISAT ASAR backscatter measurements to map permanent open water bodies at global scale. Remote Sensing of Environment, 171, 185–201. https://doi.org/10.1016/j.rse.2015.10.031
- Schuster, C., Ali, I., Lohmann, P., Frick, A., Förster, M., & Kleinschmit, B. (2011). Towards detecting swath events in Terrasar-X time series to establish NATURA 2000 grassland habitat swath management as monitoring parameter. Remote Sensing, 3(7), 1308–1322. https://doi.org/10.3390/rs3071308
- Small, D. (2011). Flattening gamma: Radiometric terrain correction for SAR imagery. IEEE Transactions on Geoscience and Remote Sensing, 49, 3081–3093. https://doi.org/10.1109/TGRS.2011.2120616
- Torres, R., Snoeij, P., Geudtner, D., Bibby, D., Davidson, M., Attema, E., Rommen, B., Floury, N., Brown, M., Traver, I. N., Deghaye, P., Duesmann, B., Rosich, B., Miranda, N., Bruno, C., L’Abbate, M., Croci, R., Pietropaolo, A., Huchler, M., Rostan, F., & Potin, P. (2012). Gmes Sentinel-1 mission. Remote Sensing of Environment, 120, 9–24. https://doi.org/10.1016/j.rse.2011.05.028
- Tucker, C. J. (1979). Red and photographic infrared linear combinations for monitoring vegetation. Remote Sensing of Environment, 8(2), 127–150. https://doi.org/10.1016/0034-4257(79)90013-0
- Vermote, E., Justice, C., Claverie, M., & Franch, B. (2016). Preliminary analysis of the performance of the Landsat 8/OLI land surface reflectance product. Remote Sensing of Environment, 185, 46–56. https://doi.org/10.1016/j.rse.2016.04.008
- Vogel, C., & Van Zyl, K. (2016). Drought: In search of sustainable solutions to a persistent, ‘wicked’ problem in South Africa. In N. Salzmann, C. Huggel, S.U. Nussbaumer, & G. Ziervogel (Eds.), Climate chang adaptation strategies – an upstream-downstream perspective (pp. 195–211)). Springer International Publishing.
- Voormansik, K., Jagdhuber, T., Olesk, A., Hajnsek, I., & Papathanassiou, K. P. (2013). Towards a detection of grassland cutting practices with dual polarimetric TerraSAR-X data. International Journal of Remote Sensing, 34(22), 8081–8103. https://doi.org/10.1080/01431161.2013.829593
- Wang, X., Ge, L., & Li, X. (2013). Pasture monitoring using SAR with COSMO-SkyMed, ENVISAT ASAR, and ALOS PALSAR in Otway, Australia. Remote Sensing, 5(7), 3611–3636. https://doi.org/10.3390/rs5073611
- Weigelt, A., Weisser, W. W., Buchmann, N., & Scherer-Lorenzen, M. (2009). Biodiversity for multifunctional grasslands: Equal productivity in high-diversity low-input and low-diversity high-input systems. Biogeosciences, 6(8), 1695–1706. https://doi.org/10.5194/bg-6-1695-2009
- Wilhite, D. A., & Buchanan-Smith, M. (2005). Drought as hazard: Understanding the natural and social context. In D.A. Wilhite (Ed.), Drought and water crises: Science, technology and management issues (pp. 3–29). Taylor and Francis.
- Wiseman, G., McNairn, H., Homayouni, S., & Shang, J. (2014). RADARSAT-2 polarimetric SAR response to crop biomass for agricultural production monitoring. IEEE Journal of Selected Topics in Applied Earth Observation and Remote Sensing, 7(11), 4461–4471. https://doi.org/10.1109/JSTARS.2014.2322311
- Yekkehkhany, B., Homayouni, S., McNairn, H., & Safari, A. (2014, July) Multitemporal full polarimetry L-band SAR data classification for agriculture land cover mapping,”. In Proceeding of the IEEE International Geoscience and Remote Sensing Symposium (IGARSS’14) pp. 2770–2773.