
 ?Mathematical formulae have been encoded as MathML and are displayed in this HTML version using MathJax in order to improve their display. Uncheck the box to turn MathJax off. This feature requires Javascript. Click on a formula to zoom.
ABSTRACT
In this study the accuracy of ALOS Global Digital Surface Model (AW3D30) with a point spacing of approx. 30-meter mesh was examined, taking as a case study several areas of Greece with complex geomorphologic characteristics. DSMs from ALOS stereo pairs were created using classical photogrammetric techniques. These DSMs were compared with the ALOS AW3D30 and a DEM created from digitized contours. Visual and statistical comparison of the DSMs has been performed.Check Points of known elevation selected from the National Trigonometric Network have been used to estimate the accuracy of the DSMs and the results are presented herein. It has been proved that the freely available AW3D30 DSM presents two or three times lower Root Mean Square Error (RMSE) than the respective DSMs from ALOS PRISM images. In areas with low relief such as Antiparos Island in the Cyclades complex, the ALOS AW3D30 RMSE is only 2.69 m, while in Areas with high relief such as the Chania Prefecture in Western Crete the respective error rises up to 14m. In urban area such as Athens, the capital of Greece, the respective error ranges around 12m due to the complex urban environment (high buildings, narrow urban roads, moving vehicles etc.).
Introduction
Almost all the environmental and geological studies need quite accurate elevation data with global coverage. Among others, we can mention the following: geological and hydrogeological modelling, flood prevention and flood expansion monitoring, water management, geomorphology and landscape analysis, landslide monitoring and mapping, volcanic activity, sea level change or tsunamis outspread. The increased need for elevation data has simultaneously accelerated the construction of new satellites that collect stereo data and the development of algorithms for automatic Digital Surface Model (DSM) extraction (Lee et al., Citation2003; Toutin, Citation2001, Citation2004). During the early years the satellite stereo-pairs were acquired across track on different days (SPOT, ERS etc.). Today, the same-date, along-track stereo-data acquisition is adopted from the majority of satellites (SPOT-5, Cartosat, ALOS PRISM). As described in Nikolakopoulos et al. (Citation2006) the along-track stereo-data acquisition is superior as it reduces the radiometric image variations (refractive effects, sun illumination, temporal changes) and thus increases the correlation success rate in any image matching.
As DSMs are widely used, several studies have been published during the last years trying to assess the vertical accuracy of elevation products created from stereo pairs of very high resolution satellite and digital aerial images. Hobi and Ginzler (Citation2012) have compared DSMs created from WorldView-2 satellite stereo pair and ADS80 aerial image stereo data in order to show their potentiality for accurate modelling of forest canopy height. In a more recent study, Capaldo (Citation2012) have compared DSMs extracted from WorldWiew-1 and GeoEye-1 stereo pairs for the urban area of Rome and the Augusta area as well. They concluded that Worldview-1 data gave more accurate results. Poli and Toutin (Citation2012) presented a review study on high resolution (HR) and very high resolution (VHR) pushbroom optical sensors used for photogrammetric and remote sensing applications. Several sensors that collect along the flight direction the stereo pairs such as SPOT-5, Cartosat-1 and ALOS PRISM were examined. The use of very high resolution satellite stereopairs such as Geoeye-1 and Worldview-2 for disaster monitoring has been discussed in another study (Poli & Caravaggi, Citation2013). The authors mentioned the advantages of the along the track image acquisition. Both sensors are able to rotate on their axis, and acquire stereo images along-track on the same orbit in the range of seconds or minutes. As a result the sun illumination conditions are almost constant and changes in the two stereo images are limited to moving objects (e.g., vehicles).
The DSMs with almost global coverage can be divided in two major categories: a. The freely available datasets such as the Shuttle Radar Topography Mission Digital Elevation Model (SRTM DEM) and Advanced Spaceborne Thermal Emission and Reflection Radiometer (ASTER) Global Digital Elevation Model (GDEM) that present quite low vertical accuracies and b. other dataset with global coverage such as SPOT 5 and ALOS with much better vertical accuracies. Even the lower accuracy ASTER GDEM and SRTM DEM proved to provide valuable information for map updating (Nikolakopoulos & Chrysoulakis, Citation2006).
The studies concerning the assessment of ALOS PRISM data for automatic DSM extraction can be discriminated in two major categories: the prelaunch period and the period after the official release of the data.
Different studies simulating the performance of ALOS PRISM were published between 2001 and 2005 (Koarai et al., Citation2000; CitationHashimoto,; Suzuki, Citation2003; Tadono et al., Citation2003; J. Takaku et al., Citation2011).
During the operational period of ALOS several studies assessing the vertical accuracy of DSMs produced from ALOS PRISM triplet stereo pairs have been applied. In these studies the vertical accuracy is calculated using more accurate reference DSMs or check points measured with differential GNSS receivers.
J. Takaku et al. (Citation2007) have compared the DSM created from ALOS PRISM data to DSMs created from Lidar and airphotos over five areas with different characteristics. The vertical accuracy was found to range between 4.83 and 7.46 m. Maruya and Ohyama (Citation2007) have examined the vertical accuracy of ALOS PRISM DSM with reference to the Base-to-Height-ratio of the triplet stereo images. Gruen and Wolff (Citation2007) have compared DSMs from ALOS optical data with DSMs from aerial photos for two different test-fields in the Bern/Thun area of Switzerland and in Okazaki, Japan. The overall RMS height error was found to be better than three pixels (5.5 m – 6.6 m). Best accuracies were marked for open areas. Maruya and Ohyama (Citation2008) have assessed the vertical accuracy of DSM and the horizontal displacement of the derived orthophotos. According to their evaluation, DEM elevation accuracy is estimated between 5 and 6 m RMSE and the accuracy of the ortho-rectified images is about 11 m even in mountainous areas. Bignone and Umakawa (Citation2008) compared the altimetry accuracy of ALOS PPRISM with reference to Ikonos DSM. The statistical analysis between mountainous area and plain areas has gauged a standard deviation of 5.2 and 2.3 meters respectively. J. Takaku et al. (Citation2008) in another study have calculated DSM accuracies of six scene sets of triplet stereo pair images for nine reference sites. The generated DSM height accuracies varied from 4 to 5 m for flat areas, between 5 and 7 m for various terrain mixed areas, between 5 and 6 m for mountainous areas and from 6 to 8 m for steep areas. In another study (Lamsal et al., Citation2011) Corona KH-4A and ALOS PRISM images were used to generate digital surface models (DTMs) of the distal part of Imja Glacier in Eastern Nepal. The evolution of the glacier was monitored for the period 1964–2006. DSM from ALOS PRISM data was compared to respective data sets created from aerial photos or digitized contours (Nikolakopoulos & Vaiopoulos, Citation2011). DSM from ALOS PRISM stereopairs was compared to SRTM and ASTER DSM in order to detect and map natural karst depression in Brasil (De Carvalho Júnior et al., Citation2014). It was proved that ALOS PRISM DEM had the best performance in karst feature detection. ALOS PRISM DEM was compared to high accuracy DEM and DSM data derived from airborne LiDAR point clouds over a watershed located in south-central Taiwan (Liu et al., Citation2015).
The vertical accuracy of ALOS AW3D30 has been assessed in some studies during the last years. The original specifications of AW3D30 supposed to be better than 5 m both in vertical and horizontal axes (Tadono et al., Citation2016). A comparison study between SRTM1 DEM, ASTER GDEM, and AW3D30 DSM has been performed in the Zaoksky area Central European Russia. The accuracy of the three DSMs was assessed using 69 ground control and a reference DEM photogrammetrically generated from aerial stereo images (Florinsky et al., Citation2018). In another similar study, in the Hubei Province of China, a typical 1:50,000 DEM was used as a reference to assess the vertical accuracy of STRM30, SRTM90 ASTER GDEM and AW3D30 in terms of terrain types, slopes, and land cover (Hu et al., Citation2017). A first assessment of the TanDEM-X DEMs over Brazilian territory is presented through a comparison with SRTM, ASTER GDEM and ALOS AW3D30 DEMs in seven study areas with distinct geomorphological contexts, vegetation coverage, and land use (Grohmann, Citation2018). In another contribution, the vertical accuracy of the AW3D30 was controlled using vector data and more especially the runway method (RWYM). A reference dataset consisting of 36 runways located at various places around the world was used to evaluate the vertical accuracy of the AW3D30 (Caglar et al., Citation2018). (Yap et al., Citation2018) utilized 555 GPS points distributed all over Cameroon to calculate the vertical accuracy of SRTM30, ASTER GDEM and AW3D30. Sefercik et al. (Citation2018) validated the vertical accuracy of a DSM created from Sentinel-1A (S-1A), AW3D30 DSM and SRTM DEM versus a high accurate reference DSM created from airborne laser scanning data at the broader area of Instanbul. Santillan and Makinano-Santillan (Citation2016) used 274 GCPs measured with surveying techniques in northeastern Mindanao, Philippines in order to validate the accuracy of ASTER GDEM, SRTM30 and AW3D30. In a project area close to Istanbul the quality of WorldDEM, AW3D30, SRTM DSM and ASTER GDEM2 have been analysed in relation to a reference aerial LiDAR DEM and to each other. In that study the random and the systematic height errors have been separated. The absolute offset for all height models in X, Y and Z was found within the expectation (Bayburt et al., Citation2017). In another study (Stamatiou et al., Citation2018) the vertical accuracy of the AW3D30 DSM was compared with 23,717 trigonometric points that cover the entire Greek territory. Jain et al. (Citation2017) validated the accuracy of AW3D30 versus the respective accuracies of SRTM DEM, ASTER GDEM and the Indian National Cartosat-1 DEM v3 (CartoDEM-V3.1) for an area located in the Indian peninsula using 117 ground control points collected by a dual frequency GNSS receiver of a millimeter accuracy. In a more recent study (Alganci et al., Citation2018) ASTER 30 m DEM, SRTM 30 m DEM, ALOS 30 m DSM, a 3 m resolution DSM produced from tri-stereo images of the SPOT 6 satellite and a 1 m resolution DSM produced from tri-stereo images of the Pleiades high-resolution (PHR) 1A satellite were compared. The reference DSM was produced from 30 cm spatial resolution aerial photos and provided 1 m and 3 m vertical accuracy at the 90% confidence interval (CI) in flat and hilly areas, respectively.
The main characteristic of all the above-mentioned studies is that they compare the vertical accuracy of ALOS AW3D30 DSM to other freely available DSMs like SRTM90, SRTM30 or ASTER GDEM. This paper for the first time tries to assess the accuracy of the freely available ALOS AW3D30 to DSMs created from ALOS PRISM stereopairs with classical photogrammetric techniques. The freely available DSMs like SRTM DEM or ALOS AW3D30 are developed with automatic procedures from the satellite owners (NASA, JAXA etc.) without the use of GCPs. Individual users process one or two stereo images with photogrammetric software in combination with GCPs. Thus, there is a high scientific interest to compare DSMs created with two totally different procedures over the same area. Furthermore, in many previous studies ALOS AW3D30 DSM accuracy was examined for one or two study areas. In the current manuscript, a quite quantitative assessment of the ALOS AW3D30 DSM accuracy is performed and ten ALOS triplet scenes are analysed simultaneously. For seven areas in Greece with totally different geomorphologic characteristics, DSMs were created using Leica Photogrammetry Suite and classical photogrammetric techniques. Those DSMs and ALOS AW3D30 were evaluated together and the results are analysed.
This research has focused on the statistical analysis of the vertical accuracy of ALOS PRISM data as a function of the different Base-to-Height-ratio between the three stereo pairs and different morphological characteristics such as the average terrain altitude and the land use. Unlike other studies, the research was mainly based on a statistical approach aiming to extract quantitative model relationships between the stereopairs and the vertical accuracy. Furthermore, the paper tries to answer to the following question: Is it worthy to handle the ALOS Prism data with photogrammetric software or it is better to use the freely available ALOS AW3D30?
The rest of this paper is organized as follows. In Sect. 2, the study area and the materials and methods are introduced. In Sect. 3 the experimental findings of DEM accuracy are presented. The relation between the Base-to-Height-ratio and the results are analysed and discussed in section 4 and finally the conclusions drawn from this research are presented in the last section.
Materials, methods and study area
Study areas
Ten different triplets of ALOS PRISM data from different areas over Greece were used in the current study (). The selection of those areas is based on different morphological and landuse characteristics. Three of the scenes cover the Attiki peninsula around Athens, the capital of Greece. Another triplet covers the broader area of Thessaloniki the second larger city in Greece. Both areas are very dense populated with millions of buildings and manmade features. Another area is located in Northern Greece in the Chalkidiki Peninsula. It is an area with dense vegetation cover and quite highly relief. The maximum elevation exceeds 1160 m while the mean value is around 360 m. A similar highly relief with dense vegetation represents the Figalia test area in Western Peloponnese. According to the Corinne Land Cover 2000 (CLC2000) classification the main landuse classes in those study area can be divided in three major categories: Discontinuous urban fabric, non-irrigated arable land and mixed forest. Antiparos Island is one low relief area in Cyclades Complex. The central part of the island is quite highly while the northern part is more flat. The elevation ranges between 0 and 300 m. Myconos is another small Island in Cyclades complex but is more populated and full of manmade constructions. Finally, two adjacent scenes cover the broader area of Chania in Crete Island. The relief varies from flat near to the sea to extreme highly in the mainland. The altitude ranges between 0 and more than 1300 m. There is also a big difference in the area extent of the study regions. There are areas in the mainland like Figalia where the extent is quite big (1900 km2) and areas with smaller extent like Antiparos Island (83 km2). All these statistics are presented in .
Table 1. The number of check points that were used in each study area.
ALOS PRISM data
The Advanced Land Observing Satellite (ALOS) was developed by the Japan Aerospace Exploration Agency (JAXA) and launched in sun synchronous orbit in January of 2006. ALOS was the first satellite carrying three sensors commonly referred to as the “three eyes” of ALOS. These sensors are: the Panchromatic Remote-Sensing Instrument for Stereo Mapping (PRISM), the Advanced Visible and Near Infrared Radiometer type 2 (AVNIR-2), and the Phased Array type L-band Synthetic Aperture Radar (PALSAR). PRISM is a panchromatic radiometer with 2.5 m spatial resolution at nadir. According to the specifications its extracted data will provide a highly accurate digital surface model (DSM). PRISM has three independent optical systems for viewing nadir, forward and backward producing a stereoscopic image along the satellite’s track. Each telescope consists of three mirrors and several CCD detectors for push-broom scanning. The nadir-viewing telescope covers a width of 70 km; forward and backward telescopes cover 35 km each. Under the Primary Investigator project 6554 European Space Agency (ESA) has provided freely PRISM triplets over Greece.
PRISM data processing
The automatic DSM creation from ALOS PRISM stereopair is described in detail in Nikolakopoulos Konstantinos et al. (Citation2010). Ten PRISM triplets acquired over Greece were used in this study. Three different combinations of pairs of images for the conventional matching were chosen from among the triplet images (Forward, Nadir and Backward). The combinations and Base-to-Height ratios (B/H) are as follows;
Nadir and Forward (NF), B/H = 0.5
Nadir and Backward (NB), B/H = 0.5
Forward and Backward (FB), B/H = 1
For the processing of the ALOS triplets Leica Photogrammetry Suite software has been used. ALOS PRISM triplet images have been processed using the Automatic Terrain Extraction with Dense Point Matching (eATE) of ERDAS IMAGINE Photogrammetry Suite. The ALOS PRISM orbital pushbroom model was selected as the geometric model while the classic point measurement tool was used for the ground control point’s selection. After the preparation of the GCPs, block triangulation has been used to check the quality of the GCPs. Next, the eATE process is activated. At this stage, the output spatial resolution, the interpolation method and the smoothing factor of the DSM are defined. The photogrammetric processing in ERDAS Imagine is described in more details in a previous study (Panagiotakis et al., Citation2018).
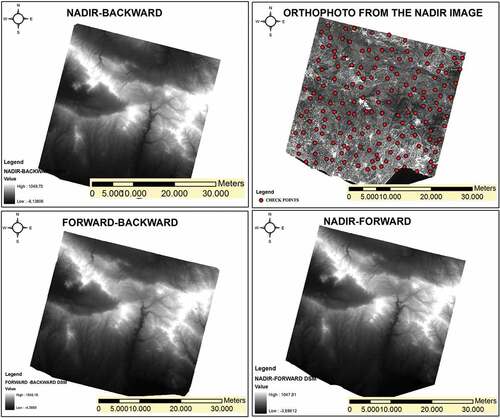
For every scene at least twenty-five ground control points and more than one hundred tie points were used. For all the stereo-pairs the same GCPs were used. An example of the PRISM data processing in Leica Photogrammetry Suite is presented in . The example is from the broader area of Chania in Crete. Each time three DSMs with a point spacing of 7.5 m were created. No further processing (editing) was done to the three DSMs. An example of the three DSMs created with classical photogrammetric techniques is given in for the study area in Chalkidiki peninsula.
ALOS AW3D30
On May 2016 a global digital surface model dataset named ALOS Global Digital Surface Model (AW3D30) with a point spacing of approx. 30-meter mesh (1 arcsec) has been released by the Japan Aerospace Exploration Agency (JAXA). The dataset has been compiled with images acquired by the Advanced Land Observing Satellite “DAICHI” (ALOS) and it was published based on the DSM dataset (5-meter mesh version) of the “World 3D Topographic Data”, which is the most precise global-scale elevation data at this time, and its elevation precision is also at a world-leading level as a 30-meter mesh version. Almost a year later on March 2017 JAXA has released an updated version (ver 1.1). In this release void pixels existed in Version 1 due to clouds and snow pixels within 60 deg. of north and south latitudes were complemented by existing DEMs. Furthermore, some detected systematic relative height errors of ~3 m along with the satellite path were appropriately eliminated with the additional calibration of the PRISM physical sensor model (Takaku & Tadono, Citation2017).
Using the freely available AW3D30 data a DSM covering the whole country was generated and re-projected to the Greek Geodetic Reference System EGSA87 (). No further processing has been performed to the specific DSM.
Reference DEM from 1/50.000 topographic maps
With satellite or aerial photo stereo-pairs Digital Surface Models can be generated, while the contours processing from topographic maps lead to Digital Terrain Models. Thus DSM refers to the earth’s surface height including all objects on it. Thus the elevation values refer to the upper tree canopy or to the roof of manmade features. In contrast to a DSM, the DTM represents the elevation of the bare ground surface without any objects like plants and buildings. As a result DSM and DTM are not directly comparable without some further processing like canopy height filtering. In arid areas like in the Cyclades islands (Myconos, Antiparos) there is a lack of high canopy and the two types could be compared. Furthermore, for the accuracy assessment, check points from the National Trigonometric Network (see next paragraph and Figures 3a, 3b and 3 c) were used. Those check points are always in flat and bare places in order to be easily detected and measured. As it can be observed in Figure 3a the check point is located at the top of an arid hill. In Figure 3b the respective check point is in the middle of a flat area with low vegetation while the other check point in Figure 3 c is in the middle of a valley with no canopy at all. Thus, we are quite sure that in the specific study the comparison of the elevation of these check points and DSM or DEM values can be accepted.
In this study the 1/50.000 topographic maps of the Hellenic Army Geographical Service that cover the study areas were used. These maps present a nominal horizontal RMSE of 12.7 meters and a nominal vertical RMSE of 6 meters. The data were in most cases extracted with photogrammetric techniques, from aerial stereo-photographs, during the 80’s. For each of the study areas DEM with a point spacing of 7.5 m was created (TOPO50 K DEM) and used for the visual comparison of the ALOS DSMs.
As a main question in similar studies is the possible misalignment between the DSMs, a co-registration methodology proposed in 2006 (Nikolakopoulos et al., Citation2006) was applied in the current study. Slope was derived for every dataset and false coloured images were created for each DSM pair (DSM+ slope). The texture introduced from slope allowed the allocation of several control points for an image-to-image co-registration, and thus all the DSMs were re-registered to each other.
Check points and statistical analysis
The accuracy of the DSMs produced by the ALOS stereopairs, the AW3D30 and the TOPO50 K DEM was assessed by comparing the elevations of Check Points, given by the Hellenic Army Geographical Service (HAGS). Those points belong to the National Trigonometric Network and they are divided into 4 classes. The horizontal and the vertical accuracy of each point independently of the class in which belongs ranges between 3 and 5 cm. Their horizontal coordinates as well as their altitude are known and measured by the HAGS. The points are sorted into classes according to their age. The trigonometric points of the first class were installed and measured, then the points of the second class were constructed in order to thicken the network and finally the points of the third and fourth class solidified and completed the trigonometric grid. The trigonometric points are located on mountain or hill peaks () in order to be visible from very long distances. presents the number of these points that were used in each study area.
The allocation of the Check Points is presented in for the study area in Chalkidiki Peninsula. The Root Mean Square Error (RMSE) is used as the metric of the elevation difference between ALOS DSMs and the reference data. The RMSE is calculated using the following formula:
Where
The statistical analysis was carried out using Excel software and the results are presented in the next session.
Figure 1. Greece and allocation of the ten ALOS PRISM triplets.
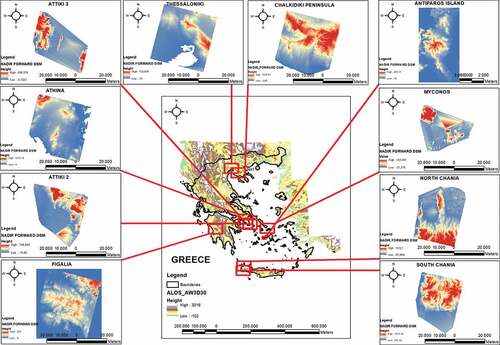
Figure 2. An example of the ALOS PRISM image processing in Leica Photogrammetry Suite.
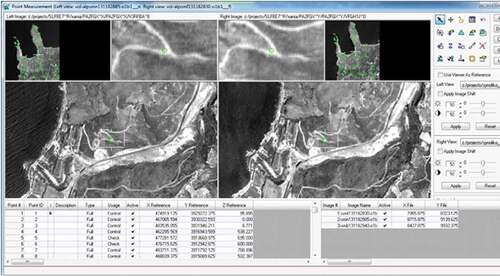
Figure 3. Three examples of the check points that belong to the National Trigonometric Network.
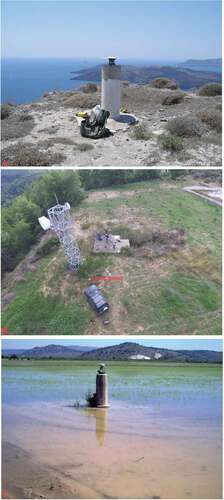
Figure 4. Example of the three DSMs derived from the ALOS triplet. Allocation of the check points over the study area in Chalkidiki Peninula, North Greece.
. The extent of each study area and the number of check points that were used in each study area.
Results
Visual comparison
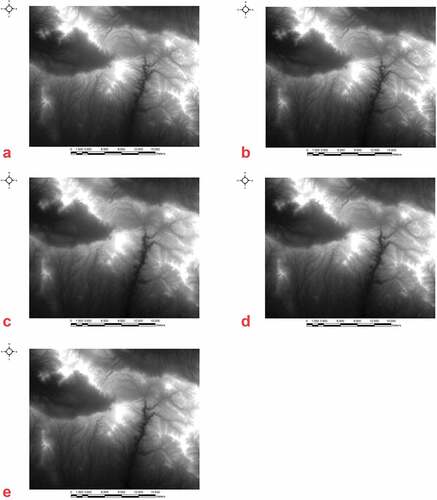
For all the study areas a first visual interpretation has been done. As the DSMs represent the terrain morphology the three DSM’s created from the ALOS stereo-pairs with classical photogrammetric techniques and the ALOS AW3D30 DSM were compared. The TOPO50 K DEM was also used for the visual comparison. In all cases the four ALOS DSMs give a quite similar representation of the relief. Furthermore all the DSMs give a quite good representation of the drainage network. In the four ALOS DSMs and the topo DEM of the Chalkidiki study area are presented. presents the ALOS AW3D30 DSM, 5B presents the TOPO50 K DEM and , and display ALOS Forward-Backward, Nadir-Forward and Nadir-Backward DSMs respectively. It is characteristic that the ALOS DSM from the Forward-Backward stereopair () gives a more blurry representation of the relief in comparison with all the other DSMs.
Figure 5. Visual Comparison of the ALOS DSMs and the TOPO50 K DEM over the Chalkidiki Peninsula study area.
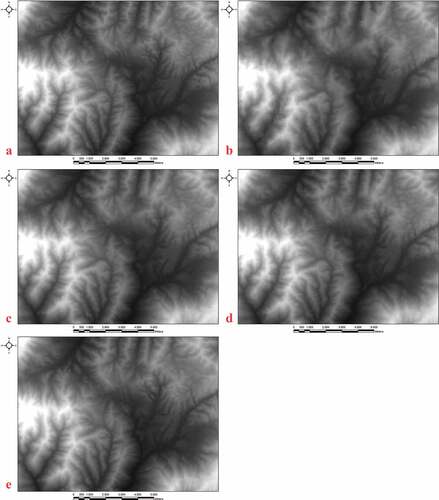
In the four ALOS DSMs and the DEM created from the digitized contours of the South Chania study area are presented. presents the ALOS AW3D30 DSM, , and display ALOS Forward-Backward, Nadir-Forward and Nadir-Backward DSMs respectively while presents the TOPO50 K DEM. .
Figure 6. Visual Comparison of the ALOS DSMs and the TOPO50 K DEM over the South Chania study area.
Check points
As described earlier a data set of control points from the National Trigonometric Network has been used to estimate the accuracy of the DSMs. A buffer zone of 7.5 meters was created around those points in order to correspond with the point spacing of the DSMs. Then the elevation difference between the control points and the relative points (pixels) of the DSMs was calculated. The RMSE values were calculated. The statistics values are presented in . It must be mentioned that in the current study the four DSMs from ALOS data are compared. The TOPO50 K DEM is only used as a reference as it is not applicable to compare DSMs to DEMs even if the ground control points are usually located in flat and no vegetated areas even in the mountains (Figure 3).
Table 2. Elevation difference between check points and the respective pixels in the DSMs (values in meters) for all the study areas.
As it can be observed in AW3D30 DSM presents the lower RMSE in all the study areas. In general, the ALOS DSMs from PRISM data have presented twice or three times higher RMSE. The lower RMSE for all the DSMs is presented in Antiparos Island where the relief is quite low. The higher RMSE for all the DSMs is presented in Attiki Peninsula where the main land use is urban and in Crete where relief is quite complex. These results are in full accordance with the derives from previous studies (Aldosari and Jacobsen Citation2019; Bayburt et al., Citation2017). In those studies, it is proved that the DSMs created from remote sensing data are strongly depended on the terrain inclination, roughness and land cover. The outcomes of these studies (Aldosari and Jacobsen Citation2019; Bayburt et al., Citation2017) justify our results. In areas with low relief like Antiparos or Myconos Islands the accuracy of all the DSMs () is better than in areas in Crete or in Peloponnese where the relief is high and the inclination is also quite high. Bayburt et al., 2017 suggested that the comparison of height model accuracy should be performed in areas with inclination below 10%.
Another very important remark is that in all the study areas the DSMs from the ALOS Forward-Backward stereopair present the worst accuracy. According to its Base-to-Height-ratio (1) the specific stereopair should present the higher accuracy compared to the others that have a lower (0.5) Base-to-Height-ratio. It is characteristic that the DSM from the specific stereopair has four times higher RMSE compared to the AW3D30 in the case of Figalia. The RMSE of the AW3D30 is 5.4 m while the respective error from the ALOS Forward-Backward stereopair rises up 20.53 m.
The influence of the Base-to-Height-ratio was discussed in a previous study (Sefercik, U.G., Buyuksalih, G., Jacobsen, K. et al. DSM Quality of Korean Satellite KOMPSAT-3 in Comparison to AW3D30 and Sentinel-1A in Respect of Airborne Laser Scanning, KSCE J Civ Eng, Citation2019). As it was proved in that study, the combination of the forward and backward cameras of PRISM has a height to base relation of 1.0, corresponding to a very large angle of convergence which is optimal for open and flat areas. In mountainous areas with complex relief and high inclination the large Base-to-Height-ratio usually provokes matching problems between the forward and the backward images as the relief representation is too different due to the totally different angle of image acquisition. Thus, in mountainous and urban areas, the combination of the inclined cameras and the nadir cameras are used together to reduce problems (Sefercik, U.G., Buyuksalih, G., Jacobsen, K. et al. DSM Quality of Korean Satellite KOMPSAT-3 in Comparison to AW3D30 and Sentinel-1A in Respect of Airborne Laser Scanning, KSCE J Civ Eng, Citation2019).
. The elevation difference between the check points and the respective pixels in the DSMs are presented. The elevation values are in meters for all the study areas.
Discussion
The aim of the current study was to enrich the knowledge on the vertical accuracy of DSMs created from ALOS optical data. In general the study focused in two major objectives: To assess the vertical accuracy of the freely available AW3D30 DSM and to examine the usefulness of the three stereopairs in each ALOS PRISM scene.
ALOS AW3D30 DSM proved to be better in vertical accuracy than the DSMs created from ALOS PRISM triplets with classical photogrammetric techniques. In all the study areas the vertical accuracy of the AW3D30 DSM is two to three times better than the respective accuracy of the DSMs derived from PRISM data with classic photogrammetry. It is remarkable that AW3D30 presents higher accuracy despite the fact that it has worst point spacing. The ALOS AW3D30 has a point spacing of 30 meters while the DSMs created from ALOS PRISM triplets with classical photogrammetric techniques have a point spacing of 7.5 meters. JAXA developed the AW3D DSM dataset that was consisting of digital elevation model (DEM) or digital surface model (DSM) that can represent land terrains with approx. 5-meter in spatial resolution and 5 meters in target height accuracy (standard deviation). Then, JAXA down sampled the original height model and released “ALOS World 3D-30 m (AW3D30)”, the global DSM dataset with a horizontal resolution of approx. 30-meter mesh. Despite the pixel down sampling the AW3D30 DSM seems to keep a lot of information derived from the original PRISM data sets. As discussed in another study (Sefercik, U.G., Buyuksalih, G., Jacobsen, K. et al. DSM Quality of Korean Satellite KOMPSAT-3 in Comparison to AW3D30 and Sentinel-1A in Respect of Airborne Laser Scanning, KSCE J Civ Eng, Citation2019) although it is resampled from 30 m, with the advantage of 2.5 m ALOS Prism stereo images, AW3D30 DSM gives more information about the objects in comparison with DSM created from Sentinel 1-A images with interferometric processing.
In general the vertical accuracy of ALOS AW3D30 varies according to the relief and landuse. In flat areas or in areas with low relief like in Antiparos Island the vertical RMSE is less than 3 m. In urban areas, such as in Attiki Peninsula or in areas with complex relief, such as the broader area of Chania in Crete, the RMSE rises up to 12 or to 14 m. These results are in full accordance with previous studies (Aldosari and Jacobsen Citation2019; Bayburt et al., Citation2017) proving that the DSMs created from satellite data are strongly influenced by terrain inclination, roughness and land cover.
In the urban area of Athens the ALOS AW3D30 RMSE rises up to 12.04 m due to alternation of high and low buildings, the existence of very narrow roads in the shade of high buildings, and the existence of moving targets (cars, buses, trucks) causing problems in the correlation of stereo pairs. Panagiotakis et al. (Citation2018) have reached in a similar result for urban area of Athens using Pleiades triplet images. However, in general, its accuracy is quite good and as it is mentioned in a recent manuscript, AW3D30 is the most suitable open DSM for digital building height generation and for observing buildings taller than 9 m in height (Misra et al., Citation2018).
In general the results of the current study are in full accordance with several previous studies. In one of the first attempts to assess AW3D30 accuracy, the height accuracy (RMSE) was calculated at 4.40 m (Tadono et al., Citation2016). The specific results were extracted from 5,121 CPs distributed in 127 tiles. Florinsky et al., (Citation2018) demonstrated that the AW3D30 DSM is characterized by the maximum accuracy and represents best real topography among the freely available DSMs. The vertical accuracy of AW3D30 was calculated at 7.67 m. Hu et al. (Citation2017) found out that the vertical accuracy varies in terms of terrain complexity, from 5 m in flat areas to 20 m in mountains. In the same study it has also been proved that large elevation differences over forest areas are likely, due to canopy coverage. It was also proved that AW3D30 accuracy is in general positively related to the stack number of the PRISM scenes. In another study (Grohmann, Citation2018) it was proved that in open areas ALOS AW3D30 can be comparable to TanDEM-X, visually but it also shows mismatch between adjacent scenes and has large areas of voids, caused by cloud coverage in the original imagery. Caglar et al. (Citation2018) found out that AW3D30 has a remarkably low root mean square error (RMSE) of 1.78 m (one sigma). Sefercik, U.G., Buyuksalih, G., Jacobsen, K. et al. DSM Quality of Korean Satellite KOMPSAT-3 in Comparison to AW3D30 and Sentinel-1A in Respect of Airborne Laser Scanning, KSCE J Civ Eng (Citation2019) demonstrated that the absolute vertical accuracies and morphologic details of AW3D30 are superior to those of S-1A and SRTM. AW3D30 was found to be more accurate compared to other freely available DSMs and to CartoDEM-V3.1 (Jain et al., Citation2017). In full accordance with the current paper the analysis of the landuse effect on AW3D30 vertical accuracy, showed that errors are larger in an urban settlement than agriculture or mountainous forest areas (Jain et al., Citation2017). In another study over Greece (Stamatiou et al., Citation2018), the AW3D30 RMSE was calculated at 8.75 meters, an error value that is very close to the RMSE measured in the current paper (8.58).
The results of the seven study areas in Greece are in accordance with the results of previous study inside the Istanbul metropolitan area in Turkey. In that study ALOS DSM produced very good results, specifically compared to other freely available DSMs (Alganci et al., Citation2018). Although the ALOS DSM had a 30 m grid spacing, it could be deduced that this was due to the acquisition of strong signals from the original 5 m DSM, which was produced from the 2.5 m images. The RMSE was calculated to 5.91 m while the respective error of the high resolution DSMs (SPOT 6 and Pleiades) was 4.23 and 5.09 respectively (Alganci et al., Citation2018).
The general usefulness of AW3D30 has been revealed and Jacobsen (Citation2016) has proposed the use of AW3D30 instead of SRTM DEM for the analysis and correction of systematic DSM errors in products derived from ZY3, Pleiades 1A and Cartosat-1 stereo images. As discussed in (Jacobsen, Citation2018) the use of AW3D30 is proposed; it is newer as the SRTM DSM and in addition slightly more accurate (Bayburt et al., Citation2017).
Furthermore, the statistical analysis presented in the previous section demonstrated that the DSM from the F_B stereo pair, presents lower vertical accuracy than the other two DSMs generated from the N_F and N_B stereopairs. The mean RMSE of the ALOS F_B stereopair for the seven study areas in Greece is 27.6 m while the respective errors for the N_F and N_B stereopairs are around 18.2 m. This is in total accordance with a previous study presented in 2008 by J. Takaku et al. (Citation2008) and in contrary to another study presented by Maruya and Ohyama (Citation2007). J. Takaku et al. (Citation2008) have calculated DSM accuracies of six scene sets of triplet stereo pair images for nine reference sites. The generated DSM height accuracies varied from 4 to 5 m for flat areas, between 5 and 7 m for various terrain mixed areas, between 5 and 6 m for mountainous areas and from 6 to 8 m for steep areas. It is worth mentioning that in the specific study they concluded that the Nadir-Forward and Nadir-Backward stereopairs present the best accuracy from the different stereo matching image pair comparisons. In contrary Maruya and Ohyama (Citation2007) mentioned that in their study the forward-backward image pair of the PRISM images generated the most precise results and they attributed that result to the better B/H ratio of the specific stereopair as in general, image pair of high B/H ratio produces precise height data. The B/H ratio of the F_B pair is twice as large as that of another image pair. Hasegawa et al. (Citation2000) have investigated which is the adequate B/H ratio with aerial photos and digital photogrammetric instruments. When the B/H ratio is lower than 0.5, the height accuracy decreases as the B/H ratio decreases. When the B/H ratio is higher than 1.0, on the other hand, the height accuracy also decreases as the B/H ratio increases. As a result, the B/H ratio ranging from 0.5 to 0.9 is the best value for automatic DEM creation from stereo pair. As all the B/H values of the ALOS Prism stereopairs are very close to the ideal according to Hasegawa et al. (Citation2000) it seems that the vertical accuracy is influenced more by other factors such as the correlation success between the stereoimages.
The stereo image correlation could also explain the superiority of ALOS AW3D30 DSM to the DSMs created from one ALOS PRISM steropairs that was proved in the current manuscript. The ALOS AW3D30 DSM is created using all the available cloud free ALOS PRISM scenes over an area. As described in Tadono et al. (Citation2016) the high accuracy of AW3D30 is achieved by stack processing using multi-temporal acquired scenes of DSM to reduce uncertainty, cloud covers, and noises. It is characteristic that for the AW3D30 DSM of the broader area of Figalia, fifty five (55) ALOS scenes were processed. In general for the ten areas studied in the current paper the number of the ALOS PRISM stacks varies between thirty four (34) for Chania to ninety six (96) for Myconos Island. The number of the scenes used for the automatic DSM generation is higher in Cyclades Island in comparison with the mainland. In contrary we used only two triplets for the creation of the DSM with classical photogrammetric techniques. Thus, it is quite sure that the increased number of processed triplets increases the correlation between the stereopairs and increase the accuracy of the DSM. The same outcome was mentioned in previous studies (Hu et al., Citation2017; Tadono et al., Citation2016). As mentioned in previous study (Jacobsen, Citation2018) AW3D30 is using all available ALOS PRISM images, reducing the probability of systematic errors of the reference height model. For every AW3D30 DSM the number of the used triplets is written in the metadata and more precisely in a text file called LST.
Conclusions
This research has focused on the statistical analysis of the vertical accuracy of DSMs derived from ALOS optical data. The freely available AW3D30 DSM was compared to DSMs created from ALOS PRISM triplets with classical photogrammetry. The accuracy assessment has been performed as a function of the automatic or not way of creation, the different B/H ratios between the three stereo pairs and different characteristics such as the elevation and the land-use. A detailed statistical analysis was performed using ten different ALOS scenes, 1140 control points of certified elevation and a respective DEM from digitized contours.
It has been proved that the freely available AW3D30 DSM presents two or three times lower RMSE than the respective DSMs from ALOS PRISM images. The mean RMSE for ten areas over Greece was measured at 8.58 meters and that the error is higher in mountainous areas due to the vegetation canopy, to the more complex relief and/or to the inclination and in cities such as Athens due to the existence of millions of buildings.
It became evident that the processing of all the available ALOS PRISM scenes for the creation of ALOS AW3D30 DSM increases the possibility of high correlation between the stereoimages in comparison to the classical use of only two stereoimages. Thus, there is no need to process with photogrammetric techniques the ALOS PRISM raw data as the freely available AW3D30 presents better accuracy. An outcome of the current paper could be summarized as follows: For general mapping purposes or for the no photogrammetry specialists the use of the ALOS AW3D30 DSM is recommended instead of the more time consuming photogrammetric processing of ALOS Prism triplets. In this way, a gain of five days work is sure for the researchers. Two or three days in the field collecting GCPs and one to two days in the office processing the PRISM data is a serious drawback of the classic photogrammetric procedure.
It has also been proved that the better Base-to-Height-ratio of the Forward-Backward stereopair doesn’t guarantee the higher vertical accuracy of the respective DSM. In open and flat areas the increase to the Base-to-Height-ratio is optimal but not in mountainous areas with complex relief. In such areas the DSMs from the Nadir-Forward and Nadir-Backward stereopars present higher vertical accuracy even if their Base-to-Height-ratio is lower.
In the near future, we will proceed to a more sophisticated analysis of the ALOS DSMs based on criteria like inclination, terrain roughness and land use.
Acknowledgments
ALOS/PRISM acquisitions were provided by ESA under the PI project 6554. ALOS AW3D30 DSM was provided by Japan Aerospace Exploration Agency (© JAXA).
Disclosure statement
No potential conflict of interest was reported by the author.
References
- Aldosari, A. A., & Jacobsen, K. (2019). Quality of Height Models Covering Large Areas. PFG (Journal of Photogrammetry, Remote Sensing and Geoinformation Science) 87, 177–190 . Springer publications. . https://doi.10.1007/s41064-019-00072-1
- Alganci, U., Besol, B., & Sertel, E. (2018). Accuracy assessment of different digital surface models. ISPRS International Journal of Geo-Information, 7(3), 114. https://doi.org/10.3390/ijgi7030114,
- Bayburt, S., Kurtak, A. B., Büyüksalih, G., & Jacobsen, K. (2017). Geometric accuracy analysis of World-DEM in relation to AW3D30, SRTM AND ASTER GDEM2, Int. arch. photogramm. remote sens. Spatial Information Science, XLII-1/W1, 211–217. https://doi.org/10.5194/isprs-archives-XLII-1-W1-211-2017
- Bignone, F. and H. Umakawa. (2008) Assessment of ALOS PRISM digital elevation model extraction over Japan, The International Archives of the Photogrammetry, Remote Sensing and Spatial Information Sciences. Vol. XXXVII. Part B1. Beijing 2008
- Caglar, B., Becek, K., Mekik, C., & Ozendi, M. (2018). On the vertical accuracy of the ALOS world 3D-30m digital elevation model. Remote Sensing Letters, 9(6), 607–615. https://doi.org/10.1080/2150704X.2018.1453174
- Capaldo, P. (2012). DSM generation from high resolution imagery: Applications with worldview-1 and geoeye-1. Italian Journal of Remote Sensing, 44(1), 41–53. https://doi.org/10.5721/ItJRS20124414
- De Carvalho Júnior, O. A., Guimarães, R. F., Montgomery, D. R., Gillespie, A. R., Gomes, R. A. T., Martins, É. D. S., & Silva, N. C. (2014). Karst depression detection using ASTER, ALOS/PRISM and SRTM-derived digital elevation models in the Bambuí group, Brazil. Remote Sensing, 6(1), 330–351. https://doi.org/10.3390/rs6010330
- Florinsky, I. V., Skrypitsyna, T. N., & Luschikova, O. S. (2018). Comparative accuracy of the AW3D30 DSM, ASTER GDEM, and SRTM1 DEM: A case study on the ZAOKSKY TESTING GROUND, CENTRAL EUROPEAN RUSSIA, Remote Sensing Letters. 9(7), 706–714. https://doi.org/10.1080/2150704X.2018.1468098
- Grohmann, C. H. (2018). Evaluation of TanDEM-X DEMs on selected Brazilian sites: Comparison with SRTM, ASTER GDEM and ALOS AW3D30. Remote Sensing of Environment, 212(2018), 121–133. https://doi.org/10.1016/j.rse.2018.04.043
- Gruen, A., & Wolff, K. (2007). DSM generation with ALOS/PRISM data using SAT- PP. In International Geoscience and Remote Sensing Symposium (IGARSS), Barcelona, Spain, pp. 3606–3609. https://doi.org/10.1109/IGARSS.2007.4423626
- Hasegawa, H., Matsuo, K., Koarai, M., Watanabe, N., & Masaharu, H. (2000). Dem accuracy and the base to height (B/H) ratio of stereo images. International Archives of Photogrammetry and Remote Sensing, XXXIII, 356–359. https://www.isprs.org/proceedings/XXXIII/congress/part4/356_XXXIII-part4.pdf
- Hashimoto, T. RPC model for ALOS/PRISM images,” geoscience and remote sensing symposium, 2003. IGARSS ‘03. Proceedings. 2003 IEEE International, 3, 1861–1863. https://doi.org/10.1109/IGARSS.2003.1294274
- Hobi, M. L., & Ginzler, C. (2012). Accuracy assessment of digital surface models based on worldview-2 and ADS80 stereo remote sensing data. Sensors, 12(5), 6347–6368. https://doi.org/10.3390/s120506347
- Hu, Z., Peng, J., Hou, Y., & Shan, J. (2017). Evaluation of recently released open global digital elevation models of Hubei, China. Remote Sensing, 9(3), 262. https://doi.org/10.3390/rs9030262
- Jacobsen, K. (2016). Analysis and correction of systematic height model errors, int. arch. photogramm. remote sens. Geo-spatial Information Science, XLI-B1, 333–339. https://doi.org/10.5194/isprs-archives-XLI-B1-333-2016
- Jacobsen, K. Systematic geometric image errors of very high resolution optical satellites the international archives of the photogrammetry, remote sensing and spatial information sciences, volume XLII-1, 2018 ISPRS TC I mid-term symposium “innovative sensing – from sensors to methods and applications”, 10–12 October 2018 https://doi.org/10.5194/isprs-archives-XLII-1-233-2018
- Jain, A. O., Thaker, T., Chaurasia, A., Patel, P., & Singh, A. K. (2017). Vertical accuracy evaluation of SRTM-GL1, GDEM-V2, AW3D30 and CartoDEM-V3.1 of 30-m resolution with dual frequency GNSS for lower tapi basin india. Geocarto International 33:11, 1237-1256. https://doi.org/10.1080/10106049.2017.1343392
- Koarai, M., Fukushima, Y., Watanabe, N., & Iida, Y. (2000). Topographical mapping using ALOS satellite imagery. IGARSS 2000. IEEE 2000 international geoscience and remote sensing symposium. taking the pulse of the planet: the role of remote sensing in managing the environment. Proceedings (Cat. No.00CH37120), 6, 2406–2408. Honolulu, Hawaii, USA. https://doi.org/10.1109/IGARSS.2000.859590.
- Lamsal, D., Sawagaki, T., & Watanabe, T. (2011). Digital terrain modelling using Corona and ALOS PRISM data to investigate the distal part of imja glacier, khumbu himal, Nepal. Journal of Mountain Science, 8(3), 390–402. https://doi.org/10.1007/s11629-011-2064-0
- Lee, H.-Y., Kim, T., Park, W., & Lee, H.-K. (2003). Extraction of digital elevation models from satellite stereo images through stereo matching based on epipolarity and scene geometry. Image and Vision Computing, 21(9), 789–796. https://doi.org/10.1016/S0262-8856(03)00092-1
- Liu, J.-K., Chang, K.-T., Lin, C., & Chang, L.-C. (2015). Accuracy evaluation of ALOS DEM with airborne LiDAR data in Southern Taiwan. EEE International Geoscience and Remote Sensing Symposium (IGARSS), Milan, 2015, pp. 3025-3028 https://doi.org/10.1109/IGARSS.2015.7326453.
- Maruya, M., & Ohyama, H. (2007). Estimation of height measurement accuracy for ALOS PRISM triplet images. In International Geoscience and Remote Sensing Symposium (IGARSS), Barcelona, Spain, (pp. 2869–2872). https://doi.org/10.1109/IGARSS.2007.4423442.
- Maruya, M., & Ohyama, H. (2008). Accurate dem and ortho-rectified image production from alos/prism. In International Geoscience and Remote Sensing Symposium (IGARSS), Boston, Massachusetts, USA. https://doi.org/185–188).doi:10.1109/IGARSS.2008.4778824.
- Misra, P., Avtar, R., & Takeuchi, W. (2018). Comparison of digital building height models extracted from AW3D, TanDEM-X, ASTER, and SRTM digital surface models over Yangon City. Remote Sensing, 10(12), 2008. https://doi.org/10.3390/rs10122008
- Nikolakopoulos, K. G., & Chrysoulakis, N. (2006). Updating the 1:50.000 topographic maps using ASTER and SRTM DEM. The Case of Athens, Greece. Proc. SPIE 6366, Remote Sensing for Environmental Monitoring, GIS Applications, and Geology VI, 6366061. https://doi.org/10.1117/12.689016
- Nikolakopoulos, K. G., Kamaratakis, E. K., & Chrysoulakis, N. (2006). SRTM vs ASTER Elevation Products. Comparison for two Regions in Crete, Greece. International Journal of Remote Sensing, 0143-1161. 27(21), 4819–4838. 10 November 2006. https://doi.org/10.1080/01431160600835853
- Nikolakopoulos, K. G., & Vaiopoulos, A. D. (2011). Validation of ALOS DSM. Proceedings of SPIE 8181 Earth Resources and Environmental Remote Sensing/GIS Applications II, 818103. https://doi.org/10.1117/12.898382
- Nikolakopoulos Konstantinos, G., Vaiopoulos, A. D., & Tsombos, P. I. (2010). DSM from ALOS data: The case of andritsena, Greece. Proc. Of SPIE 7831 Earth Resources and Environmental Remote Sensing/GIS Applications, 78310K. https://doi.org/10.1117/12.864443
- Panagiotakis, E., Chrysoulakis, N., Charalampopoulou, V., & Poursanidis, D. (2018). Validation of pleiades tri-stereo DSM in urban areas. ISPRS International Journal of Geo-Information, 7(3), 118. https://doi.org/10.3390/ijgi7030118
- Poli, D., & Caravaggi, I. (2013). 3D modeling of large urban areas with stereo VHR satellite imagery: Lessons learned. Natural Hazards, 68(1), 53–78. https://doi.org/10.1007/s11069-013-0583-4
- Poli, D., & Toutin, T. (2012). Review of developments in geometric modelling for high resolution satellite pushbroom sensors. The Photogrammetric Record, 27(137), 58–73. https://doi.org/10.1111/j.1477-9730.2011.00665.x
- Santillan, J. R., & Makinano-Santillan, M. (2016). Vertical accuracy assessment of 30-M resolution ALOS, ASTER, and SRTM global DEMS over northeastern mindanao, philippines, int. arch. photogramm. The International Archives of the Photogrammetry, Remote Sensing and Spatial Information Sciences, Volume XLI-B4, 2016 XXIII ISPRS Congress, 12–19 July 2016, Prague, Czech Republic. https://doi.org/10.5194/isprs-archives-XLI-B4-149-2016
- Sefercik, U. G., Buyuksalih, G., Atalay, C., Jacobsen K. (2018). Validation of sentinel-1A and AW3D30 DSMs for the metropolitan area of istanbul, Turkey. PFG Journal of Photogrammetry, Remote Sensing and Geoinformation Science, 86(3-4), 1–15. https://doi.org/10.1007/s41064-018-0054-3.
- Sefercik, U.G., Buyuksalih, G., Jacobsen, K. et al. DSM Quality of Korean Satellite KOMPSAT-3 in Comparison to AW3D30 and Sentinel-1A in Respect of Airborne Laser Scanning, KSCE Journal of Civil Engineering(2019) 23: 3162. https://doi.10.1007/s12205-019-2462-3
- Stamatiou, C. C., Liampas, S.-A. G., & Drosos, V. C., (2018) Vertical accuracy comparison of ALOS AW3D30 DSM and trigonometric survey points,” Proc. SPIE 10773, Sixth International Conference on Remote Sensing and Geoinformation of the Environment (RSCy2018), 107731M. Paphos, Cyprus.
- Suzuki, S. (2003). Level 1 data processing algorithm for ALOS PRISM and AVNIR-2. IGARSS . 20032003 IEEE International Geoscience And Remote Sensing Symposium Proceedings (IEEE Cat. No.03CH37477), 3(C), 7929–7931. https://doi.org/10.1109/IGARSS.2003.1294268
- Tadono, T., Nagai, H., Ishida, H., Oda, F., Naito, S., Minakawa, K., & Iwamoto, H. (2016). Generation of the 30 M-Mesh global digital surface model by ALOS PRISM. The International Archives of the Photogrammetry, Remote Sensing and Spatial Information Sciences, Volume XLI-B4, 2016 XXIII ISPRS Congress, 12–19 July 2016, Prague, Czech Republic. https://doi.org/10.5194/isprs-archives-XLI-B4-157-2016,
- Tadono, T., Shimada, M., & Matsuoka, M. (2003). Preliminary study for evaluating geometric accuracy of ALOS/PRISM. IGARSS . 20032003 IEEE International Geoscience and Remote Sensing Symposium Proceedings (IEEE Cat. No.03CH37477), 3(C), 1855–1857. https://doi.org/10.1109/IGARSS.2003.1294272
- Takaku, J., Futamura, N., Iijima, T., Tadono, T., & Shimada, M. (2007). High resolution DSM generation from ALOS PRISM. In International Geoscience and Remote Sensing Symposium (IGARSS) (pp. 1974–1977), Barcelona, Spain. https://doi.org/10.1109/IGARSS.2007.4423215
- Takaku, J., Futamura, N., Iijima, T., Tadono, T., & Shimada, M. (2011). High resolution dsm generation from alos prism - archiving and mosaicking -. International Geoscience and Remote Sensing Symposium (IGARSS), Vancouver, Canada, 4336–4339.
- Takaku, J., & Tadono, T., (2017). Quality updates of ‘AW3D’ global DSM generated from ALOS PRISM, 2017 IEEE International Geoscience and Remote Sensing Symposium (IGARSS), Fort Worth, TX, 2017, pp. 5666–5669. https://doi.org/10.1109/IGARSS.2017.8128293
- Takaku, J., Tadono, T., & Shimada, M. (2008). High Resolution DSM Generation from ALOS PRISM - CALIBRATION UPDates-. In IGARSS 2008-2008 IEEE International Geoscience and Remote Sensing Symposium (Vol. 2, pp. 181–184), Fort Worth, Texas, USA. https://doi.org/10.1109/IGARSS.2008.4778823
- Toutin, T. (2001). Elevation modelling from satellite vir data: a review. International Journal of Remote Sensing, 22(6), 1097–1125. https://doi.org/10.1080/01431160117862
- Toutin, T. (2004). Geometric processing of remote sensing images: Models, algorithms and method. International Journal of Remote Sensing, 25(10), 1893–1924. https://doi.org/10.1080/0143116031000101611
- Yap, L., Kandé, L. H., Nouayou, R., Kamguia, J., Ngouh, N. A., & Makuate, M. B. (2018). Vertical accuracy evaluation of freely available latest high-resolution (30m) global digital elevation models over Cameroon (Central Africa) with GPS/leveling ground control points. International Journal of Digital Earth, 12(5), 500-524. https://doi.org/10.1080/17538947.2018.1458163