
 ?Mathematical formulae have been encoded as MathML and are displayed in this HTML version using MathJax in order to improve their display. Uncheck the box to turn MathJax off. This feature requires Javascript. Click on a formula to zoom.
ABSTRACT
The information in hyperspectral images usually has a strong correlation, a large number of bands, which lead to the “curse of dimensionality”. So, band selection is usually used to address this issue. However, problems remain for band selection, such as how to search for the most informative bands, and how many bands should be selected. In this paper, a cuckoo search (CS)-based adaptive band selection framework is proposed to simultaneously select bands and determine the optimal number of bands to be selected. The proposed framework includes two “cuckoo search”, i.e. the outer one for estimating the optimal number of bands and the inner one for the corresponding band selection. To avoid employing an actual classifier within CS so as to greatly reduce computational cost, minimum estimated abundance covariance (MEAC) and Jeffreys-Matusita (JM) distance are adopted as criterion functions, which measures class separability. For the experiments, two widely used hyperspectral images, which acquired by the Hyperspectral digital imagery collection experiment (HYDICE) and the airborne Hyperspectral Mapper (HYMAP) system, are adopted for performance evaluation. The experimental results show that the two-CS-based algorithm outperforms the popular sequential forward selection (SFS), sequential floating forward search (SFFS), and other similar algorithms for hyperspectral band selection.
Introduction
Hyperspectral remote sensing, with its high spectral resolution and wide range of spectral range, can provide more discriminative spectral information for target detection and classification. However, the continuous spectral information in hyperspectral images usually has a strong correlation, a higher band number, which will lead to the “curse of dimensionality.” Dimensionality reduction (DR) has been commonly used to address this issue (Chang, Citation2003; Sun & Du, Citation2019). Dimensionality reduction can be achieved by a transform-based approach, such as PCA, or a band-selection method. Band selection may be preferred when physical meaning of bands needs to be maintained.
Band selection can be conducted either supervisedly or unsupervisedly (Chang, Citation2003; Wan et al., Citation2020). When class information is known, supervised band selection can be adopted to preserve the desired object information. Many supervised band-selection algorithms calculate class separability when a subset of bands is selected; class separability may be measured with Euclidean distance, Bhattacharyya distance, Jeffreys-Matusita (JM) distance, or some divergence measures (Bioucas-Dias et al., Citation2013; Chang, Citation2013; Ifarraguerri, Citation2004; Keshava, Citation2004; Martínez-UsóA Pla et al., Citation2007); and the band subset that yields the largest class separability will be selected. In this case, class samples are usually required to examine class statistics. However, in practice, it may be difficult to obtain enough training samples; instead, it may be possible to have only a spectral signature for each class (Du & Yang, Citation2008). A simple but effective method has been proposed to use class spectral signatures for band selection, referred to as minimum estimated abundance covariance (MEAC) (Yang et al., Citation2011).
Class separability measurement is one of the important issues for supervised band selection. However, for band selection, the search strategy is also critical in order to speed up the efficiency of the algorithm. Sequential forward search (SFS) and sequential floating forward search (SFFS) methods are widely used methods (Pudil et al., Citation1994; Yang et al., Citation2011), which are to search an additional band based on the bands that have been selected. However, the issue with the SFS is that once a feature is added to the final set of features, it cannot be removed; also, it is sensitive to the initial condition. For SFFS, it allows for removing once selected features, but its computational cost is much higher than SFS. Recently, heuristic optimization algorithm has been successfully utilized for band selection issues (Nakamura et al., Citation2014). For example, a band reduction method based on genetic algorithm (GA) and spatial clustering has been proposed (Paul et al., Citation2015), a particle swarm optimization (PSO)-based dimensionality reduction approach is proposed with MEAC criterion function (Yang et al., Citation2012), a firefly algorithm (FA) inspired band selection and optimized extreme learning machine (ELM) for hyperspectral image classification is proposed (Su et al., Citation2017). The heuristic algorithm has shown impressive ability for band selection.
Recently, as a new heuristic algorithm, cuckoo search algorithm (CS) (X Yang et al., Citation2009) has been used for function optimization, engineering optimization, feed-ward neural network training, etc. (Gao et al., Citation2019; Valian et al., Citation2013; Yildiz, Citation2012; Zheng & Zhou, Citation2012). CS has the advantage of few parameters, simple calculation, and have been reported for hyperspectral band selection (Medjahed et al., Citation2015; Shrutika et al., Citation2019). Such a method with global searching capability can generally offer better performance since all the bands to be selected are determined simultaneously, CS provides a new tool for search strategy of hyperspectral band selection.
The last issue for hyperspectral band selection is that how to determine the number of bands to be selected. Some researches take intrinsic dimensionality (ID) (Fukunaga, Citation1982) as the number of bands to be selected, which in fact is the minimal number of parameters to characterize data. Furthermore, a new term called as virtual dimensionality (VD) (Chang & Du, Citation2004), which is the number of spectrally distinct signatures present in hyperspectral imagery (Chang, Citation2018), also can not consider as the number of bands to be selected. In this paper, we propose a new CS system that can determine this critical number near automatically. It employs two cuckoos: the outer one for estimating the optimal number of bands and the inner one for the corresponding band selection. The proposed system is referred to as 2CS to distinguish it from the typical 1CS system that requires fixing the number of bands to be selected. To avoid employing an actual classifier within CS so as to greatly reduce computational cost, minimum estimated abundance covariance (MEAC) and Jeffreys-Matusita (JM) distance are adopted as criterion functions, which can measure class separability.
The main contributions and novelty of this paper are as follows. (1) A cuckoo search (CS)-based adaptive band selection framework is proposed to simultaneously select bands and determine the optimal number of bands to be selected. (2) Two “cuckoo search” are included in the proposed method, the outer one is for estimating the optimal number of bands, and the inner one is for the corresponding band selection. (3) Furthermore, minimum estimated abundance covariance (MEAC) and Jeffreys-Matusita (JM) distance are adopted as criterion functions to avoid employing an actual classifier within CS.
The remainder of this paper is organized as follows. The band selection methods are introduced in Section II. In Section III, the new cuckoo search-based band selection algorithm is proposed. The experimental results and discussions are presented with two hyperspectral data sets in Section IV, and conclusions are drawn in Section V.
Related works
Cuckoo search
The CS is a new population-based metaheuristic search optimization algorithm (X Yang et al., Citation2009), which is based on the breeding pattern of cuckoos. Cuckoos lays its eggs in a randomly chosen other host birds nest. The host bird may detect the presence of alien egg in its nest and may throw the egg or just vacate the nest. The CS algorithm is based on the following three idealized rules: 1) Each cuckoo only lays one egg at a time, and dumps its egg in randomly chosen nest; 2) The best nests with high quality of eggs will carry over to the next generation; 3) The number of available host nests is fixed, and the egg laid by a cuckoo is discovered by the host bird with a probability.
Cuckoo follows Levy Flight probability distribution to search for new nest, and CS algorithm based on Levy Flight helps to locate the optimized cluster head and Levy Flight speeds up the local search which also ensures that it covers output. Based on these three rules, CS includes four steps, initialization, search, selection and judgment.
Step 1: Initialization. Randomly initialize the positions of N nest , calculate their object values F0
, and choose the best position.
Step 2: Search. Generate new positions in the Levy flight method , calculate their object values Ft
and choose the best position again. Levy flight generally uses random walk strategy as in (1)
where is the ith solution in generation t;
is the current best solution;
is the step size constant which depends upon the type of problem of interest, generally
; u and v are standard normal random variables; β is the control factor of Lévy flight, generally β
= 1.5; the Levy flight is basically a random walk in which the random step length is evaluated from Levy distribution for large steps.
uses (2) to express.
Step 3: Selection. Discard bad positions in discovery probability Pa, and use (3) to generate the same number of new positions. Calculate their object values Ft , and choose the best position again.
where r is the scaling factor, which is a standard normal random variable; and
are two random solutions in generation t.
Step 4: Ending judgment. If the iterative termination conditions are satisfied, then stop the algorithm, or return to (2). Here, the consecutive jumps or steps of a cuckoo essentially form a random walk process that obeys the power law step-length distribution with a heavy tail.
The CS not only uses the Lévy flight method, but also introduces the elitist reservation strategy. Local search and global search are well combined in CS. The selection step increases the position diversity so that to avoid the local optimum solution.
Band selection techniques
Criterion function (class separability) and search strategy are important issues for supervised band selection. In this section, the search strategies and criteria are introduced.
For band selection, a search strategy is usually adopted to avoid testing all of the possible combinations. SFS is widely used due to its simplicity and computational efficiency (Pudil et al., Citation1994; Yang et al., Citation2011). However, its disadvantage is that it is sensitive to the initial condition. Another more advanced searching strategy is SFFS (Pudil et al., Citation1994; Yang et al., Citation2011), it includes a backward procedure to ensure the current is optimal. However, its computational cost is much higher than SFS due to the backward procedure.
Besides search strategy, criterion function is also the critical issue for band selection. Some information measurement can be used in criterion function. Here, the minimum estimated abundance covariance (MEAC) (Yang et al., Citation2011) and JM distance (Chang, Citation2003) can be used in our paper. The MEAC method does not need training samples; all it needs are the class signatures. In addition, it does not need to examine the entire bands or band combination schemes. For the JM method, class samples are required such that class means and covariance matrices can be reliably estimated.
Nested cuckoo search-based band selection
In conjunction with an appropriate searching criterion, the CS-based band selection can offer the best band subset among the existing methods. In this paper, we propose a nested CS-based adaptive band selection framework to solve both the optimal number of bands and the corresponding bands simultaneously.
Improved cuckoo search for predetermined band selection
CS searches the solution space by starting from randomly distributed nests. Here, possible solutions (i.e., selected band indices) are called nests, and the updated are conduct by the Levy flight, which is basically a random walk with the random step length. It is very similar to other evolutionary computation algorithms, but has relatively fast convergence. Assume k bands are to be selected. Let a nest
(of size
) denote the selected band indices, and Levy flight update for selected band indices. The detailed nests update can be expressed by EquationEq. (3
(3)
(3) ), here, the MEAC and JM distances are adopted as object function. EquationEq. (3)
(3)
(3) can calculate the new position for each nest based on the previous position, the nest’s location that it has reached so far so best for the objective function, and the nest’s location among the global searched solutions that has reached so far so best. These nests are all potential solutions. It is needed to round off the solutions to adapt the continuous CS to a discrete form because band indexes are discrete values. This improved CS algorithm can be called as 1CS for band selection with a predetermined number.
Nested cuckoo search for adaptive band selection
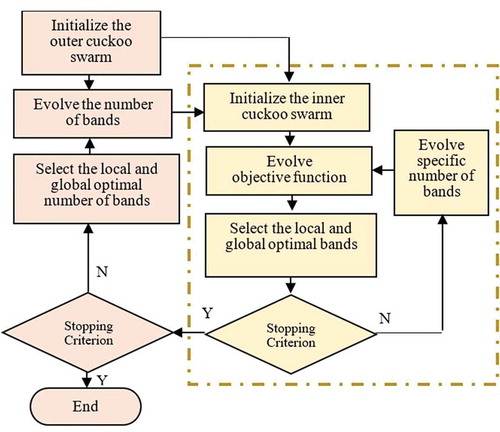
For band selection problems, if the number of bands to be selected is known, 1CS can be directly used to search for bands. However, when this number is changed or unknown, the entire algorithm has to be re-executed. In fact, for hyperspectral band selection, it is very difficult to determine the optimal number of bands for a given dataset. In order to address this issue, two CS algorithms are nested for the adaptive band selection framework, i.e. the outer one is for estimating the optimal number of bands, and the inner one is for the corresponding band selection. The proposed method can search for the optimal number of bands and the related bands simultaneously.
As shown in , the propose adaptive band selection framework including two different optimization processes. With the outer CS being temporarily clamped, the inner CS (in the dashed-line box) searches for the bands with a certain number, which is one of the cuckoo in the outer CS (the loop on the left side of ). After the inner CS is converged, the outer CS updates its nests based on the solutions corresponding to the bands produced by the inner one. Once the nests in the outer CS are updated, the entire process of the inner CS is executed again. The stopping criterion can be chosen such as the change of the best solution between two consecutive iterations is less than a threshold, or the objective value does not change after a certain number of iterations. Here, we terminate the iterations for the inner CS and the outer CS if the objective value does not change after 200 iterations. Note that the same CS algorithm in Section 3.1 is used to search for the optimal number of bands in the outer CS.
Figure 1. Proposed band selections system with two CSs
Computational complexity
lists the computational complexity of different band selection methods. For the 1CS method, the complexity is related to the number of initial nests, the number of iterations to reach the global optimum, and the selected cost function. In the 2CS method, it contains inner and outer CS, so it is more time-consuming.
Table 1. Computational complexity of different algorithms
Experiments and analysis
Hyperspectral dataset
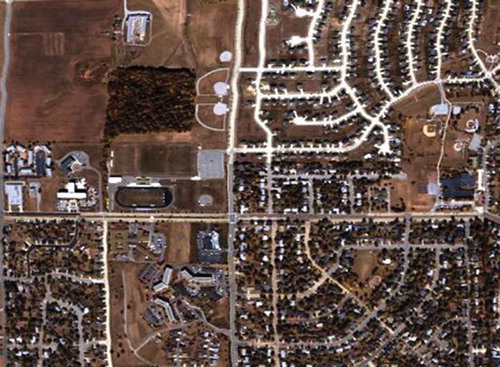
The first hyperspectral dataset used in the experiment is the HYDICE sub-image scene in with 304 × 301 pixels over the Washington DC Mall area. After bad band removal, 191 bands were used in the experiment. In this data, there are six classes: roof, tree, grass, water, road, and trail. These six class centers were used for band selection. The available training and test samples are shown in . According to the previous research, when six bands were selected, the SFS method provided the best performance. So the number of bands to be selected is fixed to be six for the 1CS system.
Table 2. Training and testing samples for HYDICE data
Figure 2. HYDICE DC MALL data

The second hyperspectral dataset is a flightline near the Purdue University West Lafayette campus. This data was collected on 30 September 1999 with the airborne Hyperspectral Mapper (HYMAP) system, providing image data in 128 spectral bands in the visible and infrared regions (0.4–2.4 μm). In this experiment, except the atmospheric water absorption bands, the 126 bands are used. The system was flown at an altitude such that the pixel size is about 3.5 m. An image of the scene is shown in . The information of training and testing samples is listed in .
Table 3. Training and testing samples for HyMap Data
Figure 3. HyMap Purdue Campus data
Performance evaluation and experiments setup
In order to evaluate the performance of the proposed algorithm, PCA-based dimensionality reduction, SFS, SFFS, and 1CS-based band selection algorithms in Section 3.1 are implemented for comparison. Also, the experiment results of the proposed algorithm are compared with that of using all bands. The proposed method is also compared with PSO-based band selection and FA-based band selection algorithms. For performance evaluation, the selected bands are used for further classification, and the quality can be evaluated with classification accuracy. Because training and test samples are available, SVM is applied, and the overall accuracy (OA) and Kappa coefficient are adopted as the evaluation criteria. The SVM classifier is selected due to its excellent performance when dealing with small-sized training data. SVM discriminates two classes by fitting an optional separating hyperplane to the training samples of two classes in a high-dimensional feature space; in linearly inseparable cases, the input space is mapped into a high-dimensional feature space using a kernel function. There are two parameters in the RBF kernel: C and γ. They are estimated by grid search and fivefold cross-validation.
For the parameters of the cuckoo search algorithm, the number of population n is set as 20, the constant β is set as 1.5, and iteration time is set as 200.
Results and analysis
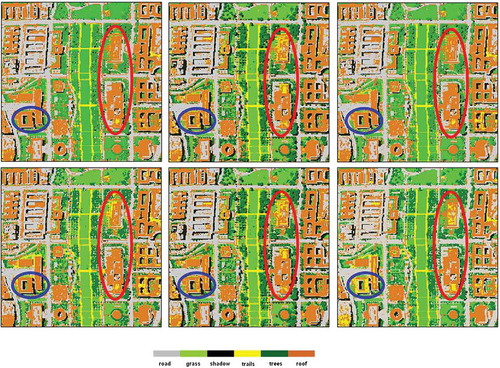
For HYDICE DC Mall dataset, the OA values are listed in . For comparison purposes, the results of using the original data, PCA transformed data (the first six principal components), SFS, SFFS, PSO and FA methods with MEAC and JM are also presented. Since 10 repeated runs were implemented for heuristic-based algorithms, the minimum, maximum, and average accuracy were computed. We can see that the 2CS with MEAC and JM yield the highest classification results with 97.2% and 96.9%, respectively, and they also provided better results than those of the 1CS with MEAC and JM. The results of FA methods with MEAC and JM measurement are lower than those of 2CS methods, but higher than those of PSO methods. shows the classification maps for the best performance among the 10 runs for 1CS and 2CS and some other algorithms. We can see that there were significant improvements on building roofs which highlighted in two circles with the proposed 2CS algorithms; however, other algorithms have many misclassifications on building roofs. It is shown that using the bands selected from the 2CS system can provide the best classification accuracy.
Table 4. The overall classification accuracy for HYDICE data
Figure 4. Classification map of HYDICE data using MEAC and JM.(a) 2CS-MEAC (97.2%). Classification map of HYDICE data using MEAC and JM.(f)All bands (93.4%)
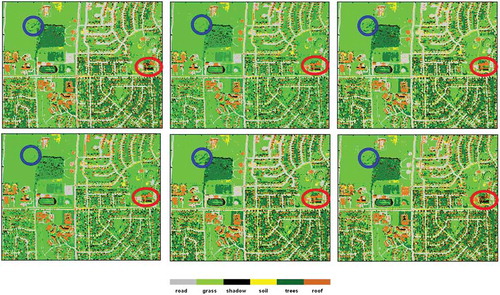
For HyMap Purdue University dataset, the SVM classification results using various band selection methods are listed in . For sequential searching methods, the best number of selected bands was 13 in the previous research, so the number of bands to be selected was set to 13 for 1CS. We can see that the proposed 2CS with MEAC and JM measurement yield the highest classification results with 95.8% and 96.2%, respectively. The number of bands that ought to be selected is 14 (2CS-MEAC) or 13 (2CS-JM), which are consistent with SFS. The results of FA methods with MEAC and JM measurement are lower than those of 2CS methods, but higher than those of PSO methods. shows the classification maps for the best performance among the 10 runs for 1CS and 2CS and some other algorithms. We can see that there were significant improvements highlighted in blue circle with the proposed 2CS algorithms. For building roofs in the red circle, the proposed 2CS methods have much less misclassifications than those of other algorithms. It is shown that using the bands selected from the 2CS system provided the best classification accuracy.
Table 5. The overall classification accuracy for HyMap data
Figure 5. Classification map of HyMap data using MEAC and JM.(a) 2CS-MEAC (95.8%). Classification map of HyMap data using MEAC and JM.(b) 1CS-MEAC (94.3%). Classification map of HyMap data using MEAC and JM.(c (c) 2CS-JM (96.2%). Classification map of HyMap data using MEAC and JM.(d) 1CS-JM (94.4%). Classification map of HyMap data using MEAC and JM.(e) PCA (92.7%). Classification map of HyMap data using MEAC and JM.(f) All bands (88.7%)
Computing time
To further compare the computational complexity, the computing time when the algorithms run in a desktop computer with 3.10-GHz CPU and 8.0-GB memory was recorded and listed in . Note that the running time spent by 2CS does include the time for band selection and for classification. We can see that due to the fact that 2CS contains two cuckoos, this method spends a significant amount of time. But 2CS can provide more accurate classification performance, compared to the 1CS. We believed that with high-performance computing facilities available, the proposed 2CS can be easily implemented in parallel to reduce the computing time.
Table 6. Computing time of different algorithms
Conclusions
In this paper, a CS-based adaptive band selection system to simultaneously determine the optimal number of bands and select the corresponding bands is proposed for hyperspectral image analysis. It is near-automatic with only a few data-independent parameters. Two CSs are included in the adaptive system with an outer one being responsible for selecting the optimal number of bands, while the inner one being in charge of searching for the optimal bands. The experimental results have shown that the 2CS system with a variable number of bands outperforms other results with a fixed number of bands. Furthermore, the estimated number of bands to be selected from the 2CS is consistent with the SFS result after exhaustive searching.
However, the complexity of the proposed method is too high due to it contains two cuckoo searches, which is nested one by one. Although the time complexity is high, it provides a new way for hyperspectral band selection, which can simultaneously select bands and determine the optimal number of bands to be selected. In the future, we plan to implement it in parallel to reduce the execution time.
Disclosure statement
No potential conflict of interest was reported by the author.
References
- Bioucas-Dias, J. M. , Plaza, A. , Camps-Valls, G. , Scheunders, P. , Nasrabadi, N. , & Chanussot, J. (2013). Hyperspectral remote sensing data analysis and future challenges. IEEE Geoscience and Remote Sensing Magazine , 1(2), 6–36. https://doi.org/10.1109/MGRS.2013.2244672
- Chang, C. I. (2003). Hyperspectral imaging: Techniques for spectral detection and classification . Kluwer Academic/Plenum Publishers.
- Chang, C. I. (2013). Hyperspectral data processing: Algorithm design and analysis . Wiley-Interscience.
- Chang, C. I. (2018). A review of virtual dimensionality for hyperspectral imagery. IEEE Journal of Selected Topics in Applied Earth Observations and Remote Sensing , 11(4), 1285–1305. https://doi.org/10.1109/JSTARS.2017.2782706
- Chang, C. I. , & Du, Q. (2004). Estimation of number of spectrally distinct signal sources in hyperspectral imagery. IEEE Transactions on Geoscience and Remote Sensing , 42(3), 608–619. https://doi.org/10.1109/TGRS.2003.819189
- Du, Q. , & Yang, H. (2008). Similarity-based unsupervised band selection for hyperspectral image analysis. IEEE Geoscience and Remote Sensing Letters , 5(4), 564–568. https://doi.org/10.1109/LGRS.2008.2000619
- Fukunaga, K. (1982). Intrinsic dimensionality extraction. In P.R. Krishnaiah & L.N. Kanal (Eds.), Classification, pattern recognition and reduction of dimensionality,handbook of statistics (Vol. 2, pp. 347–360). North-Holland.
- Gao, S. , Gao, Y. , Zhang, Y. , & Xu, L. (2019). Multi-strategy adaptive cuckoo search algorithm. IEEE Access , 7, 137642–137655. https://doi.org/10.1109/ACCESS.2019.2916568
- Ifarraguerri, A. (2004). Visual method for spectral band selection. IEEE Geoscience and Remote Sensing Letters , 1(2), 101–106. https://doi.org/10.1109/LGRS.2003.822879
- Keshava, N. (2004). Distance metrics and band selection in hyperspectral processing with applications to material identification and spectral libraries. IEEE Transactions on Geoscience and Remote Sensing , 42(7), 1552–1565. https://doi.org/10.1109/TGRS.2004.830549
- Martínez-UsóA Pla, F. , Sotoca, J. M. , & García-Sevilla, P. (2007). Clustering based hyperspectral band selection using information measures. IEEE Transactions on Geoscience and Remote Sensing , 45(12), 4158–4171. https://doi.org/10.1109/TGRS.2007.904951
- Medjahed, S. A. , Saadi, T. A. , Benyettou, A. , & Ouali, M. (2015). Binary cuckoo search algorithm for band selection in hyperspectral image classification. IAENG International Journal of Computer Science , 42(3), 1–9. http://www.iaeng.org/IJCS/issues_v42/issue_3/IJCS_42_3_03.pdf
- Nakamura, R. Y. M. , Fonseca, L. M. G. , Santos, J. A. D. , Torres, R. D. S. , Yang, X. , & Papa, J. P. (2014). Nature-inspired framework for hyperspectral band selection. IEEE Transactions on Geoscience and Remote Sensing , 52(4), 2126–2137. https://doi.org/10.1109/TGRS.2013.2258351
- Paul, A. , Bhattacharya, S. , Dutta, D. , Sharma, J. R. , & Dadhwal, V. K. (2015). Band selection in hyperspectral imagery using spatial cluster mean and genetic algorithms. GIScience & Remote Sensing , 52(6), 643–659. https://doi.org/10.1080/15481603.2015.1075180
- Pudil, P. , Novovicova, J. , & Kittler, J. (1994). Floating search methods in feature selection. Pattern Recognition Letters , 15(1), 119–1125. https://doi.org/10.1016/0167-8655(94)90127-9
- Shrutika, S. S. , Manoharan, P. , & Sathishkumar, S. (2019). A band selection method for hyperspectral image classification based on cuckoo search algorithm with correlation based initialization, In Proceeding of 10th workshop on hyperspectral imaging and signal processing: evolution in remote sensing, WHISPER, Amsterdam, Netherlands, 24–26.
- Su, H. , Cai, Y. , & Du, Q. (2017). Firefly-algorithm-inspired framework with band selection and extreme learning machine for hyperspectral image classification. IEEE Journal of Selected Topics in Applied Earth Observations and Remote Sensing , 10(1), 309–320. https://doi.org/10.1109/JSTARS.2016.2591004
- Sun, W. , & Du, Q. (2019). Hyperspectral band selection: A review. IEEE Geoscience and Remote Sensing Magazine , 7(2), 118–139. https://doi.org/10.1109/MGRS.2019.2911100
- Valian, E. , Tavakoli, S. , Mohanna, S. , & Haghi, A. (2013). Improved cuckoo search for reliability optimization problems. Computers & Industrial Engineering , 64(1), 459–468. https://doi.org/10.1016/j.cie.2012.07.011
- Wan, Y. , Ma, A. , Zhong, Y. , Hu, X. , & Zhang, L. (2020). Multiobjective hyperspectral feature selection based on discrete sine cosine algorithm. IEEE Transactions on Geoscience and Remote Sensing , PP(99), 1–13. https://doi.org/10.1109/TGRS.2019.2958812
- Yang, H. , Du, Q. , & Chen, G. (2012). Particle swarm optimization-based hyperspectral dimensionality reduction for urban land cover classification. IEEE Journal of Selected Topics in Applied Earth Observations and Remote Sensing , 5(2), 544–554. https://doi.org/10.1109/JSTARS.2012.2185822
- Yang, H. , Du, Q. , Su, H. , & Sheng, Y. (2011). An efficient method for supervised hyperspectral band selection. IEEE Geoscience and Remote Sensing Letters , 8(1), 138–142. https://doi.org/10.1109/LGRS.2010.2053516
- Yang, X. , Deb, S. , & Behaviour, A. C. B. (2009). Cuckoo search via L ’evy Flights. Proceedings of World Congress on Nature and Biologically Inspired Computing, Coimbatore, 9-11 December 2009, pp. 210-214.
- Yildiz, A. R. (2012). Cuckoo search algorithm for the selection of optimal machine parameters in milling operations. The International Journal of Advanced Manufacturing Technology , 64, 55–61. https://doi.org/10.1007/s00170-012-4013-7
- Zheng, H. Q. , & Zhou, Y. Y. (2012). A novel cuckoo search optimization algorithm based on Gauss distribution. Journal of Computational Information Systems, 8(10):4193-4200..