
 ?Mathematical formulae have been encoded as MathML and are displayed in this HTML version using MathJax in order to improve their display. Uncheck the box to turn MathJax off. This feature requires Javascript. Click on a formula to zoom.
ABSTRACT
Missing values in land surface temperature (LST) data are often observed in the cloud-sheltered area, thereby seriously limiting the spatiotemporal continuity of LST. In this work, Remotely Sensed Daily Land Surface Temperature Reconstruction model(RSDAST) is used to gap-fill the pixels sheltered by clouds in FY-3 C/VIRR LST. Result shows that the cloud pixels in VIRR and MODIS original LST (OLST) product can be reconstructed accurately, but the reconstruction accuracy of MODIS LST is better compared to VIRR based on the RSDAST model. In addition, the reconstruction accuracy of VIRR and MODIS LST decreases with the increase in cloud coverage, and the reduction of the reconstruction accuracy of VIRR LST is larger than that of MODIS data. The number of effective dry-wet edge fitted by VIRR RLST/NDVI scatterplot was higher than that of OLST/NDVI, and the number of clear sky pixels in Reconstructed TVDI (RTVDI) images increased significantly, indicating that the RSDAST expands the temporal resolution and spatial coverage of infrared remote sensing data under cloudy conditions. Moreover, in DOY150–DOY243, the correlation between RTVDI and soil moisture is better than that of Original TVDI (OTVDI), indicating that the RSDAST improves the monitoring ability of soil moisture in these conditions.
Introduction
The FengYun 3 (FY-3) series of satellites is the second-generation of Chinese polar-orbit, sun-synchronous meteorological satellites. It aims to realize all-weather, multi-spectral, and three-dimensional observation of global atmospheric and geophysical elements (Bi et al., Citation2012). As testing satellites, FY-3A and FY-3B are successfully launched on 27 May 2008 and 5 November 2010, respectively. As the first operational satellite, FY-3 C was successfully launched on 23 September 2013 (Xu et al., Citation2014). After in-orbit test, FY-3 C, instead of FY-3A, became the main operational satellite for space-based meteorological observation in China, the temporal resolution of the global observation data was increased from 12 hours to 6 hours (Dong et al., Citation2009; Y.Q. Tang et al., Citation2014; J. Yang et al., Citation2012). FY-3D was launched successfully on 15 November 2017 and the FY-3 meteorological satellites global observation system has now entered a mature and stable operation stage (Z. D. Yang et al., Citation2019). At present, FY-3 series and EOS/MODIS satellite observation data are the most widely used satellite data sources in China’s meteorological, marine, agricultural, and environmental protection sectors. It has also been widely applied to some important fields, such as weather forecast, climate prediction, disaster monitoring, and environmental monitoring (Garcia-Carrerass et al., Citation2017; S.J. Wang et al., Citation2014; Sun et al., Citation2017a, Citation2012; Zhang et al., Citation2017). It plays an important role in forest fire monitoring, drought monitoring, urban heat island monitoring, and other actual operations of meteorological departments (Hua & Ping., Citation2018; S.Q. Yang et al., Citation2020; http://rsapp.nsmc.org.cn).
VIRR, a key instrument carried on FY-3A/B/C meteorological satellite, has 10 channels with a wavelength range of 0.44–12.50 μm, thereby providing visible and infrared spectra for global observation of atmosphere, ocean, and land (). Two adjacent thermal infrared channels provide a remarkable opportunity for retrieving LST using the split-window algorithms (Gao et al., Citation2018, Citation2017; Jiang et al., Citation2013). Chen et al. (Citation2015) revised the approximate values and assumptions in the derivation process by using the split-window algorithms based on TIGR 2000 database and MODTRAN 4.0 software and proposed a new method to obtain high-accuracy LST from FY-3A/VIRR. B.H. Tang et al. (Citation2015) estimated the land surface temperature by thermal infrared channels 4 and 5 of FY-3A/VIRR and verified the estimated FY3A/VIRR LST using MOD11_L2, which was an LST product derived from MODIS, and LST values measured in the Hailar field site in Northeast China from October 2013 to September 2014. Zhang et al. (Citation2017) assessed the drought in the summer of 2015 (July to September) in Chongqing based on VIRR data to explore the applicability of FY-3 data in drought monitoring. Ni et al. (Citation2014) monitored drought change in Chongqing in 2011 based on VIRR data and performed a comparative analysis on the data of 150 soil moisture monitoring sites and remote sensing monitoring results in the same period. The verification results were very significantly correlated.
Table 1. Technical parameters of FY3C/VIRR band
However, thermal infrared band signal cannot penetrate the cloud to be captured by the sensor, which seriously limits the spatiotemporal continuity of surface soil moisture monitoring. An LST reconstruction algorithm is needed to fill up a vacancy in the LST value of the pixel when cloud pixels are found in the LST product obtained by the sensor to achieve the continuous observation of regional drought (Fu & Weng, Citation2016; Gerber et al., Citation2018; Westermann et al., Citation2011). The existing LST reconstruction algorithms are mainly based on MODIS, AVHRR, ASTER, and other LST products (Duan & Li, Citation2015; Duan et al., Citation2017b; T.X. Wang et al., Citation2019), which are mainly classified into three categories (Fu et al., Citation2019). The first category aims to achieve the reconstruction of cloud pixel LST by combining TIR data with microwave remote sensing data (Duan et al., Citation2017a; Holmes et al., Citation2009). Kou et al. (Citation2016) combined MODIS LST products with different spatial resolutions with AMSR-E LST products by using Bayesian maximum entropy (BME) method to obtain complete and high-quality LST data. The result shows that the missing LST in cloud pixels is completely filled, and the availability of the combined LST is 100%. The second category relies on the connection among pixels in spatial, temporal, or spatiotemporal information to reconstruct LST (Neteler, Citation2010; Ke et al., Citation2013; Shuai et al., Citation2014; Zeng et al., Citation2015; Sun et al., Citation2017b; Kang et al., Citation2018). The third category, which is based on surface energy balance (SEB), aims to calculate the difference of LST between clear sky pixel and cloud pixel by combining meteorological data (Fu et al., Citation2019; Jin, Citation2000; Lu et al., Citation2011; Zeng et al., Citation2018). According to the different sources of the complementary information, Shen et al. (Citation2015) divides LST reconstruction algorithm into four categories: spatial-based methods, spectral-based methods, temporal-based methods, and hybrid methods (which extract the complementary information by a combination of the three previous approaches). Sun et al. (Citation2017b) proposed a flexible LST reconstruction model (RSDAST) based on MODIS data. This model can restore the clear sky LST value of cloud-sheltered pixel accurately by only using adjacent spatiotemporal clear sky pixel without introducing other complex meteorological parameters. It can also be flexibly applied to other sensors. S.Q. Yang et al. (Citation2020) achieved the reconstruction of cloud pixel LST in MODIS LST product data in Chongqing in 2011 based on RSDAST algorithm and applied the reconstructed LST product to the actual drought monitoring in Chongqing. Compared with the drought monitoring result by OLST (Original LST), the reconstruction of LST expands the spatial scope and temporal continuity of remote sensing drought monitoring in cloudy region and improves the accuracy of regional drought monitoring.
In this paper, the RSDAST model proposed by Sun et al. (Citation2017b) is used to reconstruct the cloud pixels in FY3C/VIRR LST daily product data of Chongqing in 2018 and to evaluate its application in reconstructing FY3C/VIRR LSTs under cloud. The TVDI drought monitoring index is then used to monitor the summer drought in Chongqing in 2018 based on the reconstructed LST and NDVI products from FY3C/VIRR.
Study area and data
Study area
Chongqing is located in Southwest China between 105°11ʹ – 110°11ʹE, 28°10ʹ – 32°13ʹN, in the upper reaches of the Yangtze River (). It spans 470 km from east to west and approximately 450 km from north to south with a total area of 82,000 km2. Chongqing adjoins Hunan and Hubei in the east, Sichuan in the west, Shanxi in the north and Guizhou in the south. The areas under its jurisdiction are mainly distributed along the Yangtze River. Its topography is mainly composed of hills and low mountains with an average altitude of 400 m. Affected by external forcing factors, such as topography, atmospheric circulation, equatorial east pacific SST, and snow cover in the Qinghai–Tibet Plateau, Chongqing is prone to extreme high-temperature weather in summer, and sustained high-temperature weather is likely to cause regional high temperature and drought (i.e., summer drought) (Bao et al., Citation2007; Peng et al., Citation2007; Yueqing, Citation2003; Zou & Gao, Citation2007). Chongqing is located at the confluence of the Yangtze River and Jialing River, with abundant water vapor sources. And Chongqing is located in the southeast edge of Szechwan Basin (), surrounded by high mountains, rugged surface, very small wind speed and weak wind force, which makes it difficult for water vapor to diffuse in the region, so it is easy to form cloud and fog weather.
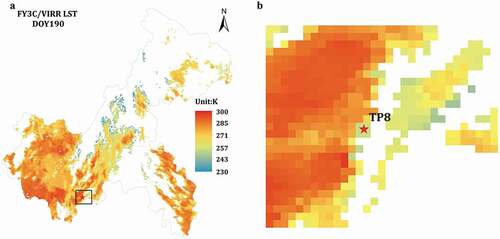
Figure 1. (a) Topographic map of Chongqing; (b) The percentage of cloud coverage of all pixels in Chongqing in 2018 according to FY3C/VIRR data. In Fig. 1a, black spots represent the soil moisture monitoring sites; In Fig. 1b, black plus signs represent the analog cloud coverage pixel points, and red box represents the analog cloud coverage area
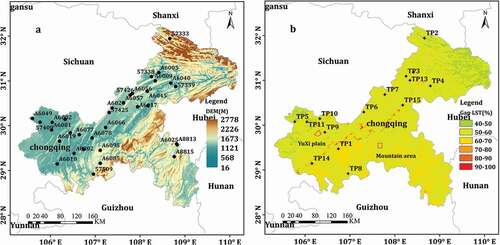
shows Chongqing’s proportion of days of cloud pixels in FY3 data from 2017 to 2019. The results show that the proportion of cloud pixels in the central and south-eastern of Chongqing is relatively high, ranging from 60% to 70%, the proportion of cloud pixels near water is more than 80%, and the proportion of cloud pixels in the north-eastern and western of Chongqing is relatively low, but its value is also greater than 40%. The long-term and large-scale cloud coverage results in the discontinuity of thermal infrared data in time and space, thereby restricting the application of thermal infrared remote sensing data in Chongqing area greatly.
Data collection and pre-processing
FY3C/VIRR data
A total of 12 sets of remote-sensing instruments are carried on FY3C. The LST and NDVI product data used in this work were obtained from VIRR on FY3C. Among these data, the temporal resolution of LST is 1 day, and the spatial resolution data is 1000 m. The tiles in this study area are 30A0 and 3090. The time range is from 1 January 2018 to 31 December 2018. Ground radiation four-component data in Chongqing are lacking. The radiation four-component data of Heihe River Basin from 7 May 2014 to 31 December 2014 are collected in this work to verify the retrieval accuracy of VIRR OLST and compared with VIRR OLST at the same time and space. The NDVI product data provided by the National Satellite Meteorological Center differ from LST in temporal resolution. The highest temporal resolution of NDVI product data is 10 days. Therefore, FY3C/VIRR L1 data are used in this work, and the NDVI daily product data of the research area are obtained by using the red and near-infrared bands.
TERRA/MODIS data
MODIS on TERRA and AQUA satellites has 36 discrete spectral bands and a wide spectrum range in full-spectrum range from 0.4 μm (visible light) to 14.4 μm (thermal infrared) (). MODIS LST daily product data (MOD11A1 collection 6) with a spatial and temporal resolutions of 1000 m and 1 d are used in this work. The data range is from 1 January 2018 to 31 December 2018. The tiles where the study area is located are h27v05, h27v06. Here, the MODIS LST product data are projected and spliced into grid data with spatial resolution of 1000 m by using MRT tools, and the grid data are cropped by using the vector data of the research area.
Table 2. Technical parameters of FY3C/VIRR band
Ground-based LST measurements
Here, the radiation four-component data observed by DAM and HEL ground radiation stations () from 7 May 2014 to 31 December 2014 are used to evaluate the accuracy of VIRR OLST product data. The four-component net radiometers deployed in two stations provide an average value every 10 min, and the average value in transit time of FY3C satellite to make verification is extracted. The measured LST is estimated by upward and downward long-wave radiation. The calculation formula is expressed as:
Table 3. HiWATER stations information
where is the surface upward long-wave radiation;
is the atmospheric downward long-wave radiation;
is the surface broadband emissivity; and
is the Stefan–Boltzmann’s constant (
).
is obtained through the weighted calculation of emissivity of each component (soil and vegetation) and its fraction (Formula 2) (Sobrino et al., Citation2004b).
where and
are the emissivity of bare soil and vegetation, respectively; and
is the vegetation coverage, which is calculated as
where and
are set as 0.8 and 0.05, respectively.
. HiWATER stations information.
Methodology
RSDAST algorithm
The similarity between two geographical pixels in geo-spatial is related to the distance between them. If the distance between two pixels is close, then the surface features are more similar (Li et al., Citation2007; Tobler, Citation1970). When the distance between the two geographical pixels is close enough, the two pixels are most likely to be in the same weather conditions. Then, the temperature difference between two nearby pixels is stable in time series. This assumption is verified by Sun et al. (Citation2017b) and S.Q. Yang et al. (Citation2020).
Sun et al. (Citation2017b) proposed the reconstruction of the surface temperature model of cloud pixel (RSDAST) by using the clear sky pixel values around cloud pixel and adjacent observation time combined with Formula (4). The implementation process is shown in Formula (5):
where is the reconstructed LST value of the cloud pixel,
refers to the day to reconstruct images,
refers to the clear sky pixel points in a moving window, D refers to the adjacent time scale, and N refers to the total number of clear sky pixel point in a moving window. In Sun et al. (Citation2017b), D and N parameter are set to 4 and 81, respectively. Sun et al. (Citation2017b) included the clear-sky pixels of adjacent date
in the RSDAST model to increase the number of serviceable pixels while considering the distance factor.
is the LST value that corresponds to the pixel (
) at
;
is the LST value of the clear sky pixels value in the moving window at
;
is the LST value of the clear sky pixels in a moving window at
;
is the total weight coefficient that indicates the contribution of LST (
) to the reconstruction of
. Its value is related to the distance parameter (
) and the similarity parameter (
). The calculation formula is expressed as:
where is the distance parameter. According to the first law of geography, the correlation and distance between two pixels have inevitable relationship. As a result, its contribution to the reconstruction of
is remarkable. Therefore, the distance parameter between (
) and (
) is defined as:
However, the proximity between two geographical pixels does not necessarily result in slight difference in LST, because the difference in LST is also affected by the surface environment in which the pixel is located. Sun et al. (Citation2017b) proposed a similarity parameter () to represent the relationship of the surface environment between two nearby pixels. When
is obscured by cloud, the LST difference of pixel pair (LDPP) at
is used to define the similarity of the land surface in (
) and
pixels. If LDPP is smaller, then the surface coverage types of the two pixels is similar. The similarity parameter (
) can be calculated as follows:
Formula (6) shows that if is small, then the proportion of the adjacent effective pixel LST in
reconstruction is large. Plus 1 prevents the occurrence of
=0 when the land surface temperature of the two pixels is the same.
TVDI algorithm
Vegetation index represents vegetation growth and coverage, whereas land surface temperature reflects soil moisture (Wu & Lu, Citation2016). The combination of LST/NDVI can retrieve complementation advantages and provide the possibility for regional drought monitoring (Tian, Citation2006). Many field experiments show that LST and NDVI have a closely negative correlation (). The straight line fitted with LST and NDVI scatter points can represent regional soil moisture content. The scatter plots of LST and NDVI pixels in the region are in the form of steps or triangles in surface cover types ranging from bare to lush vegetation and soil moisture from arid to semi-arid to humid (Lambin & Ehrlich, Citation1995; Price, Citation1990).
Figure 2. LST/NDVI feature space
The LST/NDVI feature space is confirmed by theoretical derivation and field test results. Based on LST/NDVI feature space, Sandholt et al. (Citation2002) put forward the concept of TVDI. Its calculation formula is presented as:
where LST is the land surface temperature; is the minimum LST corresponded by a certain NDVI value, and the fitting line of all LST minimum scatter points corresponding to NDVI (
) is called wet edge (TVDI = 0);
is the maximum LST corresponded by a certain NDVI value, and the fitting line of all LST maximum scatter points corresponding to NDVI (
) is called dry edge (TVDI = 1); coefficients
,
,
and
are the fitting coefficients of dry and wet edges.
Accuracy evaluation of LST reconstruction
The Removal–Reconstruction–Comparison method is adopted in this work. Analog cloud pixels of the clear sky pixels in the original data are screened out. After removing analog cloud pixels, the RSDAST model is used to fill the missing pixels. Finally, the OLST value is used as the validation data to compare and analyze the RLST value. R (Formula 10), Bias (Formula 11), and RMSE (Formula 12) are adopted to characterize the accuracy of surface temperature reconstruction in clear sky. In this method, the clear sky pixel value in the original data is used as the validation data to test the accuracy of RSDAST model in the LST reconstruction of cloud pixel of different data sources, which avoid the difference between the site and remote sensing data in spatial scale. It is a simple and effective accuracy validation method. In formula (10), and
refer to RLST value and original LST(OLST) after reconstruction, respectively;
and
refer to the mean values of
and
, respectively; and N refers to the sample size of
and
. In Formulas (11) and (12),
and
refer to RLST and OLST, respectively; and N refers to the sample size of
and
.
Drought monitoring in cloudy regions
TVDI index is adopted to determine the OTVDI and RTVDI daily products of 2018 by being combined with OLST/NDVI and RLST/NDVI, respectively. In order to evaluate the usability of RSDAST algorithm in the LST reconstruction of FY3C/VIRR cloud pixels, the following analyses have been provided: By comparing the fitting of dry edge before and after reconstruction, the actual contribution of RSDAST algorithm in drought monitoring in cloudy area is verified. The dry edge fitting result determines the calculation result of TVDI to some extent. In the area covered by large number of clouds, the lack of too many pixels lead to difficulty in regional dry edge fitting or the great difference between the fitted dry and wet conditions and the actual situation of the land surface. OTVDI and RTVDI are verified by the soil moisture data of soil with a depth of 10 cm measured at 33 soil moisture observation stations in Chongqing, and the ability of RSDAST algorithm in long time series drought monitoring in cloudy regions is evaluated by the correlation among OTVDI, RTVDI, and soil moisture data.
Results
LST reconstruction using RSDAST
Accuracy evaluation of LST reconstruction
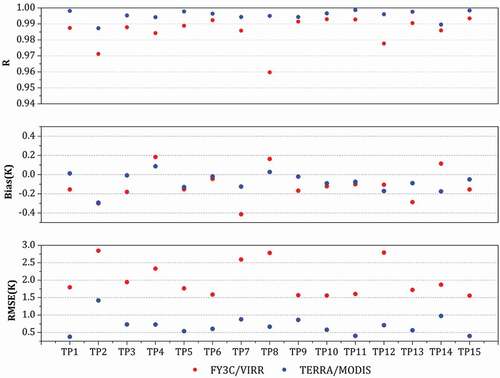
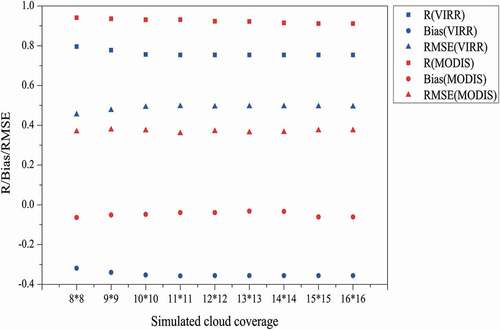
Gao et al. (Citation2018) used different methods to verify the accuracy of FY3C/VIRR LST. The results indicate that the differences between VIRR LST and MODIS LST were within 2.80 K, and the corresponding values between VIRR LST and SEVIRI LST were within 3.30 K. shows the evaluation results of LST reconstruction accuracy of 15 randomly selected analog cloud pixels. The correlation coefficient (R) between RLST and OLST of VIRR and MODIS is in the range of 0.959–1.0 (P < 0.01, Correlation is significant at the 0.01 level (2-tailed)), Bias is in the range of −0.41–0.2 K, and RMSE in the range of 0–3.0 K. High R value and low Bias and RMSE show that RSDAST algorithm can realize the reconstruction of cloud pixel LST in VIRR and MODIS data accurately. However, the comparison of the LST reconstruction accuracy of VIRR and MODIS shows that the LST reconstruction accuracy of MODIS at all analog cloud pixels is better than that of VIRR. Under the single pixel of cloud coverage, the R value between VIRR OLST and RLST is in the range of 0.959–0.993 (P < 0.01, correlation is significant at the 0.01 level (2-tailed)), Bias’s absolute value in the range of 0.04–0.41 K, RMSE in the range of 1.55–2.84 K. And the R value between MODIS OLST and RLST is in the range of 0.987–0.999, Bias’s absolute value in the range of 0–0.29 K, and RMSE in the range of 0.37–1.41 K.
Figure 3. Analysis on LST reconstruction accuracy of FY3C/VIRR and TERRA/MODIS for different analog cloud pixels
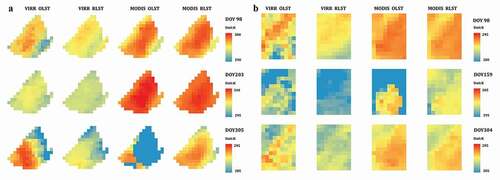
Tow simulation areas () with different surface environments are selected to examine RSDAST algorithm when the cloud coverage is expanded. One part is located in the high-altitude area in the east of the research location, whereas the other simulation area is located in the Yuxi Plain. shows the spatial distribution of OLST and RLST of VIRR and MODIS under the large area of cloud coverage. Except for the analog cloud pixel points in DOY159 VIRR OLST, which are not all filled, the LST values of analog cloud pixels in VIRR and MODIS images on the other dates, as well as real cloud pixels in OLST, such as, MODIS DOY305, are also reconstructed. shows the results of LST reconstruction accuracy in two simulated cloud coverage areas, namely, plain and mountain. Under the large area of cloud coverage, the R value between VIRR OLST and RLST is in the range of 0.55–0.73 (P < 0.05, Correlation is significant at the 0.05 level (2-tailed)), Bias’s absolute value in the range of 0.11–1.02 K, and RMSE value is in the range of 0.93–3.6 K; the R value between MODIS OLST and RLST is in the range of 0.80–0.94 (P < 0.01, Correlation is significant at the 0.01 level (2-tailed)), Bias’s absolute value in the range of 0.2–0.58 K, and RMSE value is in the range of 0.61–1.32 K. Compared with single pixel cloud coverage, when the cloud coverage area increases, the LST reconstruction accuracy of VIRR and MODIS decreases slightly. The correlation between VIRR OLST and RLST significantly decreases, whereas the LST reconstruction accuracy of MODIS data declined slightly. Moreover, shows a great difference between VIRR RLST and OLST after the reconstruction of analog cloud pixel. The difference between RLST and OLST in MODIS data after reconstruction of analog cloud pixel is minimal, and the spatial distribution trend is consistent.
Table 4. Evaluation of LST reconstruction accuracy in plain and mountainous areas
Figure 4. Spatial distribution of FY3C/VIRR and TERRA/MODIS OLST and RLST in plain (a) and mountainous (b) areas under cloud cover
. Evaluation of LST reconstruction accuracy in plain and mountainous areas.
shows the changes in the LST reconstruction accuracy of VIRR and MODIS in different areas of cloud coverage. The LST reconstruction accuracy of VIRR and MODIS gradually decreases with the increase in cloud coverage area. Among them, the R value between OLST and RLST in VIRR data drops from 0.796 to 0.754 (P < 0.05, correlation is significant at the 0.05 level (2-tailed)), Bias’s absolute value increases from 0.319 K to 0.356 K, and RMSE value increases from 0.454 K to 0.494 K; the R value between OLST and RLST in MODIS data decreases from 0.940 to 0.911 (P < 0.01, correlation is significant at the 0.01 level (2-tailed)), Bias’s absolute value increases from 0.03 K to 0.06 K, and RMSE value increases from 0.368 K to 0.378 K. The accuracy drops with the LST reconstruction of two product data. In comparison, the LST reconstruction accuracy of MODIS data is higher than that of VIRR data.
Figure 5. Changes in LST reconstruction accuracy with the change of analog cloud coverage
Accuracy analysis of LST reconstruction
RSDAST algorithm does not use other data in the process of cloud pixel LST reconstruction. Therefore, the most direct reason for the difference in cloud pixel LST reconstruction accuracy between VIIR and MODIS data is the retrieval accuracy of OLST. Here, two methods are adopted to verify the retrieval accuracy of OLST.
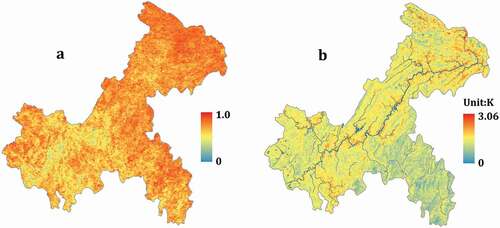
The inter-comparison method only compares the satellite-derived LST with a well-validated LST product from another sensor (Gao et al., Citation2018, Citation2017). This method does not need any ground observation data and is a feasible method for LST verification. In this paper, the correlation in OLST between MODIS and VIRR in 2018 is analyzed pixel by pixel (). The R value of OLST between MODIS and VIRR is in the range of 0.2–0.96, and its average value is 0.70. The R value of the pixel points more than 95% in the research area is more than 0.5, indicating a good correlation between two OLST data in the research area. The average value of OLST difference () shows that the average value of OLST difference between MODIS and VIRR is positive, indicating that the pixel value of MODIS OLST is higher than that of VIRR OLST, and the difference value between both of them is in the range of 0–3.06 K, of which the pixels with the average value of OLST difference of more than 2 K account for only 4%. After the superposition of Chongqing water information (blue lines in ), the large value of OLST difference is apparently distributed near the water.
Figure 6. The spatial distribution of correlation coefficient (a) and average of difference (b) between MODIS OLST and VIRR OLST in 2018. The blue curve in the Figure 6b shows the information of major water in Chongqing
The average LST value within 10 min before and after the overpass time of the satellite is estimated according to the LST estimation method in Section 2.4 based on the radiation four-component data measured in the ground station. The retrieval accuracy of OLST is evaluated by the error analysis result between the site-estimated LST and satellite-derived LST. The result shows that the R value between VIRR OLST and LST calculated in the station is 0.961 (P < 0.01, Correlation is significant at the 0.01 level (2-tailed)), Bias is 1.24 K, and RMSE value is 4.10 K; and, the R value between MODIS OLST and the LST value calculated in the station is 0.974, (P < 0.01, correlation is significant at the 0.01 level (2-tailed)) Bias is −1.23 K, and RMSE is 3.07 K. High R value and low Bias and RMSE value indicate the high retrieval accuracy of VIRR and MODIS OLST, which can remarkably characterize the land surface temperature in the research area. However, the comparison of shows that the retrieval accuracy of MODIS OLST is significantly better than that of VIRR OLST. This finding may be the reason for the lower LST reconstruction accuracy of VIRR cloud pixel than that of MODIS.
Figure 7. Scatter plots between VIRR OLST and LST values calculated through radiation four-component data in the station (a) and, MODIS OLST and LST values calculated through radiation four-component data in the station (b)
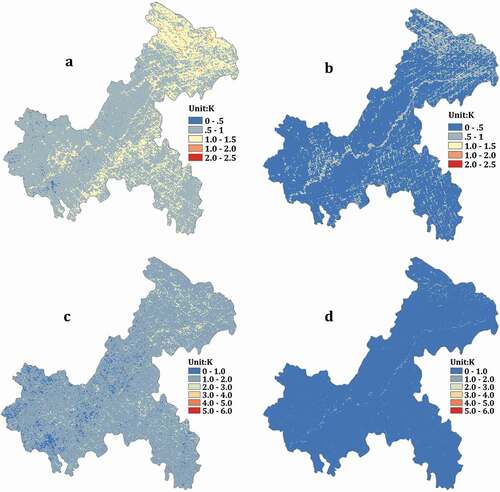
This work, beginning with the principle of RSDAST algorithm, assumed that the difference in LST between adjacent pixels is similar in a short time. This hypothesis has been verified by Sun et al. (Citation2017b). The temperature difference (TD) between the pixels of VIRR and MODIS daily OLST data center in 2018 and the average value of eight adjacent pixels is analyzed pixel by pixel, and the daily VIRR and MODIS TD spatial distribution chart is obtained. Subsequently, the mean absolute value () and the standard deviation () of each pixel TD in time series are calculated. The statistical results show that the standard deviation and the mean absolute value of VIRR TD are larger than or equal to those of MODIS in the same region. The comparison of with shows that the mean absolute value of VIRR TD mainly focuses on 0.5–1.5 K, and the mean absolute value of VIRR TD of some pixels in the eastern mountainous area is larger than 1.5 K. The mean absolute value of MODIS TD mainly focuses on 0–0.5 K, and its values in the eastern high-altitude area, Yangtze River, and urban areas are larger than 0.5 K. Similarly, the comparison of with shows that the standard deviation of VIRR TD mainly focuses on 1.0–2.0 K, the standard deviation of VIRR TD of some pixels in the east is in the range of 2.0–3.0 K, whereas the standard deviation of MODIS TD mainly focuses on 0–1.0 K. The verification results show that the difference of the pixels in MODIS OLST product from LST value of adjacent pixel is smaller compared with VIRR OLST product data, thereby agreeing to the hypothesis of the first law of geography.
Figure 8. Spatial distribution of the mean absolute value (a, b) and the standard deviation value (c, d) of FY3C/VIRR and TERRA/MODIS TD in 2018
shows that the LST reconstruction accuracy of VIRR at TP8 is R = 0.959, Bias = 0.16 K, and RMSE = 2.78 K, whereas the LST reconstruction accuracy of MODIS at this point is R = 0.995, Bias = 0.02 K, and RMSE = 0.66 K. In this site, the difference in LST reconstruction accuracy between VIRR and MODIS is high. The scattered plot of VIRR OLST and RLST at TP8 () shows a huge difference between OLST and RLST in a group of data in the scattered plot, which leads to the increase in dispersion, thereby affecting the LST reconstruction accuracy of VIRR. Data pairs with large difference in LST appear in DOY190. shows that DOY190 TP8 is located at the edge of the cloud pixel, and its value is seriously affected by the cloud edge. As a result, the OLST value at this point is only 255.8 K, which is lower than the OLST value of the clear sky pixel in the surroundings. All OLST data screened in this paper are pixel points identified as valid values in the product data set. This phenomenon shows that not all cloud pixels or the pixels affected by the edge of cloud are marked in the VIRR LST product data set. In VIRR OLST image, some pixels identified as effective value by Quality Control flags (QC) at the edge of the cloud were significantly different from LST value of the adjacent clear sky pixels. RSDAST algorithm aims to realize the LST reconstruction of cloud pixel based on the relationship between cloud pixel and its adjacent pixels in space distance and surface environment. When the pixels affected by the cloud shadow are included in the process of LST reconstruction of cloud pixel, it is bound to produce errors that affect LST reconstruction of cloud pixel (), thereby affecting the retrieval accuracy of surface soil moisture under cloudy conditions.
Figure 9. Scattered plot of original LST and reconstructed LST of FY3C/VIRR at TP8 point
Figure 10. Spatial pattern of DOY190 FY3C/VIRR OLST
Drought monitoring in cloudy area based on VIRR RLST/NDVI
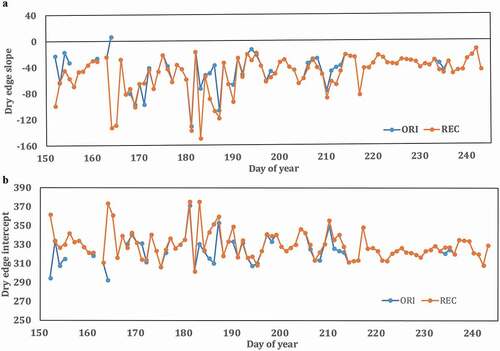
Combined with RSDAST algorithm and TVDI index, S.Q. Yang et al. (Citation2020) used MODIS data to monitor the drought in Chongqing in 2011. The results show that the combination of RSDAST and TVDI improved the spatial and temporal resolution and the accuracy of drought monitoring. shows the slope () and intercept () of dry edge equation fitted by OLST/NDVI and RLST/NDVI in summer 2018 (DOY150~ DOY243). The results show that the slope of the dry edge equation fitted by LST/NDVI in most dates is negative, thereby meeting the triangle or trapezoid feature space proposed by Sandholt et al. (Citation2002). In addition, the difference in the slope and intercept between OLST/NDVI dry edge equation and RLST/NDVI dry edge equation becomes small. However, the appearance of cloud causes too many missing pixels in DOY164 OLST image and the scattered distribution of clear sky pixels. Thus, the slope of OLST/NDVI dry edge equation is positive (slope = 6.84), which does not meet the triangle or trapezoid feature space. The fitted dry edge equation is called False Dry Edge. Even in DOY165–DOY167, OLST/NDVI cannot fit the dry edge equation because of the small size of the clear sky pixel samples in OLST image, leading to the loss of the monitoring ability of the land surface soil moisture of the OLST/NDVI-based data. After the LST reconstruction by RSDAST model, the number of clear sky pixels in the RLST image significantly increases with effective pixel coverage from dry to wet and from bare soil to closed vegetation area. In DOY164, the dry edge slope based on RLST/NDVI feature space fitting returns to a negative value (slope = −132.43), and in DOY165–DOY167, the dry edge equation can be fitted effectively based on RLST/NDVI. Its dry edge equation slope is −128.57, −27.56, and −81.37, and intercept is 361.29, 316.54, and 339.40, respectively. With the effective dry edge equation, the monitoring ability of RLST/NDVI from the surface soil moisture in DOY165–DOY167 is recovered. However, when the study area is completely covered by cloud, there will be no clear sky pixel in the OLST image. At this time, the LST value of cloud pixels in current data cannot be reconstructed based on RSDAST algorithm. As shown in , all pixels in DOY162 OLST image are missing, due to the lack of LST(x_i,y_i,t_0) in formula 5, RSDAST algorithm lost the ability to recover LST value of cloud pixels in DOY162 OLST image, Resulting in that neither OLST/NDVI nor RLST/NDVI can fit out the dry edge equation, thus lost the monitoring ability of the surface soil moisture on that day.
Figure 11. Changes in slope and intercept of OLST/NDVI and RLST/NDVI dry edge equation in (DOY150–DOY243) in summer 2018
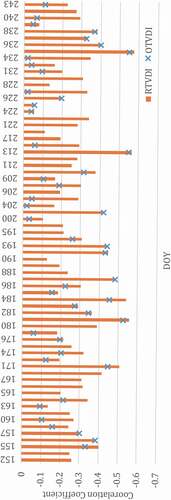
shows the correlation between TVDI inverted before and after VIRR LST reconstruction and the soil moisture data in depth of 10 cm measured in the site in the summer 2018 (DOY150–DOY243). TVDI accuracy evaluation result shows that 24 periods of OTVDI without accuracy evaluation results exist in DOY150–DOY243. The first reason for this phenomenon is that the number of clear sky pixels in OLST is low, leading to the failure to fit the effective dry edge equation on that day, thereby losing the ability to estimate the TVDI on that day (). Second, clear sky pixels cannot cover the whole study area because of too many cloud pixels in OLST. Clear sky pixels in OLST image are concentrated in a certain area or distributed everywhere. As a result, OLST/NDVI feature space cannot represent the distribution of surface soil moisture in the whole study area accurately. Therefore, there is no correlation between OTVDI estimated by OLST/NDVI and soil moisture measured on the ground. After the LST reconstruction, some cloud pixels in OLST image are reconstructed, and the coverage area of clear sky pixels is increased from dry to wet and from bare soil to closed vegetation. Therefore, when surface soil moisture cannot be estimated by OLST/NDVI, the surface soil moisture monitoring ability of RLST/NDVI is recovered. Moreover, in DOY150–DOY243, the correlation between RTVDI and soil moisture is better than that of OTVDI, indicating that RTVDI based on RLST/NDVI estimation can represent the real situation of surface soil moisture.
Figure 12. Correlation between TVDI (OTVDI refers to blue “X”, RTVDI is a histogram) and the soil moisture data in depth of 10 cm measured in the station in (DOY150–DOY243) in the summer 2018
Conclusions
FY3C is the first operational satellite of FY-3 satellites, and its data are widely used in weather forecast, disaster monitoring, environmental protection, and other important fields. Similar to other optical thermal infrared sensors, the VIRR sensor does not has the ability to detect the surface information under the cloud. Therefore, missing values exist in VIRR LST products in the cloudy period, thereby affecting the temporal and spatial continuity of data. In this paper, the RSDAST and TVDI index are combined to monitor the continuous drought in Chongqing in summer 2018.
The comparison shows that the LST reconstruction accuracy in VIRR OLST at the pixel scale is lower than those of MODIS OLST, but the difference between them is minimal. Under the single pixel of cloud coverage, the R value between VIRR OLST and RLST in the range of 0.959–0.993, Bias’s absolute value in the range of 0.04–0.41 K, RMSE in the range of 1.55–2.84 K; the R value between MODIS OLST and RLST in the range of 0.987–0.999, Bias’s absolute value in the range of 0–0.29 K, and RMSE in the range of 0.37–1.41 K. When the cloud coverage area is expanded, the LST reconstruction accuracy of VIRR and MODIS is slightly lower than that in single pixel, but the LST reconstruction accuracy of VIRR OLST changes evidently, and the accuracy of MODIS OLST changes slightly. Under the large area of cloud coverage, the R value between VIRR OLST and RLST is in the range of 0.55–0.73, Bias’s absolute value in the range of 0.11–1.02 K, and RMSE value is in the range of 0.93–3.6 K; the R value between MODIS OLST and RLST is in the range of 0.80–0.94, Bias’s absolute value in the range of 0.2–0.58 K, and RMSE value is in the range of 0.61–1.32 K. This is mainly because the accuracy of VIRR OLST product is lower compared to MODIS data.
The appearance of cloud results in a large number of pixels with missing values in the OLST. This limits the monitoring of the soil moisture in the whole region using this product because the dry-wet edge equation of the OLST/NDVI fitting is invalid. This shortcoming even causes the clear sky pixel to be unable to fit the dry edge. After the reconstruction of cloud pixels by using the RSDAST algorithm, the number of the clear sky pixels in VIRR RSLT image increases in the study region. VIRR RLST/NDVI scattered plot shows an evident triangle feature space. The effective dry-edge equation enables VIRR RLST/NDVI to monitor soil moisture under cloudy conditions.
Acknowledgments
The authors would like to thank the management and movement members of the Chongqing institute of Meteorological sciences for providing the soil moisture data set, as well as professor Song Lisheng of Southwest university for providing the four components of ground radiation data.
Disclosure statement
No potential conflict of interest was reported by the author(s).
Additional information
Funding
References
- Bao, Y. Y., Kang, Z. M., Jin, R. H., & Li, F. (2007). Analysis of Floods and Droughts in Chongqing and East Sichuan. Meteorological Monthly, 33(5), 89–93. https://doi.org/https://doi.org/10.7519/j.1000-0526 2007.05.013.
- Bi, Y, M., Yang, Z, D., Zhang, P., Sun, Y.Q., Bai, W.H., Du, Q.F., Yang, G.L., Chen, J., & Liao M. 2012. An introduction to China FY3 radio occultation mission and its measurement simulation. Advances in Space Research, 49(7), 1191–1197. doi: https://doi.org/10.1016/j.asr.2012.01.014
- Chen, Y. Y., Duan, S. B., Zhao, W., & Li, Z. L., 2015. Derivation of new split window algorithm for retrieving land surface temperature from FY-3/VIRR data. 2015 IEEE International Geoscience and Remote Sensing Symposium (IGARSS), Milan, Italy, July. https://doi.org/https://doi.org/10.1109/igarss.2015.7325905.
- Dong, C. H., Yang, J., Zhang, W. J., Yang, Z.D., Lu, N.M., Shi, J.M., Zhang, P., Liu, Y.J., & Cai, B. (2009). An Overview of a New Chinese Weather Satellite FY-3A. Bulletin of the American Meteorological Society, 90(10), 1531–1544. https://doi.org/https://doi.org/10.1175/2009BAMS2798.1
- Duan, S. B., & Li, Z. L., 2015. Intercomparison of Operational Land Surface Temperature Products Derived from MSG-SEVIRI and Terra Aqua-MODIS Data, IEEE Journal of Selected Topics in Applied Earth Observations and Remote Sensing, 8(8),4163–4170, https://doi.org/https://doi.org/10.1109/jstars.2015. 2441096.
- Duan, S. B., Li, Z. L., Cheng, J., & Leng, P.(2017b). Cross-Satellite Comparison of Operational Land Surface Temperature Products Derived from MODIS and ASTER Data over Bare Soil Surfaces. ISPRS Journal of Photogrammetry and Remote Sensing, 126, 1–10. 2017.02.003. https://doi.org/https://doi.org/10.1016/j.isprsjprs
- Duan, S. B., Li, Z. L., & Leng, P. (2017a). A framework for the retrieval of all-weather land surface temperature at a high spatial resolution from polar-orbiting thermal infrared and passive microwave data. Remote Sensing of Environment, 195, 107–117. 04.008. https://doi.org/https://doi.org/10.1016/j.rse.2017
- Fu, P., & Weng, Q. H. (2016). A time series analysis of urbanization induced land use and land cover change and its impact on land surface temperature with Landsat imagery. Remote Sensing of Environment, 175, 205–214. https://doi.org/https://doi.org/10.1016/j.rse.2015.12.040
- Fu, P., Xie, Y. H., Weng, Q. H., Myint, S., Meacham-Hensold, K., & Bernacchi, C. (2019). A physical model-based method for retrieving urban land surface temperatures under cloudy conditions. Remote Sensing of Environment, 230(111191), 1–10. https://doi.org/https://doi.org/10.1016/j.rse.2019.05.010
- Gao, C. X., Qiu, S., Li, C. R., Tang, L. L., Ma, X. G., Qian, Y. G., Zhao, Y. G., & Ren, L. (2018). Evaluation of land surface temperature by comparing FY-3C/VIRR with Terra/MODIS and MSG/SEVIRI data. International Journal of Remote Sensing, 40(1), 1–14. https://doi.org/https://doi.org/10.1080/01431161.2018.14605
- Gao, C. X., Qiu, S., Zhao, E. Y., Li, C. R., Tang, L. L., Ma, X. G., Qian, Y. G., Zhao, Y. G., Wang, N., & Ren, L., 2017. Land Surface Temperature Retrieval From FY-3C/VIRR Data and Its Cross-Validation with Terra/MODIS. IEEE Journal of Selected Topics in A.E. Observations & R. Sensing, 10(11),4944–4953. https://doi.org/https://doi.org/10.1109/jstars.2017. 2728082.
- Garcia-Carrerass, L., Marsham, J., & Spracklen., D. (2017). Observations of increased cloud cover over irrigated agriculture in an arid environment. J. Hydrometer, 18(8), 2161–2172. https://doi.org/https://doi.org/10.1175/JHM-D-16-0208.1
- Gerber, F., Jong, R. D., Schaepman, M. E., Schaepman-Strub, G., & Furrer, R. (2018). Predicting missing values in spatio-temporal remote sensing data. IEEE, Trans. Geosci. Remote Sens, 56(5), 2841–2853. https://doi.org/https://doi.org/10.1109/TGRS.2017.2785240
- Holmes, T. R. H., De Jeu, R. A. M., Owe, M., & Dolman, A. J. (2009). Land surface temperature from Ka band (37 GHz) passive microwave observations, J. Geophys. Res.-Atmos, 114(D4), D04113. https://doi.org/https://doi.org/10.1029/2008JD010257
- Hua, A. K., & Ping., O. W. (2018). The influence of land-use/land-cover changes on land surface temperature: A case study of Kuala Lumpur metropolitan city. European Journal of Remote Sensing, 51(1), 1049–1069. https://doi.org/https://doi.org/10.1080/22797254.2018.1542976
- Jiang, G. M., Zhou, W., & Liu, R. G. (2013). Development of Split-Window Algorithm for Land Surface Temperature Estimation From the VIRR/FY-3A Measurements. Ieee Geoscience and Remote Sensing Letters, 10(4), 952–956. https://doi.org/https://doi.org/10.1109/lgrs.2013.2255859
- Jin, M. (2000). Interpolation of surface radiative temperature measured from polar orbiting satellites to a diurnal cycle: 2. Cloudy-pixel treatment. J. Geophys. Res.-Atmos, 105(D3), 4061–4076. https://doi.org/https://doi.org/10.1029/1999JD901088
- Kang, J., Tian, J. L., & Jin, R. (2018). Reconstruction of MODIS Land Surface Temperature Products Based on Multi-Temporal Information. Remote Sens, 10(7), 1122. https://doi.org/https://doi.org/10.3390/rs10071112
- Ke, L. H., Ding, X. L., & song, C. Q. (2013). Reconstruction of time-series MODIS LST in Central Qinghai-Tibet Plateau using geostatistical approach, IEEE Geosci. Remote Sens. Lett, 10(6), 1602–1606. https://doi.org/https://doi.org/10.3390/rs8020105
- Kou, X., Jiang, L., Bo, Y., Yan, S., & Chai, L. (2016). Estimation of land surface temperature through blending MODIS and AMSR-E data with the Bayesian maximum entropy method. Remote Sens, 8(2), 105. https://doi.org/https://doi.org/10.3390/rs8020105
- Lambin, E. F., & Ehrlich, D. (1995). Combining vegetation indices and surface temperature for land-cover mapping at broad spatial scales. Int. J. Remote Sens, 16(3), 573–579. https://doi.org/https://doi.org/10.1080/01431169508954423
- Li, X. W., Cao, C. X., & Chang, C. Y. (2007). The first law of geography and spatial-temporal proximity. Chinese Journal of Nature, 29(2), 69–71.
- Lu, L., Venus, V., Skidmore, A., Wang, T., & Luo, G. (2011). Estimating land-surface temperature under clouds using MSG/SEVIRI observations. Int. J. Appl. Earth Obs. Geoinf, 13(2), 265–276. https://doi.org/https://doi.org/10.1016/j.jag.2010.12.007
- Neteler, M. (2010). Estimating daily land surface temperatures in mountainous environments by reconstructed MODIS LST data. Remote Sens, 2(1), 333–351. https://doi.org/https://doi.org/10.3390/rs1020333
- Ni, B. S., Gao, Y. H., Li, Y. C., Yang, S. Q., Tang, Y. H., Li, C., & Chen, M. (2014). On Drought Monitoring Based on FY-3A/VIRR Data in Chongqing. Journal of Southwest University (Natural Science Edition), 36(7), 1–6. https://doi.org/https://doi.org/10.13718/j.cnki.xdzk.2014.07.023
- Peng, J. B., Zhang, Q. Y., & Bueh, C. (2007). On the Characteristics and Possible Causes of A Severe Drought and Heat Wave in the Sichuan-Chongqing Region in 2006. Climatic and Environmental Research, 12(3), 464–474. (2007)03-0464-11
- Price, J. C. (1990). Using spatial context in satellite data to infer regional scale evapotranspiration. IEEE, Trans. Geosci. Remote Sens, 28(5), 940–948. https://doi.org/https://doi.org/10.1109/36.58983
- Sandholt, I., Rasmussen, K., & Andersen, J. (2002). A simple interpretation of the surface temperature/vegetation index space for assessment of surface moisture status. Remote Sens. Environ, 79(2–3), 213–224. https://doi.org/https://doi.org/10.1016/s0034-4257(01)00274-7
- Shen, H. F., Li, X. H., Cheng, Q., Zeng, C., Yang, G., Li, H. F., & Zhang, L. P. (2015). Missing Information Reconstruction of Remote Sensing Data: A Technical Review. IEEE Geoscience and Remote Sensing Magazine, 3(3), 61–85. https://doi.org/https://doi.org/10.1109/mgrs.2015.2441912
- Shuai, T., Zhang, X., Wang, S. D., Zhang, L. F., Shang, K., Chen, X. P., & Wang, J. N. (2014). A spectral angle distance-weighting reconstruction method for filled pixels of the MODIS land surface temperature product, IEEE Geosci. Remote Sens. Lett, 11(9), 1514–1518. https://doi.org/https://doi.org/10.1109/LGRS.2013.2297735
- Sobrino, J. A., Jiménez-Muñoz, J. C., & Paolini, L. (2004). Land surface temperature retrieval from LANDSAT TM 5. Remote Sensing of Environment, 90(4), 434–440. https://doi.org/https://doi.org/10.1016/j.rse.2004.02 003
- Sun, L., Anderson, M. C., Gao, F., Hain, C., Alfieri, J. G., Sharifi, A., McCarty, G. W., Kustas, W. P., Kustas, W. P., & Mckee, L. (2017a). Investigating water use over the Choptank River Watershed using a multisatellite data fusion approach. Water Resources Research, 53(7), 5298–5319. https://doi.org/https://doi.org/10.1002/2017WR020700
- Sun, L., Chen, Z. X., Gao, F., Anderson, M., Song, L. S., Wang, L. M., Hu, B., & Yang, Y. (2017b). Reconstructing daily clear-sky land surface temperature for cloudy regions from MODIS data. Computers & Geosciences, 105(aug), 10–20. https://doi.org/https://doi.org/10.1016/j.cageo.2017.04.007
- Sun, L., Sun, R., Li, X. W., Liang, S. L., & Zhang, R. H. (2012). Monitoring surface soil moisture status based on remotely sensed surface temperature and vegetation index information. Agricultural and Forest Meteorology, 166-167, 175–187. 166-167. https://doi.org/https://doi.org/10.1016/j.agrformet.2012.07.015
- Tang, B. H., Shao, K., Li, Z. L., Wu, H., Nerry, F., & Zhou, G. Q. (2015). Estimation and Validation of Land Surface Temperatures from Chinese Second-Generation Polar-Orbit FY-3A VIRR Data. Remote Sens, 7(3), 3250–3273. https://doi.org/https://doi.org/10.3390/rs70303250
- Tang, Y. Q., Zhang, J. H., & Wang, J. S. (2014). Meteorological Satellites and the Applications. Chin. J. Space Sci, 34(5), 703–709. https://doi.org/https://doi.org/10.11728/cjss2014.05.703 FY-3
- Tian, G. L. (2006). Thermal Remote Sensing (pp. 282–283). Publishing House of Electronics Industry.
- Tobler, W. (1970). A computer movie simulating urban growth in the detroit region. Economic Geography, 46(2), 230–240. https://doi.org/https://doi.org/10.2307/143141
- Wang, S. J., Cui, P., Zhang, P., Ran, M. N., Lu, F., & Wang, W. H. (2014). The improvement of FY3B/VIRR SST algorithm and its accuracy. Journal of Applied Meteorology, 25(6),701–710. doi:https://doi.org/10.11898/1001-7313.20140606.
- Wang, T. X., Shi, J. C., Ma, Y., Letu, H., Edward, C. P., Ji, D. B., Zhao, T. J., & Xiong, C. (2019). Recovering land surface temperature under cloudy skies considering the solar‐cloud‐satellite geometry: Application to MODIS and Landsat‐8 data. Journal of Geophysical Research: Atmospheres, 124, 3401–3416. https://doi.org/https://doi.org/10.1029/2018JD028976
- Westermann, S., Langer, M., & Boike, J. (2011). Spatial and temporal variations of summer surface temperatures of high-arctic tundra on Svalbard-Implications for MODIS LST based permafrost monitoring. Remote Sensing of Environment, 115(3), 908–922. https://doi.org/https://doi.org/10.1016/j.rse.2010.11.018
- Wu, M. X., & Lu, H. Q. (2016). A modified vegetation water supply index (MVWSI) and it’s application in drought monitoring over Sichuan and Chongqing, China. Journal of Integrative Agriculture, 15(9), 2132–2141. https://doi.org/https://doi.org/10.1016/s2095-3119(15)61257-6
- Xu, N., Chen, L., Hu, X. Q., Zhang, L. Y., & Zhang, P. (2014). Assessment and Correction of on-Orbit Radiometric Calibration for FY-3 VIRR Thermal Infrared Channels. Remote Sens, 6(4), 2884–2897. https://doi.org/https://doi.org/10.3390/rs6042884
- Yang, J., Zhang, P., Lu, Z. D., Shi, J. M., & Dong, C. H. (2012). Improvements on global meteorological observations from the current FengYun 3 satellites and beyond. International Journal of Digital Earth, 5(3), 251–265. https://doi.org/https://doi.org/10.1080/17538947.2012.658666
- Yang, S. Q., Zhang, D. J., Sun, L., Wang, Y. Q., & Gao, Y. H. (2020). Assessing Drought Conditions in Cloudy Regions Using Reconstructed Land Surface Temperature. Journal of Meteorological Research, 34(2), 264–279. https://doi.org/https://doi.org/10.1007/s13351-020-9136-4
- Yang, Z. D., Zhang, P., Gu, S. Y., Hu, X., Tang, S., Yang, L., Xu, N., Zhen, Z., Wang, L., Wu, Q., Dou, F., Liu, R., Wu, X., Zhu, L., Zhang, L., Wang, S., Sun, Y., & Bai, W. (2019). Capability of Fengyun-3D satellite in earth system observation. Journal of Meteorological Research, 33(6), 1113–1130. https://doi.org/https://doi.org/10.1007/s13351-019-9063-4
- Yueqing, L. (2003). Surface heating in the Tibetan plateau and general circulation over It and their relations with the prediction of drought-flood at its eastern side. Chinese Journal of Atmospheric Sciences, 27(1), 107–114. https://doi.org/https://doi.org/10.3878/j.1006-9895.2003.01.10
- Zeng, C., Long, D., Shen, H. F., Wu, P. H., Cui, Y. K., & Hong, Y. (2018). A two-step framework for reconstructing remotely sensed land surface temperatures contaminated by cloud. ISPRS Journal of Photogrammetry and Remote Sensing, 141, 30–45. https://doi.org/https://doi.org/10.1016/j.isprsjprs.2018.04.005
- Zeng, C., Shen, H. F., Zhong, M. L., Zhang, L. P., & Wu, P. H. (2015). Reconstructing MODIS LST Based on Multitemporal Classification and Robust Regression. IEEE Geoscience and Remote Sensing Letters, 12(3), 512–516. https://doi.org/https://doi.org/10.1109/LGRS.2014.2348651
- Zhang, D. J., Yang, S. Q., Wang, Y. Q., & Gao, Y. H. (2017). Application of Temperature Vegetation Dryness Index to Drought Monitoring in Chongqing Based on FY-3 Data. Plateau and Mountain Meteorology Research, 37(4), 40–47. doi:https://doi.org/10.3969/j.issn.1674-2184.2017.04.007
- Zou, X. K., & Gao, H. (2007). Analysis of severe drought and heat wave over the Sichuan basin in the summer of 2006. Advances In Climate Change Research, 3(3), 149–153.