
 ?Mathematical formulae have been encoded as MathML and are displayed in this HTML version using MathJax in order to improve their display. Uncheck the box to turn MathJax off. This feature requires Javascript. Click on a formula to zoom.
ABSTRACT
Environmental changes significantly affect urban ecological systems that are supported by green infrastructure. Therefore, assessment of the health of green infrastructure is virtually a quality assessment of the residential environment. For the sustainable and healthy management of urban environments, we need an effective system for estimating, diagnosing, and constructing assessment tools for green infrastructure. In this study, remote sensing technology was used to assess the green infrastructure of the Taipei metropolitan area (Taiwan) in a systematic way. To this end, we used the comprehensive index method of vigor, organization, and resilience (VOR) to classify a landscape index and to construct a healthy assessment index. We determined the primary index and weights using the entropy weighting method to establish the assessment model. We show that the core of the metropolitan area lacks green infrastructure with the lowest VOR index, thus indicating that this district requires government-supervised intervention and improvement. We prove that the increase in green infrastructure has a promoting effect on the impact of various health assessment evaluations, and it will gradually slow down and get stabilized after reaching a certain degree. The entropy weighting method can make the data model more stable and reliable, making the results more representative.
Introduction
In civilization, a city plays an important role as a center of economic activity as well as a furnace of social changes and different cultures. The nexus between factors such as the transformation of the population structure, different economic development stages, and technological development changes directly affects the urban development of a city. The ecosystem environment is easily destroyed within a city as the quality of the urban environment degrades. Various environmental problems caused by the rapid development of cities have attracted attention to the health of urban ecosystems. Advances in ecosystem health research provide a theoretical basis and technical capability for evaluating the health status of urban ecosystems (Su et al., Citation2010). The health of ecosystems is a burning issue in environmental science, and a healthy ecosystem is generally regarded as the ultimate goal of environmental management (Y. X. Liu et al., Citation2015). A healthy ecosystem can maintain the integrity of its organizational structure, functional stability, self regulation, and recovery from stress. Most importantly, it can provide the natural resources and living habitat required for the survival and development of human beings (Yun et al., Citation2020).
Green infrastructure is a concept that originated and has been gradually formed in the three areas of human living environment, ecological protection, and green technology (Luan et al., Citation2017). Green infrastructure is an important part of urban planning strategies for enhancing sustainable development and urban resilience (Fu et al., Citation2021). This concept combines ecosystem services with human well-being to achieve effective and sustainable use of space (Wang & Banzhaf, Citation2018). Advocating green infrastructure planning as a sustainable urban development concept will improve biodiversity, the microclimate environment, and the quality of urban life, thus also providing a simple and effective means for urban environmental benefits (Cheshmehzangi & Griffiths, Citation2014). For green infrastructure, as a carrier of multiple functions, different spatial layouts will produce different ecological, social, and economic benefits (Cao & Che, Citation2020). Green infrastructure is a green open space system that may include multi-functional facilities with recreational purposes such as parks, green corridors, green networks, and ecological infrastructure (Lee, Citation2017). In other words, green infrastructure can be understood as a combination of urban open space, vegetation, waterscape and other “natural” elements in the city, as well as specialized systems that provide environmental services, such as air, water, sanitation, waste management, pollution reduction, and energy (Cheshmehzangi et al., Citation2021).
It has been proven that cities, human living ecosystems, and human health are equally important to crucial practices such as city development, infrastructure management, and municipal management (Guidotti, Citation1995). As most population is concentrated in urban areas (e.g., cities), the basic requirement for the urban environmental quality is to avoid damage to the eco-service function of ecosystem health. Ecosystems can meet human demands, provide resources, and serve as waste reservoirs. In particular, the environment can recover itself through natural purification of the ecological processes when the environmental pressure is within the regeneration ability of the ecosystem. Otherwise, the environment will adversely (and likely, irreversibly) be deteriorated. The urban ecosystem health assessment is therefore focused on various environmental issues associated with rapid urban development. This is further required to assess the health conditions of urban ecosystems, and it is urgently needed to introduce guidelines and methods for urban ecosystem assessment, urban ecosystem health, and sustainable management.
The WHO, the International Agency for Sustainable Development, the United Nations Centre for Human Settlements, and the International Joint Commission are the first to establish indicators of urban sustainable development and urban ecosystem health. The research literature shows that the health indicator system is constructed using the “Pressure-State-Response (PSR)” as the conceptual model, the “Driving Force-Pressure-State-Exposure-Effect-Action” (DPSEEA) as the mode, analysis on the model of the “Driving force-Pressure-State-Impact-Response” (DPSIR) (Edokpolo et al., Citation2019; X. Hu et al., Citation2021; Lima et al., Citation2017; L. Liu et al., Citation2019; Maria et al., Citation2019). The index system was constructed according to the spatial difference and time evolution of an urban ecosystem (Tian et al., Citation2009; S. Zhao et al., Citation2013). Some parameter-based frameworks starting from the functions of urban ecosystem health, such as vitality, function, and structure (G. Y. Liu et al., Citation2009; Yan et al., Citation2018), or from the three urban subsystems of society, economy, and nature to construct the evaluation system (Hou et al., Citation2018), or the land utilization subsystems of ecological agriculture, production, and life (Ni et al., Citation2020), distance index and coordination index (T. L. Hu et al., Citation2005), and the synthesis of energy values (representing energy) (Wang et al., Citation2018), are used to establish health indicators of urban ecosystems. The health index is key for the assessment of green infrastructure, whereas an ideal approach would be to define the affected ecosystem functions without human disturbance. However, it is difficult to find an uninterrupted urban ecosystem and therefore challenging to examine the ultimate state of urban ecosystems. In fact, the complexity and openness of urban ecosystems are explained by the uncertainty of urban ecosystems, as well as by the changing human needs and goals (Cepeliauskaite & Stasiskiene, Citation2020). As a result, our expectations of urban ecosystems have changed over time. In this context, reasonable alternatives are required to establish indicators and standards for the health of urban ecosystems.
In 1999, the vigor, organization, and resilience (VOR) comprehensive index method was acknowledged by the International Ecosystem Health Conference as the ecosystem health diagnosis index. The green land interface process can be analyzed as the integration of indexes affecting green land, such as air and land. Vigor (V) refers to the material production and quality of ecosystems from solar power, green plants, animals, and social products (or other services). Organization (O) represents the optimization ability of ecosystem structure and a function with the measurement using the combination characteristics of ecosystem features (the distribution pattern of productivity, for instance). Resilience (R) refers to the ecosystem ability to resist or rebound in response to stress, including productivity and structure recovery. In this study, the VOR comprehensive index method was used to classify the landscape measurement method to assess the environmental quality of the urban green infrastructure health assessment system.
Our study aims to establish an assessment index system for green infrastructure health. The VOR comprehensive index was used to classify the landscape index to review the environmental quality of urban green infrastructure. The Taipei metropolitan area (Taiwan) is used as a study case. Green infrastructure is quantified using the normalized difference vegetation index (NDVI) from the Landsat 8 Satellite Telemetry Image for each administrative area. The environmental quality of green infrastructure is analyzed using the landscape index for a better understanding of the environmental quality of urban green infrastructure in Taipei. The research objectives are (1) to discuss the green infrastructure literature, (2) to analyze the environmental and health assessment methods for the landscape of green infrastructure, (3) to interpret the health quality of green infrastructure, and (4) to establish an assessment model of the urban environment based on green infrastructure.
Materials and methods
Research scope
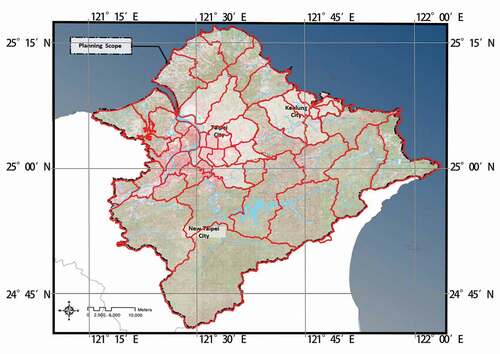
In this study, the Taipei metropolitan area is used as a study case. NDVI estimates of green coverage for each block is analyzed based on Landsat 8 satellite telemetry images. The environmental quality of the green infrastructure health assessment system was assessed using the VOR comprehensive index method through landscape measurement analysis. The research scope is Taipei metropolis (see ). An assessment model of the urban environment for green infrastructure is established to understand the environmental quality of green infrastructure.
Figure 1. The research scope
Examining the method of green infrastructure conditions
The examination of the green infrastructure conditions is based on Landsat 8 satellite imagery, NDVI, analysis and GIS database. We analyze the existing green land resources by using arbor coverage area, shrub planting area, vertical green area, turf planting area (included in GIS analysis). Spaceborne remote sensing is used for quantifying green infrastructure of each administrative district as it is an effective tool for monitoring ecosystem services in urban areas for urban planning and decision support. The higher the resolution of remote sensing satellite data, the more accurate the classification maps it can process, but the higher the processing cost will be (Avtar et al., Citation2017). To correlate the remote sensing-based estimates of NDVI, the estimates have been developed as spectral conversion, which mainly utilizes the red and infrared bands sensitive to leaf pigment. Although NDVI has been applied in many studies, it is limited by external factors and cannot provide accurate information on biophysical features and vegetation phenology in the densely vegetated areas (Arjasakusuma et al., Citation2018). As we take green infrastructure of each administrative district in the Taipei metropolitan area as a unit of a study, there is no requirement for high precision, and the Landsat 8 data (for 2018 year) is sufficient to meet our requirements.
The vegetation index is a parameter utilizing a linear or nonlinear combination of satellite detection data to reflect the existence, quantity, quality, state, and spatial distribution characteristics of vegetation (Zhang et al., Citation2012). It is suitable for monitoring conditions and changes in vegetation. Green leaves strongly reflect infrared (IR) light, so red light and infrared light in visible light are often used to determine the productivity of plants (C. Liu et al., Citation2016). Remote sensing files were obtained from the unblocked spectrum. The color frequency ranges are 0.64–0.67 μm (red), 0.53–0.59 μm (green), 0.45–0.51 μm (blue) for the visible spectrum interval and 0.85–0.88 μm for the IR spectrum. The near-IR is the most sensitive indicator of leaf health, as it is sensitive to plant differences and growth trends and expresses the photosynthesis conditions. As green plants absorb blue and red spectrum of light, but strongly reflect IR light, the combination of IR and visible reflectance characteristics can be used for quantifying planting reflection. The ratio (or the difference) between visible and near-IR light is virtually NDVI.
The calculation formula of NDVI on LANDSAT8 satellite is as follows:
NDVI =
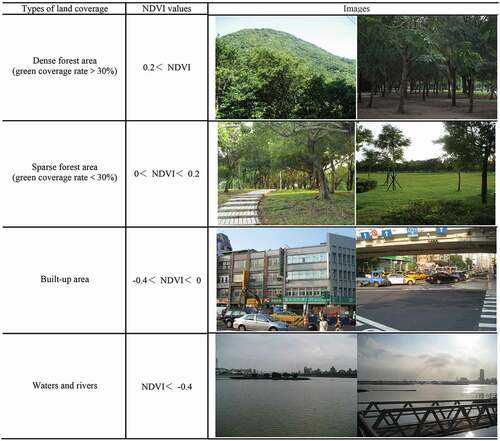
To reflect the coverage distribution of vegetation as well as the biomass of plants, vegetation index is changed into vegetation cover level, which is the simplification and inclusiveness of vegetation index and the quantitative evaluation of vegetation ecological landscape area change. The NDVI ranges between 1 and −1 (unitless), and its estimates for the current analysis are shown in .
Figure 2. Relationship between land cover categories and NDVI values
Health assessment indicator of green infrastructure
The VOR comprehensive index was acknowledged as the ecosystem health diagnosis index by the International Ecosystem Health Conference that is already widely applied in research. In particular, Y. Zhao et al. (Citation2018) used the VOR model for establishing evaluation index system, and utilized the expert consultation method and analytic hierarchy process to calculate the urban forest health assessment of the Guangzhou city (China). Their results showed that most urban forests in Guangzhou are generally healthy with few sub-healthy zones. Zhu et al. (Citation2018) quantified the health of the ecosystem in the Wenchuan earthquake area based on the VOR model, coupled with key ecosystem services, and proposed constructive solutions for future ecological restoration. Jiang et al. (Citation2020) used the VOR comprehensive index to evaluate the health of grassland ecosystems in the study area of Sunan. Their study reported that measures aimed to constrain grazing (such as fencing) can facilitate restoring the health of the grassland ecosystem. As mentioned, Vigor (V) represents ecosystem functions (J. Peng et al., Citation2015); a description of the metabolism or primary productivity of the ecosystem (Yuan et al., Citation2019). It refers to the process of converting solar energy (light energy) into chemical energy by photosynthesis from autotrophes, and then transmitting it to consumers and decomposers through the food chain (web), in which the material cycle and energy flow ecosystem are carried out. It is measured by the total amount or efficiency of material production and energy fixation in the ecosystem, such as the distribution, quantity, and growth of green infrastructure. Organization (O) refers to composition and structure of ecosystem species and their inter-species relationships, thus, expressing the complexity of the ecosystem structure (Zhu et al., Citation2018). Demonstrating the ability to optimize ecosystem structure and function as a measure of its assemblage characteristics. Resilience (R) is the ability of an ecosystem to resist (or to rebound) in response to pressure and to be resilient to external disturbances (López et al., Citation2013). The restoration of the health of green infrastructure also implies the restoration of productivity and structure (species composition). The VOR index calculation model and the corresponding methodology are established tailored to actual conditions and data characteristics of the green base, and to the reference system, whereas the current status evaluation indicators for ecosystem health assessment are determined.
A green ecosystem should adhere to the following eight standards in urban areas to maintain a coordination and a balance with the local climate: (1) Vigor, the maximum capacity supported by land (including climate), and (2) resilience. The green ecosystem can, therefore, resist climate fluctuation interference, can have stable and sustained resilience for moderate use and should have (3) organization structure. When human management is weakened over time, the system structure and productivity structure are stable, being supported by natural geographic features; and (4) the maintenance of ecosystem service function. It has a sustainable ecosystem service function, and (5) management selection. It has potential for multiple functions; (6) reducing input. Under moderate conditions, it can maintain a long-term and stable state without other human inputs; it can also (7) harm an adjacent ecosystem. Only benefit, no harm. It becomes an ecological barrier for the adjacent ecosystem’s health maintenance and (8) its influence on human health. It can provide comprehensive ecological services without any requirements (Ren et al., Citation2000). In this situation, the landscape index can be used as an index for health assessment, described as follows:
(1) Vigor (V): dense forest area (green coverage rate > 30%), category area (CA), dense forest area (green coverage rate > 30%) category area ratio (PLAND), dense forest area (green coverage rate > 30%) Patch number (NP), dense forest area (green coverage rate > 30%) Patch density (PD), sparse forest area (green coverage rate < 30%), category area ratio (CA), sparse forest area (green coverage rate < 30%) CA ratio (PLAND), sparse forest area (green coverage rate < 30%) Patch number (NP), sparse forest area (green coverage rate < 30%) PD.
(2) Organization (O): dense forest area (green coverage rate > 30%), patch area mean (A_MN), sparse forest area (green coverage rate < 30%), patch area mean (A_MN), Shannon evenness index (SHEI), green coverage connection degree (COHESION), and corridor density index (ED).
(3) Resilience (R): richness density (PRD), Shannon’s diversity index (SHDI), Simpson diversity index (SIDI), population density, building area, and waste amount per capita.
The landscape index usually refers to spatial structural characteristics of a landscape. According to the landscape ecology theory, each ecosystem can be analyzed based on its landscape components (e.g., their structure, morphology, and functions, such as patches, corridors, matrices, and networks). From this point, a patch is the most fundamental measurement of the landscape index, manifested at different scales. The land use classification map, constructed using satellite images (being validated and corrected), is converted into administrative districts of the Taipei Metropolitan area to perform the analysis of the landscape index. The landscape index was calculated for the classified images by synergetic use of ArcGis with FRAGSTATS, developed by McGarigal and Mark from the U.S. Department of Agriculture (USDA).
Entropy weighting method
Our study creates an indicator system based on the definition of urban green infrastructure health using VOR methods, such as vitality, organization, and resilience. This research is based on a multi-attribute index, but the index system lacks a weighting basis. In the evaluation of multi-attribute decision-making, attribute weight values play a very important role, and different attribute weight estimates may result in completely different results. Weights are usually divided into subjective and objective types. Subjective types imply that a weight is often determined arbitrarily and they, therefore, lack ideal objectivity. Meanwhile, objective weights assign weight values objectively, without adding subjective conditions, to avoid distortion in the calculation of weights due to the personal influence of the judges (Hsu, Citation2004). The entropy weight method, proposed by Shannomy in 1948, usually uses uncertainty dropout metrics and is widely applied in economics, image transmission, and thermodynamics. Here, entropy refers to an irregular measurement or disorder. Physically, the larger the entropy value, the greater is the randomness of the data. In terms of attribute weight measurement, the more randomly measured value and the larger difference for an attribute indicate that this attribute is more valuable in its reference with greater weight. We use the entropy weight method to determine the main indicators and weights. We also utilize the information in the evaluation matrix to obtain relative weights between the criteria, and to create an evaluation model (Lin & Cai, Citation2019). Ji (Citation2018) used the entropy weighting method to calculate a weight of each sensitive land and objectively divided an urban planning area into protected and non-protected areas. C. Peng et al. (Citation2019) applied the comprehensive method of entropy and analytic hierarchy process to determine the required index weights, thereby, objectively evaluating the quality of the forest belt around the Wuhan city (China) based on the survey data. We describe the exact procedure used in our study below.
Foremost, the data were standardized using the efficacy coefficient method using EquationEq. 1(1)
(1) shown below.
We assume that the index system, consisting of m indexes, is used to assess n programs or products, the ith index value of the jth program is xij (i = 1,2, …, m; j = 1,2, …, n) (Su, Citation2004). The entropy weight method determines the weight of the index according to the amount of information transmitted to a decision-maker by each indicator. As the original data (xij) can be non-positive, the weight of each indicator must be foremost calculated from the normalized data yij (1-β≤ yij≤1). For a given i, when the values of j are different, the larger the difference in yij, the more information the indicator contains and transmits, indicating a greater effect on the given indicator. The increase in the information corresponds to a decrease in entropy, which can be measured by the amount of measurement information (Su, Citation2004). We further list the steps for determining the index weight using the entropy weight method. First, we calculate the proportion of the value of the jth plan or product indicator under the ith indicator as shown in EquationEq. 2(2)
(2) .
Then, we calculate the entropy value of the ith indicator (see EquationEq. 3(3)
(3) below).
After this, we calculate the difference coefficient of index i: for a given i, for the different values of j. If the difference is smaller, ei is larger; if j = 1, 2, 3 … n, yij are all equal, then ei = emax = kln n. At this time, the ith indicator has no effect on the comprehensive evaluation of the program or product. for the different values of j. If the yij difference is higher, ei is lower, the ith indicator has a greater effect on the comprehensive evaluation of the program or product. Therefore, the difference coefficient gi = 1 – ei, the larger the gi, the more attention is paid to the role of the ith indicator (Su, Citation2004). Ultimately, we calculate the weight of the ith index is calculated as shown in EquationEq. 4(4)
(4) below.
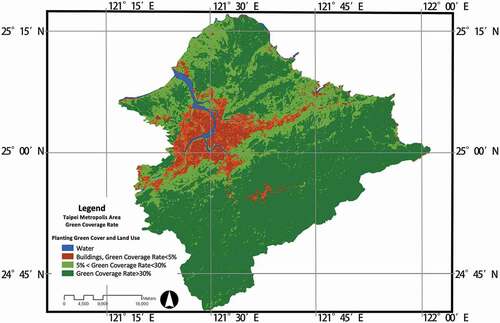
Results
In this study, the distribution of green infrastructure in the Taipei metropolitan area (Taipei hereafter) was quantified via a survey and analysis of the current status of the green infrastructure (as shown in ). The analysis table of various indicators in the administrative districts of Taipei was acquired using the green infrastructure health assessment (). In this study, the landscape measurement method was classified and assessed. Here, V refers to a dense forest area (green coverage > 30%) and a sparse forest area (green coverage < 30%) and has a total of eight items: CA, PLAND, NP and PD; O refers to a dense forest area (green coverage > 30%) and a sparse forest area (green coverage < 30%) and has a total of five items: A_MN, SHEI, COHESION, and ED; R has a total of six items: PRD, SHDI, SIDI, population density, building area, and waste amount per capita. The VOR of vegetation health assessment is calculated as shown in EquationEq. 5(5)
(5) below.
Table 1. Index of green infrastructure health assessment
Table 2. Analysis of various indicators in administrative districts of the Taipei metropolitan area
Figure 3. Green infrastructure distribution in Taipei metropolis area
Wv, Wo, and WR are the weight coefficients of V, O, and R, respectively, expressing the importance of each individual factor. It advantageously avoids or alleviates errors stemming from uncertainty data background, inhomogeneity of natural space, or time volatility.
Discussion
Differences after entropy weighting method
shows how various evaluation indices are calculated for this study. Namely, we perform regression analysis on each evaluation index and NDVI estimate, and compare trends () to effectively analyze the relationship between the entropy values before and after weighting (for each evaluation index). We found that after entropy weighting, each index model becomes more convergent and the data becomes more stable, which is more significant in the V–value, R value, and VOR value models, but not in the O-value model. The O value model is not significant because the entropy weighting effect is not completely applicable to each data model, but plays a stabilizing role for most of the overall data models as a whole. Also, each data model is significantly changed between in the 0.2–0.3 NDVI range, and it is gradually flat for NDVI > 0.3. Nevertheless, they can all exhibit the same challenge as the degree of greening has a promoting effect on the impact of each VOR value. When the degree of greening reaches a certain extent, the promotion effect is relatively slow and flat.
Table 3. The evaluation value of each district based on the entropy weighting calculation of the green infrastructure of the Taipei metropolitan area
Figure 4. Comparison of VOR and various indexes with the original index weighted by entropy value
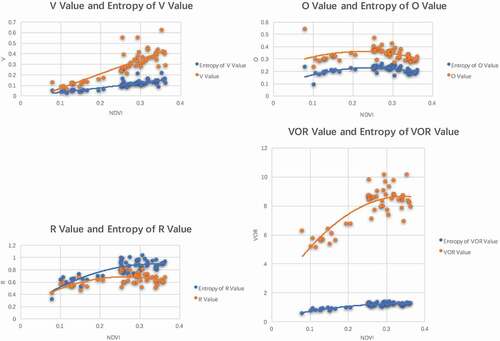
We performed the correlation analysis between the Taipei Green Infrastructure Health assessment and the green infrastructure. We show that the correlation coefficients of NDVI and VOR comprehensive evaluation values, V, O, and R, weighted by the entropy value, are as following: R-squared value in V index is 0.69, in O index is 0.34, in R index is 0.68 and in VOR index is 0.78. Before the entropy weighting, the correlation coefficients of NDVI and VOR comprehensive evaluation value, V, O, and R individual indicators are as following: R-squared value in V index is 0.68, in O index is 0.09, in R index is 0.35 and in VOR index is 0.68. This finding indicates that the green infrastructure has the strong correlation with each evaluation index and the weak correlation with organizational power. After the entropy value is weighted, R-squared is more integrated, thus, becoming more reliable.
Health assessment index of green infrastructure
Taipei is a very large urban area, and it is difficult to display all regional characteristics only by the analysis of the entire area. Therefore, a zonation analysis was carried out with higher spatial scales. The quartile method is used to divide the health assessment of each administrative district into four locations (see and ). The evaluation status of individual indexes in the health assessment of the Taipei Green Infrastructure is described as shown further.
Table 4. The division of the green infrastructure health evaluation index
Figure 5. Taipei metropolitan area green infrastructure health evaluation index
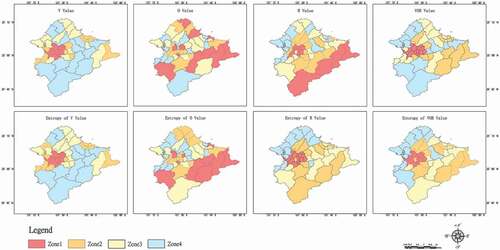
For health assessment, the Vigor (V) index group indicates the distribution of dense forest areas and sparse forest areas of green infrastructure in each administrative zone (the value is directly proportional to zone’s size). Also, the greater the number of green lands, the higher the density of green land, indicating larger amount of green infrastructure. At one hand, Zone-4 high-value areas are mainly located in the suburbs, with more mountainous areas and wider green areas, so the vitality (V) index performs better. On the other hand, the low-value area of Zone-1 is mainly located in the downtown area, with a relatively small green area and relatively low density of green land.
The organization (O) index health assessment shows A_MN, SHEI, COHESION, and ED analysis. The superior areas features a better connection between green infrastructure and networks. For instance, Zone-4 high-value areas are mainly located in new urban development zones, with a higher level of community planning, more uniform green area distribution, and better green corridors, so the organization (O) index performs better. At the same time, the low-value area of Zone-1 is mainly located in the areas that have been developed many years ago, where the community planning level is too high, and the green infrastructure network is relatively poor.
The R index health assessment indicates rich types of green infrastructure, density, and variety, as well as other indices of damaging green infrastructure, such as population density, building area, and waste amount per capita. Zone-4 high-value areas are mainly located in the suburbs with a smaller urban population, with fewer urban construction areas, larger natural landscapes, and richer green infrastructure types, so the resilience (R) index performs better. The low-value area of Zone-1 is mostly clustered in the central area that features larger population, less green land areas and green infrastructure types, and a higher waste per capita.
The VOR health assessment analysis reveals the overall health assessment of the green infrastructure. Zone 4 high-value areas are mainly located in the newly developed suburbs of the city. This area has more mountainous, richer types of green infrastructure, and the area has a higher degree of community planning and good road network connectivity. Therefore, at one hand, the VOR index performed better. On the other hand, the low-value area of Zone-1 corresponds to the central area of the city, with a high population density, a large amount of waste per capita, a smaller green land area, and a lack of green infrastructure.
The entropy weighting method makes the administrative regions of each district more likely to be unified development types of areas, and the entropy weighted V value, R value, and VOR value have a certain degree of similarity overall. The similarity of the R value and VOR value is extremely high, but the O value is rather different to the other indices.
Conclusions
This study established an assessment index system for green infrastructure health. The VOR comprehensive index was utilized to classify the landscape index to review the environmental quality of urban green infrastructure.
We showed that (1) there is a lack of green infrastructure in the city center of Taipei metropolitan area. The distribution of green infrastructure has gradually increased from the areas forming the urban core to the urban suburbs, mountainous areas, and the surrounding areas of the city (that are quite different from the urban core area). We surmise that urban development had exerted negative impacts on green infrastructure facilities, and devastation of green infrastructure in the highly planned urban core area had been severe, while a type of land also had a certain impact on green infrastructure.
This study (2) integrated various evaluation indices, (VOR, NDVI) for the regression analysis to study the relationship between them, while also exploring the impact of the entropy weighting method on the model. First, the increase of the green infrastructure has a promoting effect on the influence of various VOR values. The most significant effect is evidenced for the NDVI range of 0.2–0.3 (but when the NDVI lager than 0.3, the promotion effect will slow down and become flat). Second, the green infrastructure has a close relationship with various evaluation indices such as VOR (the correlation is strong). The correlation is stronger through the entropy weighting method, which makes the data model more credible. The entropy weighting method could converge some scattered estimates, which would have led the overall data model performance to be more stable, thus, making the model more representative.
The study (3) analyzed Taipei in the form of the quartile division of the VOR and other indices (before and after the entropy weighting method). After the entropy weighting method is applied, the results of each division are more likely to be the same development type of area. In this case, the vitality index of the suburbs is better, the organization index of the new urban development areas is higher, the resilience index of the suburbs with less population is better, and the vitality index and resilience index of the downtown areas are both poor. The old developed area performed poorly in terms of the organization index. The areas with high VOR indices are mostly concentrated in the newly developed suburbs of the city, with an average VOR value of 1.3236, indicating that the health assessment of green infrastructure in these areas is also relatively good. This is reasonable as the newly developed suburbs of the city are mostly located in the outskirts of the urban area and feature more mountainous landscape. The foundation of green infrastructure is better, and these areas have relatively low population densities and were developed according to scientifically sound and reasonable urban planning and design. The areas with the lower VOR index were mostly concentrated in the downtown (the average VOR = 0.8476). This is explainable as these areas have high population density, over-planning, low degree of green land, and low green infrastructure abundance. Therefore, these areas urgently require governmental intervention for further improvement.
In this study, a health index and evaluation method for green infrastructure were developed. We used remote sensing detection technology to evaluate and to analyze the green infrastructure in the Taipei metropolitan area, using the VOR comprehensive index as the evaluation framework, constructing a health evaluation index with a landscape index, and then using the entropy weight method to establish the evaluation model. A comprehensive health evaluation of its green infrastructure was carried out for Taipei as a study case. Our study suggested a new diagnostic system for the health assessment of urban green infrastructure. It is beneficial to examine the environmental quality of green infrastructure in urban areas using this system. In future studies, it can be further evaluated whether this system can be turned into the basis for the sustainable management of urban environmental health for wider selection of cities. Our results can also provide the government agencies in Taipei, not only the effective diagnostic system for assessing urban health, but also the analysis method applicable for the areas of local governance that are deficient and need to be reinforced. This will facilitate formulation and promotion of urban policy guidelines in the future. From global perspective, this methodology has promising prospects to be applied in other urban areas (e.g., cities) worldwide.
Disclosure statement
No potential conflict of interest was reported by the author(s).
References
- Arjasakusuma, S., Yamaguchi, Y., Nakaji, T., Kosugi, Y., Shamsuddin, S. A., & Lion, M. (2018). Assessment of values and trends in coarse spatial resolution NDVI datasets in Southeast Asia landscapes. European Journal of Remote Sensing, 51(1), 863–877. https://doi.org/https://doi.org/10.1080/22797254.2018.1496799
- Avtar, R., Kumar, P., Oono, A., Saraswat, C., Dorji, S., & Hlaing, Z. (2017). Potential application of remote sensing in monitoring ecosystem services of forests, mangroves and urban areas. Geocarto International, 32(8), 874–885. https://doi.org/https://doi.org/10.1080/10106049.2016.1206974
- Cao, C., & Che, S. (2020). Suitability evaluation of green infrastructures based on MCR model a case study of Liantang township, Qingpu district, Shanghai. Journal of Northwest Forestry University, 35(6), 304–312.
- Cepeliauskaite, G., & Stasiskiene, Z. (2020). The framework of the principles of sustainable urban ecosystems development and functioning. Sustainability, 12(2), 720. https://doi.org/https://doi.org/10.3390/su12020720
- Cheshmehzangi, A., Butters, C., Xie, L., & Dawodu, A. (2021). Green Infrastructures for Urban Sustainability: Issues, Implications, and Solutions for Underdeveloped Areas. Urban Forestry & Urban Greening, 59, 127028. https://doi.org/https://doi.org/10.1016/j.ufug.2021.127028
- Cheshmehzangi, A., & Griffiths, C. J. (2014). Development of green infrastructure for the city: A holistic vision towards sustainable urbanism. Journal of Architecture and Environment, 2(2), 13–20. https://doi.org/https://doi.org/10.12966/ae.05.01.2014
- Edokpolo, B., Allaz-Barnett, N., Irwin, C., Issa, J., Curtis, P., Green, B., Hanigan, I., & Dennekamp, M. (2019). Developing a Conceptual Framework for Environmental Health Tracking in Victoria, Australia. International Journal of Environmental Research and Public Health, 16(10), 1748. https://doi.org/https://doi.org/10.3390/ijerph16101748
- Fu, X., Hopton, M. E., & Wang, X. (2021). Assessment of green infrastructure performance through an urban resilience lens. Journal of Cleaner Production, 289, 125146. https://doi.org/https://doi.org/10.1016/j.jclepro.2020.125146
- Guidotti, T. (1995). Perspective on the health of urban ecosystems. Ecosystem Health, 1(3), 141–149.
- Hou, Q. H., Zhu., W. T., Liu, X. Y., & Zhang, X. (2018). Urban ecosystem health assessment inside Xi’an by multivariate data. Journal of Environmental Protection and Ecology, 19(3), 1016–1025. https://www.researchgate.net/publication/328852971_Urban_ecosystem_health_assessment_inside_Xi'an_by_multivariate_data
- Hsu, J.-C. (2004). Evaluation of the business operation performance by applying grey relational analysis and TOPSIS method .r Thesis. I-SHOU University].
- Hu, T. L., Yang, Z. F., He, M. C., & Zhao, Y. W. (2005). An urban ecosystem health assessment method and its application. Acta Scientiae Circumstantiae, 25(2), 269–274. https://doi.org/https://doi.org/10.13671/j.hjkxxb.2005.02.025
- Hu, X., Ma, C., Huang, P., & Guo, X. (2021). Ecological vulnerability assessment based on AHP-PSR method and analysis of its single parameter sensitivity and spatial autocorrelation for ecological protection–A case of Weifang City, China. Ecological Indicators, 125, 107464. https://doi.org/https://doi.org/10.1016/j.ecolind.2021.107464
- Ji, Y.-M. (2018). A study on conservation zoning of urban plan area- a case of Taichung harbor special di strict pan. Feng Chia University].
- Jiang, J., Sun, B., Pan, D., Wang, H., Li, X., Wang, H., & Yu, H. (2020). VOR Index Based Health Assessment of Grassland Ecosystem in Sunan County. China Herbivore Science, 40(4), 39–43.
- Lee, T. I. (2017). Connecting Green Infrastructure to Urban Regeneration: The UK Experience. Journal of Architecture, (102), 19–35. https://doi.org/https://doi.org/10.3966/101632122017120102002
- Lima, V. M., Fonseca da Costa, S. M., & Ribeiro, H. (2017). A contribution from the DPSIR methodology to the study of a small town in the Amazon: Ponta de Pedras, Para, Brazil. Saude E Sociedade, 26(4), 1071–1086. https://doi.org/https://doi.org/10.1590/s0104-12902017170861
- Lin, H., & Cai, C. (2019). An empirical exploration of green tourism with experimental marketing: Using grey relational and entropy analysis. Taiwan Journal of Marketing Science, 15(2), 111–146. https://doi.org/https://doi.org/10.3966/181666012019101502002
- Liu, C., Sun, P. S., & Liu, S. R. (2016). A review of plant spectral reflectance response to water physiological changes. Chinese Journal of Plant Ecology, 40(1), 80. https://doi.org/https://doi.org/10.17521/cjpe.2015.0267
- Liu, G. Y., Yang, Z. F., Chen, B., Zhang, Y., Zhang, L. X., Zhao, Y. W., & Jiang, M. M. (2009). Emergy-based urban ecosystem health assessment: A case study of Baotou, China. Communications in Nonlinear Science & Numerical Simulation, 14(3), 972–981. https://doi.org/https://doi.org/10.1016/j.cnsns.2007.09.017
- Liu, L., Zhang, Q., Wang, C. L., Zhang, K., & Zhang, X. (2019). Comprehensive eco-environmental impact assessment of urban planning based on pressure-state-response model. Applied Ecology and Environmental Research, 17(6), 14455–14463. https://doi.org/https://doi.org/10.15666/aeer/1706_1445514463
- Liu, Y. X., Peng, J., Wang, A., Xie, P., & Han, Y. N. (2015). New research progress and trends in ecosystem health. Acta Ecologica Sinica, 35(18), 5920–5930. https://doi.org/https://doi.org/10.5846/stxb201401060032
- López, D. R., Brizuela, M. A., Willems, P., Aguiar, M. R., Siffredi, G., & Bran, D. (2013). Linking ecosystem resistance, resilience, and stability in steppes of North Patagonia. Ecological Indicators, 24, 1–11. https://doi.org/https://doi.org/10.1016/j.ecolind.2012.05.014
- Luan, B., Chai, M. W., & Wang, X. (2017). Review of development, frontiers, and prospects of green infrastructure. Acta Ecologica Sinica, 37(15), 5246–5261. https://doi.org/https://doi.org/10.5846/stxb201605100903
- Maria, N. C., Medeiros-Sousa, A. R., & Slovic, A. D. (2019). An Environmental Health Typology as a Contributor to Sustainable Regional Urban Planning: The Case of the Metropolitan Region of São Paulo (MRSP). Sustainability, 11(20), 5800. https://doi.org/https://doi.org/10.3390/su11205800
- Ni, Y. W., Liu, Y., Yan, S. Y., Ai, X., & Zheng, X. (2020). Land use planning based on regional ecosystem health assessment—A case study of Beijing. Chinese Landscape Architecture, 36(9), 110–115. https://doi.org/https://doi.org/10.19775/j.cla.2020.09.0110
- Peng, C., Dian, Y., Zhou, Z., Cheng, W., Xiao, Z., Dong, L., & Li, X. (2019). Quality evaluation and analysis on factors affecting the quality of the forest belt around Wuhan city. Forest Resources Management, (6), 75–83+131. https://doi.org/https://doi.org/10.13466/j.cnki.lyzygl.2019.06.014
- Peng, J., Liu, Y., Wu, J., Lv, H., & Hu, X. (2015). Linking ecosystem services and landscape patterns to assess urban ecosystem health: A case study in Shenzhen City, China. Landscape and Urban Planning, 143, 56–68. https://doi.org/https://doi.org/10.1016/j.landurbplan.2015.06.007
- Ren, H., Yan, J., & Peng, S. (2000). Evaluation and monitoring of ecosystem health. Tropical Geography, 20(4), 310–316. http://www.rddl.com.cn/EN/Y2000/V20/I4/310
- Su, M., Fath, B. D., & Yang, Z. (2010). Urban ecosystem health assessment: A review. Science of the Total Environment, 408(12), 2425–2434. https://doi.org/https://doi.org/10.1016/j.scitotenv.2010.03.009
- Su, Y. (2004). Applying Entropy Weighting Method and Gray Theory to Product Design, Master Thesis. National Cheng Kung University] .
- Tian, G. E., Lu, Y. H., Gu, F., Liu, N. N., & Chen, X. Q. (2009). Methodology of urban ecosystem health assessment. Journal of Chinese Urban Forestry, 7(1), 57–60.
- Wang, J., & Banzhaf, E. (2018). Towards a better understanding of Green Infrastructure: A critical review. Ecological Indicators, 85, 758–772. https://doi.org/https://doi.org/10.1016/j.ecolind.2017.09.018
- Wang, Z. Y., Ma, J. J., Chen, X. X., Zhao, D., Teng, T., & Yang, Y. C. (2018). Assessment on ecological health of three developed core districts in Xi’an based on emergy analysis. Research of Soil and Water Conservation, 25(4), 317–323. https://doi.org/https://doi.org/10.13869/j.cnki.rswc.20180307.001
- Yan, S. Y., Zhu, X., Liu, T., & Deng, Y. T. (2018). Research on planning response strategy based on urban ecosystem health assessment. Journal of Human Settlements in West China, 33(4), 54–59. https://doi.org/https://doi.org/10.13791/j.cnki.hsfwest.20180409
- Yuan, M. N., Liu, Y. X., Wang, M., Tian, L., & Peng, J. (2019). Ecosystem health assessment based on the framework of vigor, organization, resilience and contribution in Guangzhou City. Chinese Journal of Ecology, 38(4), 1249. https://doi.org/https://doi.org/10.13292/j.1000-4890.201904.026
- Yun, J., Jin, W., Yang, S., Hao, G., Xu, L., & Yan, Y. (2020). Health evaluation of lake ecosystem of west bank of Wangyu River based on structural equation model. Environmental Sci? Ence & Technology, 43(6), 216–222. https://doi.org/https://doi.org/10.19672/j.cnki.1003-6504.2020.06.028
- Zhang, Y., Jiang, P., & Chen, Y. Y. (2012). Study on heat island effect in Wuhan city based on land sat TM remote sensing. Ecology and Environmental Sciences, 21(5), 884–889. https://doi.org/https://doi.org/10.16258/j.cnki.1674-5906.2012.05.018
- Zhao, S., Chai, L. H., Li, P. F., & Cheng, H. X. (2013). Urban ecosystem health assessment model and its application: A case study of Tianjin. Acta Scientiae Circumstantiae, 33(4), 1173–1179. https://doi.org/https://doi.org/10.13671/j.hjkxxb.2013.04.020
- Zhao, Y., Xu, Z., & Wen, X. (2018). Urban forest health evaluation in Guangzhou city. Journal of Chinese Urban Forestry, 16(3), 12–16.
- Zhu, J., Lu, H., Wang, H., Yan, Y., & Tang, L. (2018). Ecosystem health assessment of the Wenchuan earthquake hard-hit disaster areas during the recovery period. Acta Ecologica Sinica, 38(24), 9001–9011. https://doi.org/https://doi.org/10.5846/stxb201808081684