
 ?Mathematical formulae have been encoded as MathML and are displayed in this HTML version using MathJax in order to improve their display. Uncheck the box to turn MathJax off. This feature requires Javascript. Click on a formula to zoom.
ABSTRACT
The new era of cloud platform technologies opens up many opportunities for near real-time dissemination of disaster information to the end-users. The present study utilizes the European Space Agency (ESA) Research and Service Support (RSS) CloudToolbox platform to monitor the spatio-temporal dynamics of a flood event. A collective flood monitoring framework is formulated to rapidly assess cyclone-induced flood in the CloudToolbox platform. The outputs of the framework are spatio-temporal maps of flood extent, depth, and hot spot zones. The framework utilizes Earth Observation (EO) images such as optical and C-band Synthetic Aperture Radar (SAR) images and an automatic Kittler and Illingworth thresholding algorithm for rapid flood mapping. The temporal flood depth maps are created with the Floodwater Depth Estimation Tool (FwDET) which requires only two input parameters, viz. flood extent, and Digital Elevation Model (DEM). Subsequently, flood hotspot zones are also identified. We tested the flood monitoring framework on Amphan cyclone-induced flood event at both regional and local levels. The spatio-temporal flood extent, depth, and hot spot maps are generated for the Amphan cyclone event and a 97% overall accuracy is achieved at the local level. The entire process took less than one hour for regional and local level analysis.
Introduction
Climate change contributed to the increased frequency and magnitude of floods globally as per the Intergovernmental Panel on Climate Change reports (C. S. Bahinipati, Citation2014; H.-O. Pörtner et al., Citation2019). Floods and hurricanes/cyclones contribute to immense economic damages and are considered as costliest disasters globally (X. X. Huang et al., Citation2008; NDMA, Citation2008). During the span of the cyclone event, crucial information representing in the form of geospatial maps such as flood inundated regions/locations, flood depth, and risk/safe zone will help to carry out disaster response (Panhalkar & Jarag, Citation2017) and relief operations effectively (Chini et al., Citation2019; Chung et al., Citation2015; Kiage et al., Citation2005). Also, the dissemination of cyclone-induced flood information to the end-users, viz. disaster personal, and civilians can help in mitigating the damages (Domeneghetti et al., Citation2019; Matgen et al., Citation2011; Schumann et al., Citation2018). Remote sensing is widely utilized and considered a robust technology for spatio-temporal monitoring of cyclone events as well as induced damages (Horstmann et al., Citation2015, Citation2013; Roy et al., Citation2010). Synthetic Aperture Radar (SAR) imaging technology is mostly preferred over optical remote sensing due to its ability to operate day/night and also SAR signals can penetrate through the clouds for obtaining useful information (Dewan et al., Citation2006; Kiage et al., Citation2005).
The flooded regions in the SAR image appear in the dark tone due to specular reflection resulting in low radar backscatter values σ°, which is the basic principle for separating the flood from non-flood regions. Many studies (Bhatt et al., Citation2021; Sherpa et al., Citation2020) have shown the applicability of SAR images for rapid flood monitoring, wherein the flood events are triggered by heavy rainfall, storm surge, and overflow of the river (Manavalan, Citation2018; Shen et al., Citation2019). The disastrous flood event of Kerala, India, occurred in 2018 was analyzed using multi-temporal SAR images with radar backscatter (σ°) intensity images given as inputs in various flood mapping methods (Jacinth Jennifer et al., Citation2020; Sherpa et al., Citation2020; Thakur et al., Citation2020; Tiwari et al., Citation2020; V. S. K. Vanama et al., Citation2020; V. Vanama et al., Citation2020, Citation2021; V. S. K. Vanama et al., Citation2021). The cyclone morphology (Li et al., Citation2013), as well as cyclone boundary layer rolls (L. L. Huang et al., Citation2018), can also be detected using temporal SAR images for real-time monitoring, damage assessment, and predictions (Roy et al., Citation2010; C. S. Bahinipati, Citation2014). The combined use of satellite images, hydraulic models, and crowdsourcing data is explored and demonstrated on Hurricane Harvey that occurred in Houston, TX (Scotti et al., Citation2020). Further, a RAdar-Produced Inundation Diary (RAPID), an automatic near real-time system, is implemented to analyze Hurricane Dorian that occurred in 2019 (Cerrai et al., Citation2020). The utility of C-band Radarsat-1 SAR images is investigated to identify the flooded coastal Louisiana regions due to Hurricane Lili that occurred in October 2002 (Kiage et al., Citation2005). The use of temporal SAR images with the application of the Bayesian framework to detect flooding over multiple land uses is demonstrated over the Hurricane Matthew that occurred in 2016 (Lin et al., Citation2019). Typhoon Habigis, a category 5 typhoon that caused severe damage in 2019 was analysed to produce flood proxy map and damage proxy map using Earth Observation (EO) images (Tay et al., Citation2020). Interferometric SAR (InSAR) techniques were also utilized for efficient flood mapping (Zhang et al., Citation2018).
Several studies also highlighted the application of co-polarized VV/HH SAR images over cross-polarized VH/HV images for efficient flood information extraction when dual-polarized dataset, i.e. (VV, VH) or (HH, HV) is available (Hostache et al., Citation2018; Pelich et al., Citation2020). The co-pol images are preferred over cross-pol images because they are less noisy, and variation in σ° values is comparatively high for various land features (Brisco et al., Citation2013; Manjusree, Kumar et al., Citation2012; White et al., Citation2014). The flood mapping approaches are broadly categorized into three types, viz. manual (Kundu et al., Citation2015), semi-automatic, and automatic, which will be implemented on the SAR images either at the global or local level. These approaches use various thresholding algorithms such as Otsu (Citation1979), Tsai (Citation1995), Kapur et al. (Citation1985), Kittler &and Illingworth (Citation1986), and active contour methods (Mason et al., Citation2007; Matgen et al., Citation2007).
However, most of the flood mapping methods mentioned above are implemented on a smaller subset of 5–50 km2 for the flooded region in a local computer. Each SAR image pre-processing step and algorithm implementation requires substantial computational resources. Thus, it will take a lot of time in a local Personal Computer (PC), ranging from hours to days, to identify the flood area. If the flood event spans over a larger spatial extent, then it is further complicated to analyze the images and will be highly challenging to implement on a local PC. In the case of Sentinel-1 images, each image occupies a volume of 2 GB storage space acquired in Ground Range Detected (GRD) mode and 4 GB storage space acquired in Single Look Complex (SLC) mode. Subsequently, flood information dissemination of the entire flood-affected region is quite difficult with a local PC. Therefore, there is an immense need to look at the pertinence of these flood mapping methods in a cloud platform that empowers real-time flood management.
In continuation to the spatial mapping of flood extent, flood depth identification plays a significant role in flood disaster management. Various studies have used the Digital Elevation Model (DEM) as an input parameter for identifying the flood depth through either hydrological modeling (Bermúdez & Zischg, Citation2018; Haile & Rientjes, Citation2005; Leandro et al., Citation2016) or through remote sensing approach (Hassan et al., Citation2020; Scorzini et al., Citation2018) or a combined approach by assimilating remote sensing derived outputs into hydrological models (Dasgupta, Dasgupta et al., Citation2019; Dasgupta, Hostache et al., Citation2020; Dasgupta, Thakur et al., Citation2020; Walker et al., Citation2019). Very few input parameters like flood extent in vector file format and DEM are required for the remote sensing approach. Few tools such as Flood water Depth Estimation (FwDET), RAPid GIS tool for Inundation Depth Estimation (RAPIDE) (Scorzini et al., Citation2018), and Surface Water Analysis Method (SWAM) are available for flood depth estimation. Subsequently, after flood extent and depth identification, the flood hot spot zonation helps in disaster rescue and relief activities. Multiple methods such as Moran’s I spatial method (Tewara et al., Citation2018), rate maps, and GI* algorithm (Ord & Getis, Citation1995) involving the spatial identification of hot spot clusters are explored (Hassan et al., Citation2020; Karlström & Ceccato, Citation2000; Kowe et al., Citation2020; Wang et al., Citation2013).
The present state-of-art technologies like Water Suite, an in-house software developed by the German Aerospace Center, operate in near real-time for flood information dissemination. A comparative study highlighting the applicability of Water Suite over multiple test sites is demonstrated using TanDEM-X SAR images (Martinis et al., Citation2015). The Water Suite platform is not available for the end-users. In addition, the HASARD tool available on the European Space Agency (ESA) Grid Processing on Demand (GPOD) cloud platform generates flood maps (spatial extent) in near real-time. The HASARD tool is only available based on the acceptance of user’s request to ESA, and the users cannot modify the HASARD tool. Google Earth Engine (GEE) is one of the recent cloud platforms that gained high popularity but limited to the availability of GRD SAR images and limited time allotment to the users for each processing cycle. Therefore, there is a tremendous need to formulate a flood mapping framework on a cloud platform that is easily accessible from anywhere for the end-users and can handle a multitude of satellite images.
The present study utilizes the ESA Research and Service Support (RSS) CloudToolbox (hereafter CloudToolbox) platform to monitor the spatio-temporal dynamics of a flood event. The ESA RSS offers access to multi-mission datasets that are physically stored on in-house data storage facilities. The CloudToolbox can access these datasets directly from the data hubs, thus saving time and resources, and it also runs on parallel processing architecture that speeds up the data processing time. The CloudToolbox is available with pre-installed software, viz. Sentinel Application Platform (SNAP), PolSARpro, Python, and QGIS that helps in image analysis and thematic map production. A collective flood monitoring framework is formulated to rapidly assess cyclone-induced flood event by utilizing the multi-temporal EO images in the CloudToolbox platform. The outputs of the framework are spatio-temporal maps of flood extent, depth, and hot spot zones. This framework is user-friendly, requires very minimal computational facilities at the end-users side, is accessed from anywhere at any time, is powerful in handling massive data and processing, is universally usable, and is scalable to varying geographical extents. The framework uses an automatic Kittler and Illingworth thresholding algorithm for rapid flood mapping. The recently available open-source tool FwDET (Cohen et al., Citation2019), which gained popularity for flood depth estimation, is used in this framework. As the source of the FwDET tool (Cohen et al., Citation2018; Peter et al., Citation2020) is available in the Python language, it is directly implemented on the CloudToolbox. Subsequently, flood hot spot zones are identified with the help of flood extent maps with the most widely used GI* algorithm. This flood mapping framework is tested on an Amphan cyclone-induced flood that occurred in May 2020 at various parts of West Bengal state. Various EO datasets, viz. optical, C-band SAR, Global Precipitation Measurement (GPM) Integrated Multi-satellitE Retrievals (IMERG), and Advanced Land Observing Satellite (ALOS) DEM are used to analyze this devastating cyclone-induced flood event.
The manuscript is systematically arranged as follows: study area and datasets used for analyzing the cyclone event are described in the following section. Subsequently, the methodology of the flood mapping framework is given in the successive section, followed by the results and discussion section. The findings and the recommendations are summarized in the conclusion section.
Study area and datasets
Study area
The geographical region of this study comprises 12 districts of West Bengal state, India, which are heavily affected by the Amphan cyclone in 2020 are considered. The study area lies between 86.560° to 89.096° E longitudes and 21.539° to 24.855° N latitudes, as shown in .
Figure 1. Study area showing the flood-affected districts of West Bengal state
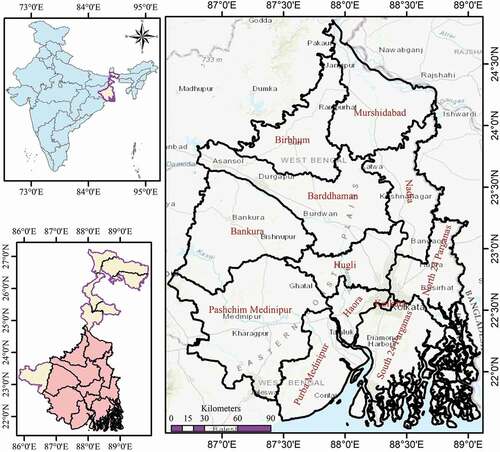
The total spatial extent of the study region is 57,396.51 km2, and it shares an international border with Bangladesh country to its east. A portion of Sundarban mangrove forests lies within the study area boundary. The elevation values of the land surface in the study area vary from 0 to 400 m, wherein high elevated regions are located in western parts of the study area. The southern part of the study area average elevation is 5.8 m above the mean sea level. Many rivers in the study area are originated from the Himalayas or Chhota Nagpur plateau and flowing towards low elevated southern or south-east parts of the study area. Due to flat topography and propinquity to the Bay of Bengal, the study area is intersected by creeks, estuaries, and many rivers. These rivers are a livelihood to many people in this region and contribute to the economy and environmental development. The Land Use Land Cover (LULC) of the study area is characterized by heterogeneous land uses and dominated by non-urban areas such as vegetated areas, wetlands, and open spaces. Kolkatta city, one of India’s metropolitan cities, is also a part of the study area, having a population of 4.49 million in 2011 as per the census of India, and it is expected to be having 5.4 million by 2020. The southern parts of the study region are frequently exposed to monsoon floods, mainly due to storm surge and heavy rainfall. The West Bengal state has also faced 12 deadly tropical cyclones in the last 23 years, from 1997 to 2019, which caused enormous socio-economic damages and human fatalities. Among these 12 cyclones, the highest wind speed, 215 km/h, was recorded for the Sidr cyclone in 2007 and the Fani cyclone in 2019. The Fani cyclone is considered an extremely severe cyclonic storm that killed over 40 people and destroyed the communication systems (Kumar et al., Citation2020).
Subsequently, the study area was hit again by a super cyclone Amphan especially in the Lower Deltaic districts of West Bengal, during May 2020 (Mishra & Vanganuru, Citation2020), which is analyzed in this study. A low-pressure area was developed on 13 May 2020 over the south-eastern Bay of Bengal near Vishakhapatnam, Andhra Pradesh, India, and gradually formed into a depression in the next 2 days. Further, the depression was strengthened, leading to a catastrophic tropical cyclone named Amphan that propelled northwards. On 17 May 2020, the cyclone experienced rapid intensification, which makes it an extremely severe cyclonic storm (Category 4 hurricane). By 18 May 2020, the Amphan cyclone reached its peak intensity with wind speed exceeding 240 km/h and termed as a super cyclone. The north–eastwards moving extremely severe cyclonic storm “AMPHAN”, with a wind speed of 155–165 km/h gusting to 185 km/h, crossed West Bengal–Bangladesh coasts between Digha (West Bengal, India) and Hatiya (Bangladesh) near Sundarbans between 15:30, 17:30 h IST (India Standard Time) of 20 May 2020 (Das et al., Citation2020; Sarkar, Citation2021). The occurrence of such cyclones happens to be one in a 100-year event. The cyclone weakened due to wind shear and dry air by 20 May 2020 and made a landfall resulting in colossal infrastructure damage. The intensity of the damage was huge due to the combined effect of heavy rainfall, storm surge, and strong winds. Various estimates show that the Amphan cyclone killed around 72 people in the West Bengal state and washed away livestock, villages, and fisheries. The state government evacuated nearly five lakh people, and the total loss was estimated as 1 trillion rupees with a direct impact on 70% of the state population. The natural barrier, i.e. mangrove forests, helped to reduce the flood impacts to some extent. All these facts prove the intensity of the Amphan cyclone damage and the immediate need for flood damage assessment for post-disaster planning activities.
Datasets
To analyze the flood event, multi-temporal satellite images are acquired from Sentinel-1 and Sentinel-2 missions, and their characteristics are given in . The Sentinel-1 SAR images acquired before, during, and post-cyclone events are used to analyze the flood event. The spatio-temporal variations of a flood event can be efficiently monitored if the SAR image acquisitions in ascending and descending pass directions are obtained on the same day (V. Vanama et al., Citation2021). The shadow regions of the SAR image in ascending direction may be visible in descending directions and vice versa. The shadow regions mostly appear in high-rise built-up regions. However, for the Amphan cyclone event, the SAR image acquisitions in ascending and descending pass directions happened on different days, which enabled the monitoring of temporal dynamics of the cyclone event. The Sentinel-2 optical image acquired before the cyclone-induced flood event with low cloud cover is used for Permanent Water Body (PWB) mapping. Apart from these datasets, the topographic information is also obtained from the ALOS DEM, having a pixel size of 12.5 m × 12.5 m. The Sentinel mission datasets are fetched into the CloudToolbox directly from ESA Copernicus Open Access Hub, and the ALOS DEM is accessed through Alaska Satellite Facility (ASF).
Table 1. Earth Observation images used to analyze the Amphan cyclone event
Methodology
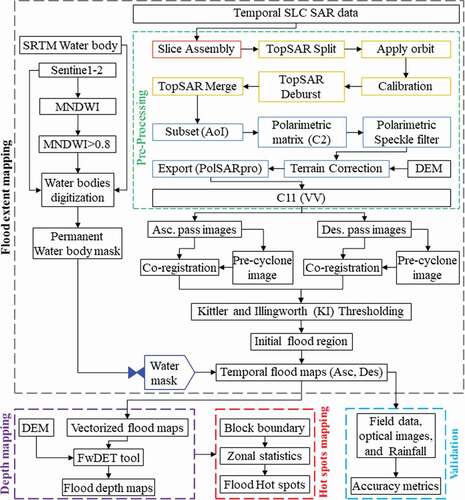
The entire process, i.e. from data downloading to results generation, is carried out on CloudToolbox in an integrated approach as it operates on parallel processing architecture. The methodology implemented in this study is shown in , which has four modules, viz. flood extent mapping, flood depth mapping, hot spots mapping, and validation.
Figure 2. Methodology showing the flood mapping framework
As this framework is scalable at varying geographical extents, it is tested to analyze the large-scale Amphan cyclone-induced flood event. At regional-level analysis, 12 flood-affected districts of West Bengal are considered. For local-level analysis, the most flood-affected Purba Medinipur district is considered. In regional-level analysis, the SAR image size is large, and the histogram gets smoothen compared to local-level analysis. Also, the proportion of the water covered pixels at the regional level is much lesser than the local-level analysis. Thus, the threshold values for regional and local-level analysis will change slightly due to varying geographical extents.
The CloudToolbox service granted to us by the ESA is with a configuration of eight CPUs, 20 GB of RAM, and 1 TB of storage space. The CloudToolbox can be operated from anywhere remotely with very minimal resources from the user’s end. The end-users can create an executable script file for the entire flood management framework. Once the executable file is started, the end-users can log out of the CloudToolbox platform, and when the process has been completed, the connection to the CloudToolbox platform will be automatically stopped after 30 min. Later on, the users can also transfer the results to their local PC as per their requirements.
Flood extent mapping
The satellite images available to analyze the cyclone event are downloaded automatically through a batch download python script. The study area is covered over four Sentinel-1 SAR scenes covering in two orbits. The Level-1 Single Look Complex (SLC) SAR images acquired in Interferometric Wide (IW) swath mode with dual-polarization (VV, VH) bands are used. The SAR images acquired on each date are preprocessed using an XML file executed on the SNAP command-line utility that is available with CloudToolbox. An XML file is created with all the required pre-processing Graph Processing Framework (GPF) operators. Several GPF operators are used to preprocess the images; firstly, the images acquired on the same orbit are assembled using the “SliceAssembly” GPF operator with both polarizations. Following this, the “TopSAR-Split” GPF operator is used to split all the sub-swaths (IW1, IW2, IW3) with a required number of bursts for each sub-swath. Next, the “Apply-Orbit-file” GPF operator is used to correct the orbital state vectors. Subsequently, radiometric calibration is performed using the “Calibration” operator to obtain the radar backscatter coefficient σ° images. Later, the “TOPSAR-Deburst” and “TOPSAR-Merge” operators are used to generate the single merged σ° image from the same orbit. Thus, the image obtained is clipped to the required study area extent using the “Subset” operator. The polarimetric covariance matrix C2 is generated using the “Polarimetric-Matrices” operator. The inherent speckle noise in the SAR images is removed by the “Polarimetric-Speckle-Filter” operator in which the Lee Sigma filter with a 7 × 7 window size is used. The speckle filtered images are geometrically corrected using the “Terrain-Correction” operator in which Shuttle Radar Topography Mission (SRTM) 1 Sec DEM is used as an input, and the pixel size is chosen as 10 m x 10 m. By the end of pre-processing, VV, VH images are generated for each image acquisition data. However, co-polarized (VV) images are used in the study rather than cross-polarized (VH) images. This is due to VH images inherit a large noise component. Moreover, for flood mapping studies, the VV images are preferred due to their ability to distinguish water-covered regions efficiently. Cross‐polarized images (VH/HV) tend to yield a wide range of radar backscatter values σ° from vegetated, semi-urban areas in comparison to co-polarized (VV/HH) images, leading to the potential imbrication of low σ° values, provoking flood misclassification (Manjusree, Prasanna Kumar et al., Citation2012; Twele et al., Citation2016).
The constellation of Sentinel-1 satellites acquire SAR images for every 3 days in an alternating ascending and descending pass orbits from 16 May 2020 to 3 June 2020. The images acquired before 18 May 2020, from 18 May 2020 to 28 May 2020, and after 28 May 2020 are categorized as pre-cyclone, during-cyclone, and after-cyclone images. The image acquired on 1 April 2020 is considered as master image, which is used to co-register all the images acquired in ascending pass direction, to ensure proper pixel-to-pixel registration. Similarly, the image acquired on 4 April 2020 is used to co-register all the images acquired in descending pass direction. The Kittler and Illingworth (KI) automatic thresholding algorithm is implemented on the temporal SAR images to obtain the optimum threshold value. The detailed explanation is presented in Section 4.1. The criterion function to be minimized for identifying the optimum threshold is given in EquationEquation 1(1)
(1) .
where and
are class fraction of flood and non-flood classes, respectively;
and
are the standard deviation of flood and non-flood classes, respectively; and T is the SAR σ° value. The KI algorithm, a minimum error thresholding method, approximates the input SAR image histogram as a bimodal Gaussian distribution and identifies the cut-off value. The cut-off is the optimum threshold value for flood mapping. An optimum threshold value is identified for each image, and the pixel values less than the threshold value are considered as flooded. Here, the flood layers obtained are termed as the initial flood layers, which requires further refinement.
Permanent water body creation
In flood area identification, the inclusion of PWB leads to an overestimation of the flood area. Therefore, the PWB should be masked out from the flooded regions. A hybrid semi-automatic approach utilizing optical EO images is used to generate the PWB mask. Initially, the low cloud cover Sentinel-2 optical image acquired on 9 May 2020 is chosen as shown in and pre-processed through the standard procedure to obtain the reflectance. Subsequently, using the reflectance images, the Modified Normalized Difference Water Index (MNDWI) is formed. Later, the optical-based waterbody mask is generated by classifying MNDWI pixel values greater than 0.8, ensuring major waterbodies are detected. In addition, this waterbody mask is updated with SRTM Waterbody Data (SWBD) layer and manual digitization to obtain the PWB mask. The SWBD is accessed from the publicly available Data Pool, a portion of the National Aeronautics and Space Administration (NASA) Land Processes Distributed Active Archive Center (NASA JPL, Citation2013). The manual digitization makes sure even the narrow river channels are also included in the PWB mask. Lastly, from the initial spatio-temporal flood layers, the waterbodies are masked out using the PWB mask to generate the final flood layers, which will be used in the flood depth mapping.
Figure 3. Temporal histograms corresponding to (a)–(f) of radar backscattering σ°vv before and after speckle filtering for the images acquired on 19 May 2020, 22 May 2020, 25 May 2020, 28 May 2020, 31 May 2020 and 3 June 2020 for study area extent
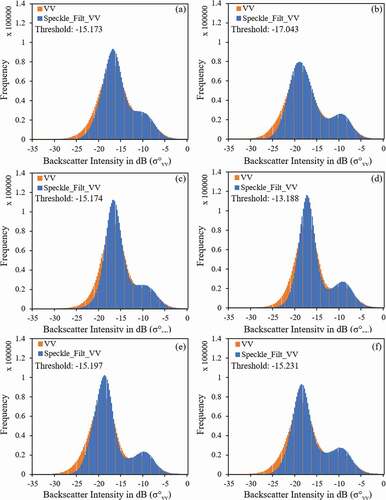
Figure 4. Temporal flood maps of study area extent for the images acquired on 16 May 2020, 19 May 2020, 22 May 2020, 25 May 2020, 28 May 2020, 31 May 2020 and 3 June 2020 corresponding to sub-figures (c)–(i). Sub-figures (a) and (b) show the SAR image acquired on 01 April and 4 April 2020
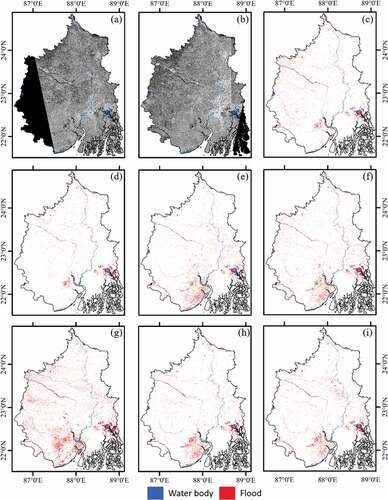
Figure 5. District wise quantitative estimation of temporal flood area
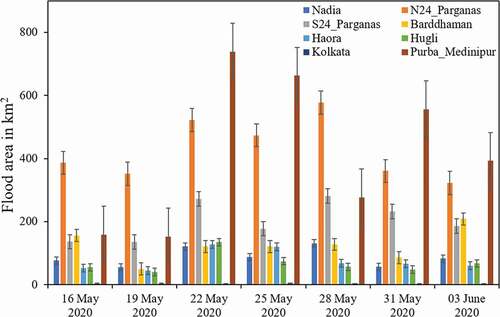
Figure 6. Temporal histograms of radar backscattering σ°vv before and after speckle filtering for the images acquired on 19 May 2020, 22 May 2020, 25 May 2020, 28 May 2020, 31 May 2020 and 3 June 2020 corresponding to (a)–(f) for Purba Medinipur district
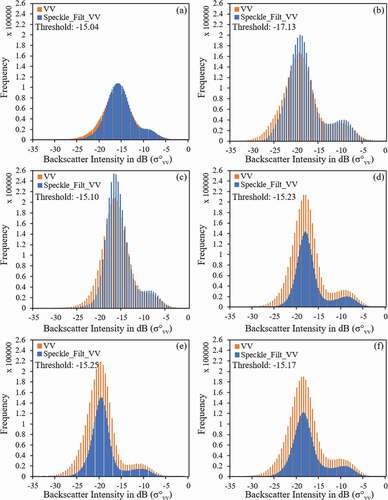
Figure 7. Temporal flood maps of Purba Medinipur district for the images acquired on 16 May 2020, 19 May 2020, 22 May 2020, 25 May 2020, 28 May 2020, 31 May 2020 and 3 June 2020 corresponding to sub-figures (c)–(i). The sub-figures (a), (b) shows the SAR image acquired on 01 April and 4 April 2020
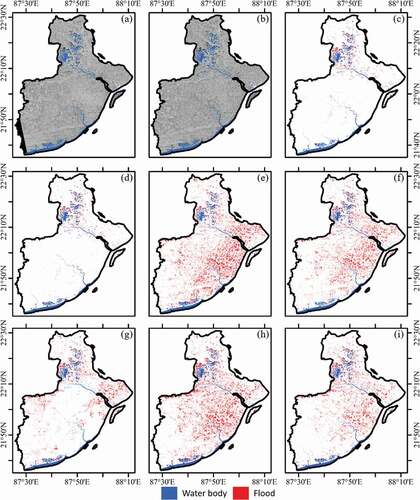
Figure 8. Spatio-temporal flood depth maps of Purba Medinipur district for the images acquired on 16 May 2020, 19 May 2020, 22 May 2020, 25 May 2020, 28 May 2020, 31 May 2020 and 3 June 2020 corresponding to sub-figures (a)–(g). Sub-figure (h) shows the ALOS PALSAR DEM
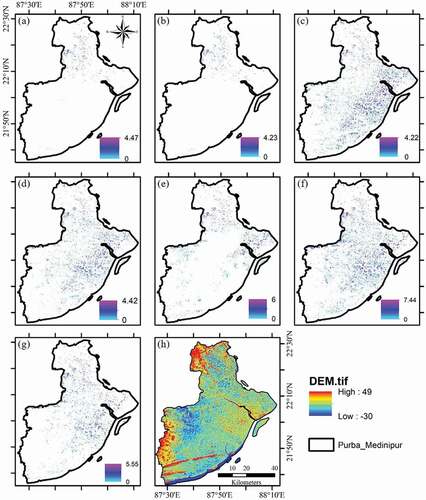
Figure 9. Spatio-temporal flood hot spots of Purba Medinipur on 16 May 2020, 19 May 2020, 22 May 2020, 25 May 2020, 28 May 2020, 31 May 2020 and 3 June 2020 corresponding to sub-figures (b)–(i). Sub-figure (a) represents the village boundaries
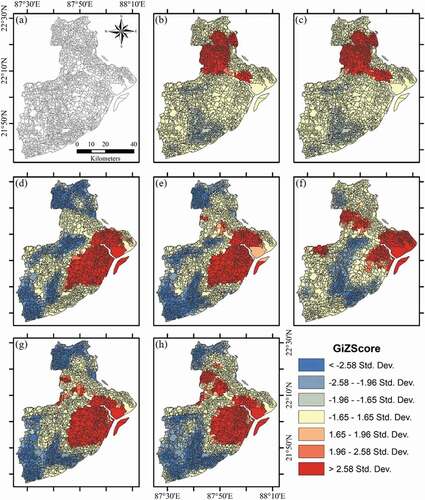
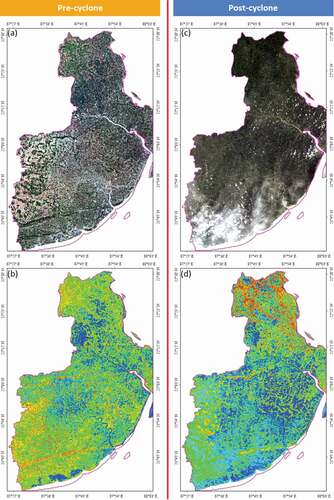
Figure 10. Sentinel-2 optical images acquired before (9 May 2020) and after (29 May 2020) the cyclone. Sub-figures (a) and (b) are the true colour composites and (b), (d) are the MNDWI thematic indices
Flood depth mapping
The flood depth is estimated from the FwDET algorithm created by Cohen et al. (Citation2019). The FwDET algorithm requires only two input parameters, i.e. flood area shapefile and DEM. The flood layers generated from module one (flood extent mapping as explained in first module of the Methodology section) are converted into shapefiles. The ALOS PALSAR DEM available from the JAXA website with a pixel size of 12.5 × 12.5 m is used in the FwDET algorithm. The flowchart of the FwDET consists of five steps, viz.
Boundary cell identification by converting the flood polygon layer to polyline layer.
Boundary cell elevation extraction from DEM.
Assigning the domain cell elevation using focal statistics.
Flood depth estimation through map algebraic expression
Smoothing the flood depth with 3 × 3 kernels.
After the implementation of this FwDET tool, spatio-temporal flood depth maps are generated. The flood depths vary spatially with time as the flood water retreats to the low elevated regions.
Hot spots mapping
In order to carry out disaster relief, response, and rescue operations, prioritization of cyclone-affected areas plays a crucial role. Therefore, Getis-Ord Gi* algorithm is used to identify the village level hot spot zones. The village-level administrative boundaries are overlaid on the flood layers, and the flood area attributes are extracted for each village. The Gi* statistic for each village is estimated from EquationEq. 2.(2)
.(2) , wherein the mean (
) and S are calculated from EquationEqs 3 and
(3)
(3) Equation4
(4)
(4) with the help of the flood area attribute.
The spatial weights (wi, j) for each village are taken from the flood depth layer to model spatial relationships. The spatial weight layer for each village in the district is based on its exposure to the flood depth, i.e. high flood depth will have more spatial weight and vice versa. In this method, each village is evaluated within the context of the surrounding villages. The neighbouring villages that are spatially located within critical distances receive the assigned spatial weights and wield influence on Gi* calculations for neighbouring villages. Also, neighbouring villages spatially located beyond the critical distance receive a zero spatial weight and do not have any implications on target village Gi* calculations. The Gi* statistic analyzes the villages where there is statistically significant spatial clustering of higher magnitudes of flood independent of the number of villages in the district. The Gi* statistic displays the z-scores and p-values, which are standard deviations and statistical probabilities indicating if the villages are statically clustered. The larger z-scores represent a high occurrence of hot spot spatial clusters, which translates to prioritizing severely flood-affected villages that require disaster rescue and relief operations. Similarly, the low z-scores represent a low occurrence of hot spot spatial clusters indicating a low risk of flood severity on a given time period. The z-scores near to zero mean no apparent spatial clustering of flood-affected villages.
Validation approach
The flood maps obtained from module 1 are validated using the following accuracy metrics in the CloudToolbox platform. The computation of these metrics completely depends on the availability of the ground truth data and can be performed at a regional/local level.
True Positive (TP): Flooded pixels in the validation data that are detected as flooded by the KI algorithm.
True Negative (TN): Non-flooded pixels in the validation data that are detected as non-flooded by the KI algorithm.
False Positive (FP): Non-flooded pixels in the validation data that are detected as flooded by the KI algorithm.
False Negative (FN): Flooded pixels in the validation data that are detected as non-flooded by the KI algorithm.
Sensitivity: It is the fraction of actual flood pixels on the ground that are correctly detected as such and it is computed as TP/(TP+FN).
Precision: It is the fraction of flood pixels identified by the algorithm that are actually flooded, which is computed as TP/(TP+FP).
F1 score: It indicates the algorithm performance for flood class pixels alone and is computed as harmonic mean of sensitivity and precision. The high F1 score represents the higher accuracy. The F1 score is computed as 2*{(sensitivity × precision)/(sensitivity + precision)}
Overall Accuracy (OA): It is the probability that the pixels are correctly classified compared with the validation data, i.e. the sum of true positives and true negatives divided by the total number of tests as given in EquationEq. 5
(5)
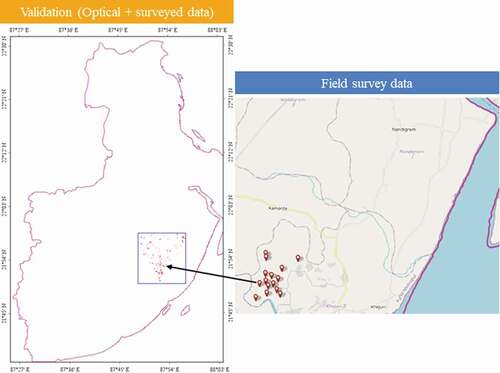
The Amphan cyclone created catastrophic destruction over a larger spatial region covering several West Bengal state districts. Therefore, collecting the field data for the entire cyclone-affected region is highly challenging and resource-consuming. Hence, the validation is confined to the small portions, where the datasets (field photographs and optical remote sensing imagery derived flooded areas) are available. In addition, the GPM IMERG rainfall is used for validating the satellite-derived flood maps at a local level.
Results
The results are grouped into five parts. The first part describes the flood area mapping, while the second part deals with flood depth mapping. The third and fourth parts describe the hot spot location identification and validation, respectively. The fifth part presents the discussions on the use of CloudToolbox and flood mapping accuracy.
Flood extent mapping
To understand the temporal dynamics of the cyclone-induced flood, multi-temporal EO images are used and analyzed at various administrative boundary levels, i.e. regional and local levels. As mentioned in Study area section, the 12 districts of West Bengal state are considered for regional-level analysis. In the disaster management plan as given in NDMA, it is given that district-level damage assessment helps the proper resource allocation at a local level (NDMA, Citation2008). Subsequently, the heavily cyclone-affected district is considered for district-level analysis. The same procedure can be adopted for any other cyclone-affected district. This spatio-temporal flood extent mapping is divided into two parts, i.e. regional-level and local-level mapping, as explained below.
Regional level mapping
The potential for the combined use of both ascending and descending pass Sentinel-1 SAR images acquired from 16 May 2020 to 3 June 2020 is explored for cyclone monitoring, whereas the images acquired on 1 April 2020 and 4 April 2020 are used for the co-registration purpose. All the temporal EO images are spatially subset to the regional-level boundary. To extract the flood area from the temporal SAR images, an optimal threshold is required. The KI algorithm, a histogram shape-based method described in , in the first module of the Methodology section is used to obtain the optimum threshold value. The KI algorithm considers histogram follows a bimodal Gaussian distribution and finds the optimal threshold value. The histograms of temporal SAR images are given in in which the radar backscatter values before and after the speckle filtering are plotted. All the histograms in , exhibit bimodal distribution with different skewness and central peak values at various radar backscatter σ0 values. At the beginning of the cyclone, the rainfall and cyclone intensity is low, so the land surface condition is not wet. Therefore, the majority of the radar backscatter σ0 values are concentrated in the higher range, i.e. −18 to −10 dB. As the cyclone’s intensity increased along with heavy rainfall, the frequency of lower σ0 values increased, indicating the increased flood area. As the floodwater starts receding from 3 June 2020, the land surface started regaining its normal condition, and the σ0 values moved towards the right of the histogram. After implementing the KI algorithm, the threshold values obtained for each SAR images acquired on 19 May 2020, 22 May 2020, 25 May 2020, 28 May 2020, 31 May 2020 and 3 June 2020 are −15.173, −17.043, −15.174, −13.188, −15.197, −15.231 dB, respectively. The pixel values that are less than the optimal threshold values are considered as flooded. Morphological operators such as clump and sieve are applied to the flood area to ensure that they are connected pixels. The spatial-temporal flood maps generated for the regional level are shown in . The permanent waterbodies are masked out using a PWB mask to reduce the overestimation. From , it is inferred that the southern part of the study area region is heavily flooded. A quantitative analysis of flood area for each district in the study area boundary region is carried out along with the spatial mapping of flooded regions. The district-wise flood area for each SAR image acquisition is shown in . From , it is observed that three districts, viz. Purba Medinipur, South 24 Parganas, and North 24 Parganas are heavily flooded. The Purba Medinipur is situated at a lower elevation, and many rivers are draining through it; thus, it is heavily affected by the cyclone. In regional-level analysis, only module 1 of the framework is implemented. This is mainly due to the lack of ground truth data for such a larger spatial extent (12 districts of West Bengal). However, the other three modules of the framework are perfectly suitable and can be implementable at this level. The purpose of this analysis is to understand the overall dynamics of the cyclone at a regional level, from which a small portion is selected to test the flood framework’s usability. For further understanding, the Purba Medinipur district is analyzed separately and given in below. Apart from flooding, due to heavy winds during the cyclone, there is huge damage to infrastructure in many districts.
Local-level mapping
For local-level analysis, all the temporal SAR images are spatially subset to respective district boundary, i.e. Purba Medinipur. Apart from the fact that the selected district is heavily flooded, the low cloud cover Sentinel-2 optical image and little field surveyed data are available that helps in the validation approach. Therefore, for local-level analysis, all modules of the framework are implemented for the Purba Medinipur district. The optimum threshold identification and flood mapping procedure are similar to the regional-level mapping. represents the temporal histograms, and shows the spatio-temporal flood maps for the Purba Medinipur district. The temporal histograms of Purba Medinipur exhibit bimodal distribution on all the acquisition dates. From the beginning of the cyclone retreat, σ0 values are shifted from higher to lower backscatter intensity value ranges. The KI algorithm is able to find the optimum threshold value segregating the flooded region from non-flooded regions. The optimum threshold value for most of the image acquisitions lies around −15 dB, and the exact threshold value for each image is given in . The flood area obtained from the Purba Medinipur district is converted to vector format, which will be used as an input for flood depth mapping.
Flood depth mapping
The flood depth information is very critical to the disaster management authorities in optimizing the rescue and relief operations during crisis times. To obtain the flood depth, the ALOS PALSAR DEM scenes covering the Purba Medinipur district available from JAXA are downloaded and mosaiced to get a single DEM image. Subsequently, the DEM is clipped to the district administrative boundary. The two input layers, viz. the flood area vector layer and DEM raster files, are fed to the FwDET model to obtain the flood depth. This step is repeated for each image to understand the temporal dynamics of the cyclone-induced flood event. shows the temporal variation of flood depth from 16 May 2020 to 3 June 2020 for the Purba Medinipur district. Sub-figure (h) in represents the DEM used in the FwDET model. The south-eastern regions of Purba Medinipur, where the rivers are draining through, have a maximum variation of flood depth and are prone to serious possible damages. The overall flood water depth varies from 0 to 7.4 m from 16 May 2020 to 3 June 2020. With the receding floodwater by 3 June 2020, the flood water depth is minimal. Subsequently, after spatial identification of flood-affected regions, the hot spots zonation, i.e. villages that require an utmost response, needed to be recognized as described in Sec. 4.3.
Hot spots mapping
As per the framework described in Methodology section, the village boundaries are overlaid on flood extent and flood depth layers. Using zonal statistics tools, the required attributes are extracted for each village. The flood depth attribute values are normalized with the min-max normalization method so that the weights will lie between 0 and 1. After implementing the Gi* algorithm, hot spots are identified, as shown in . The villages clustered with more than 2.58 GiZscore are considered hot spot zones and require district municipal authorities’ attention for optimal resource allocation. From the sub-figures of , it is inferred that the south-eastern parts are heavily affected by the cyclone.
Validation
For validation purposes, the Sentinel-2 optical imagery available during the cyclone event (29 May 2020) with the nearest possible SAR image acquisition time (28 May 2020) is used, as shown in .
The MNDWI index is generated for the Sentinel-2 image acquired on 29 May 2020. The field data collected during the survey are superimposed on the MNDWI index. From , it is observed that in the true colour composite there is a presence of little cloud cover. The high MNDWI values represent the presence of water content/flooded area, which is shown in blue colour shades in ), (d). By taking this into account, and careful interpretation of index values along with surveyed data, a ground truth flood layer is digitized within the bounds of surveyed data. The total number of pixels considered for validation is 2,329,880 which covers an area of 232.988 km2 which is approximately 16.54% of the Purba Medinipur district area. The validation , is created as described in validation approach of Methodology section for the spatial extent of the ground truth flood layer as shown in . Subsequently, the accuracy metrics are also derived from the validation matrix. The sensitivity, precision, and F1 score, and OA indices are obtained as 0.9889, 0.9872, 0.9880, and 0.9764, respectively, which indicate a significant acceptable accuracy.
Figure 11. Validation data generated from Sentinel-2 optical image acquired on 29 May 2020 and the field survey data
Discussions
The CloudToolbox service parallel processing architecture reinforced efficient data handling and processing of multi-temporal EO images. This online cloud platform is an efficient tool for rapid processing and information dissemination to end-users. The data processing chain corroborated in this cloud platform is user-friendly, simple, effective, and can be scalable.
The entire framework on temporal dynamics monitoring of Amphan cyclone is carried out on CloudToolbox in less than 1 h. This long duration for generating the results is attributed to the spatial coverage of regional-level boundaries in four SAR images for both ascending and descending passes. In descending pass direction out of four images, three images are from a single orbit covering almost the entire regional-level boundary except for few portions of North 24 Parganas for which another image from a different orbit is used (refer ). In ascending pass direction, three SAR images from one orbit and one SAR image from another orbit cover the regional-level boundary, as shown in is used. For district-level analysis, two images cover all three districts in both ascending and descending pass directions. Therefore, the quantitative estimations of cyclone-induced flood area at a regional-level boundary might be slightly underestimated as it depends on spatial coverage of the SAR image. Apart from this, the cyclone has occurred with very high wind intensities that caused enormous damage to infrastructure in the West Bengal state. As the SAR backscatter is also a function of object parameters on the earth surface, the changes that occurred due to the cyclone can alter the signal return. Hence, there is a possibility that the damaged built-up region can also be termed as flooded.
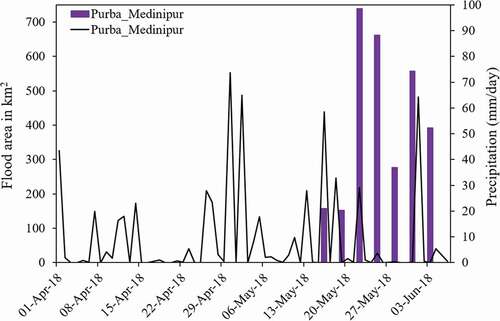
It is undoubtedly evident that the synergetic use of ascending and descending pass SAR images conferred an efficient and effective way of monitoring the spatio-temporal dynamic of Amphan cyclone. The exploitation of multiple imageries for PWB mask creation resulted in a highly accurate PWB mask; consequently, the overdetection of flood area is controlled. The KI thresholding algorithm also worked well in this particular case due to the bimodal histograms of SAR images acquired during the cyclone. However, in the case of highly urbanized districts like Kolkatta, the radar backscatter σ0 values are high (−6 to −2 dB) due to the high built-up density. At the time of cyclone, the σ0 values may further increase. Therefore, the research framework used in this study yield moderate accuracy for high-density urban regions. The FwDET tool implemented in this study is freely available to the users, so the flood depth mapping can be scalable and can be applied to any other flood event. The FwDET tool developers claim that the use of high-resolution DEM will give better results. But due to restrictions of high-resolution LiDAR data, the ALOS PALSAR DEM is used in this study. The FwDET tool was tested on multiple test sites (Cohen et al., Citation2019), viz. August 2011 Hurricane Irene, May 2016 flood event for the Brazos River (Texas), Citation2018 Hurricane Florence, and 2018 flooding in Sri Lanka using various DEMs like HydroSHEDS DEM 3arc, Multi-Error Improved–Terrain (MERIT) DEM, and ALOS DEM. Thus, the tool is extensively verified on multiple type of flood events by the tool developers, the flood depths obtained in this study are reliable given the fact of using high-resolution ALOS DEM. The shift in temporal hot spot zonation can help the disaster management personnel plan to build the relief and rescue camps in safe zones. The studies showed that SAR images have a very high potential for flood detection with exceptional accuracy. The submerged areas at the time of optical and SAR acquisition time may vary, which could be a potential reason for not obtaining exceptional flood mapping accuracy. The GPM IMERG rainfall is also used as a secondary way for validation purposes where the rainfall trend matches the flood area, as shown in . Future studies can explore the utility of validation data collection from social networking sites like Facebook, Twitter tweets, etc., for a larger spatial region.
Figure 12. District level temporal flood area is plotted against the spatially averaged IMERG rainfall for 16 May 2020, 19 May 2020, 22 May 2020, 25 May 2020, 28 May 2020, 31 May 2020, and 3 June 2020
Conclusion
A collective framework is formulated for rapid mapping of cyclone-induced flooded regions by utilizing the multi-temporal EO images in the CloudToolbox platform. This framework includes data accessing from the ESAs Sentinel hub, pre-processing, flood extent, depth mapping, and hot spot zonation. This processing chain adopts the KI algorithms for optimum threshold identification for each SAR image acquisition. The framework is easy to use, automated, and scalable to diversified geographical extents. Hence, this can be used by disaster management authorities, municipal corporations, insurance companies, policymakers, planning authorities, civilians heedless of their familiarity with remote sensing datasets. Many nations worldwide use traditional flood mapping methods to disseminate disaster alerts to the end-user in near real-time. Therefore, this framework can be used for operational real-time monitoring of flood events. The Amphan cyclone-induced flood monitoring is tested with this framework at varying spatial scales, and the results are found to be persuasive. From the results, it is evident that the overall accuracy of 97% is achieved. This framework’s significant advantage is that users can access and execute the process from anywhere with minimal computing facilities and resources. Another major encompassing of this framework is the minimal processing time achieved by parallel processing architecture. It took less than 1 h for the entire data processing to results generation at varying spatial regions.
Aside from Amphan cyclone-induced flood events, the flood mapping framework can be equally implemented to any flood event. However, it is prudent to take into account a few parameters while using this framework: (1) The pre-cyclone SAR image should be acquired on a sunny day with no/minimal cloud cover to ensure low overestimation of flood area; (2) the temporal baseline between the pre- and during-cyclone images should be as minimal as possible, accounting for land-use change dynamics; (3) it is advisable to collect the field data at the SAR image acquisition time if possible, otherwise immediately after the cyclone event; (4) the accuracy in high-density urban areas may not be of a desirable level. The modification of the research framework by adding more input parameters like coherence, phase standard deviation, etc., may enhance the flood mapping accuracy in the urban areas, which can be taken as a future study. Another thrust area is the creation of validation datasets through crowdsourcing technologies. Nevertheless, the CloudToolbox platform showed favourable results in the case of the Amphan cyclone-induced flood event in May 2020. As this flood monitoring framework is universally implementable, it can be a powerful tool in the decision-making process for a disaster management planning system.
Acknowledgments
The authors would like to thank ESA for granting the RSS CloudToolbox and also for providing Sentinel-1 SAR images through Copernicus Open Access Hub. The authors again thank the JAXA for providing the high-resolution ALOS DEM. The first author is thankful to the Ministry of Human Resource Development, Government of India, for providing necessary computational facilities through the project (RD/0114-MHRD0A0-025) funding.
Disclosure statement
The authors reported no potential conflict of interest.
References
- Bahinipati, C. S. (2014). Assessment of vulnerability to cyclones and floods in Odisha, India: A district-level analysis. Current Science, 107, 1997–2007. https://www.currentscience.ac.in/Volumes/107/12/1997.pdf
- Bermúdez, M., & Zischg, A. P. (2018). Sensitivity of flood loss estimates to building representation and flow depth attribution methods in micro-scale flood modelling. Natural Hazards, 92(3), 1633–1648. https://doi.org/https://doi.org/10.1007/s11069-018-3270-7
- Bhatt, C., Gupta, A., Roy, A., Dalal, P., & Chauhan, P. (2021). Geospatial analysis of September, 2019 floods in the lower gangetic plains of Bihar using multi-temporal satellites and river gauge data. Geomatics, Natural Hazards and Risk, 12(1), 84–102. https://doi.org/https://doi.org/10.1080/19475705.2020.1861113
- Brisco, B., Schmitt, A., Murnaghan, K., Kaya, S., & Roth, A. (2013). SAR polarimetric change detection for flooded vegetation. International Journal of Digital Earth, 6(2), 103–114. https://doi.org/https://doi.org/10.1080/17538947.2011.608813
- Cerrai, D., Yang, Q., Shen, X., Koukoula, M., & Anagnostou, E. N. (2020). Brief communication: Hurricane Dorian: Automated near-real-time mapping of the “unprecedented” flooding in the Bahamas using synthetic aperture radar. Natural Hazards and Earth System Sciences, 20(5), 1463–1468. https://doi.org/https://doi.org/10.5194/nhess-20-1463-2020
- Chini, M., Pelich, R., Pulvirenti, L., Pierdicca, N., Hostache, R., & Matgen, P. (2019). Sentinel-1 insar coherence to detect floodwater in urban areas: Houston and hurricane Harvey as a test case. Remote Sensing, 11(2), 107. https://doi.org/https://doi.org/10.3390/rs11020107
- Chung, H.-W., Liu, -C.-C., Cheng, I.-F., Lee, Y.-R., & Shieh, M.-C. (2015). Rapid response to a typhoon-induced flood with an SAR-derived map of inundated areas: Case study and validation. Remote Sensing, 7(9), 11954–11973. https://doi.org/https://doi.org/10.3390/rs70911954
- Cohen, S., Brakenridge, G. R., Kettner, A., Bates, B., Nelson, J., McDonald, R., Huang, Y.-F., Munasinghe, D., & Zhang, J. (2018). Estimating floodwater depths from flood inundation maps and topography. JAWRA Journal of the American Water Resources Association, 54(4), 847–858. https://doi.org/https://doi.org/10.1111/1752-1688.12609
- Cohen, S., Raney, A., Munasinghe, D., Loftis, J. D., Molthan, A., Bell, J., Rogers, L., Galantowicz, J., Brakenridge, G. R., Kettner, A. J., Huang, Y.-F., & Tsang, Y.-P., & others. (2019). The floodwater depth estimation tool (FwDET v2. 0) for improved remote sensing analysis of coastal flooding. Natural Hazards and Earth System Sciences, 19(9), 2053. https://doi.org/https://doi.org/10.5194/nhess-19-2053-2019
- Das, S., Das, A., Kar, N. S., & Bandyopadhyay, S. (2020). Cyclone Amphan and its impact on the lower deltaic West Bengal: A preliminary assessment using remote sensing sources. CURRENT SCIENCE, 119(8), 1246–1249. https://wwwops.currentscience.ac.in/Volumes/119/08/1246.pdf
- Dasgupta, A., Grimaldi, S., Ramsankaran, R., Hostache, R., Schumann, G., Pauwels, V., & Walker, J. (2019). Improving Flood Forecasts using SAR-based Flood Extent Assimilation. Geophysical Research abstracts, 21. https://meetingorganizer.copernicus.org/EGU2019/EGU2019-231.pdf
- Dasgupta, A., Hostache, R., Ramsankaran, R., Schumann, G., Grimaldi, S., Pauwels, V., & Walker, J. (2020). Optimizing SAR-based flood extent assimilation for improved flood inundation forecasts. EGU General Assembly 2020, Online, 4–8 May 2020, EGU2020-4342. https://doi.org/https://doi.org/10.5194/egusphere-egu2020-4342
- Dasgupta, A., Thakur, P. K., & Gupta, P. K. (2020). Potential of SAR-derived flood maps for hydrodynamic model calibration in data scarce regions. Journal of Hydrologic Engineering, 25(9), 05020028. https://doi.org/https://doi.org/10.1061/(ASCE)HE.1943-5584.0001988
- Dewan, A. M., Kankam-Yeboah, K., & NISHIGAKI, M. (2006). Using synthetic aperture radar (SAR) data for mapping river water flooding in an urban landscape: A case study of greater Dhaka, Bangladesh. Journal of Japan Society of Hydrology and Water Resources, 19(1), 44–54. https://doi.org/https://doi.org/10.3178/jjshwr.19.44
- Domeneghetti, A., Schumann, G. J.-P., & Tarpanelli, A. (2019). Preface: Remote sensing for flood mapping and monitoring of flood dynamics. Multidisciplinary Digital Publishing Institute.
- Haile, A. T., & Rientjes, T. (2005). Effects of LiDAR DEM resolution in flood modelling: A model sensitivity study for the city of Tegucigalpa, Honduras. Isprs Wg Iii/3, Iii/4, 3, 12–14. https://www.isprs.org/proceedings/xxxvi/3-W19/papers/168.pdf
- Hassan, M. M., Ash, K., Abedin, J., Paul, B. K., & Southworth, J. (2020). A quantitative framework for analyzing spatial dynamics of flood events: A case study of super cyclone amphan. Remote Sensing, 12(20), 3454. https://doi.org/https://doi.org/10.3390/rs12203454
- Horstmann, J., Falchetti, S., Wackerman, C., Maresca, S., Caruso, M. J., & Graber, H. C. (2015). Tropical cyclone winds retrieved from C-band cross-polarized synthetic aperture radar. IEEE Transactions on Geoscience and Remote Sensing, 53(5), 2887–2898. https://doi.org/https://doi.org/10.1109/TGRS.2014.2366433
- Horstmann, J., Wackerman, C., Falchetti, S., & Maresca, S. (2013). Tropical cyclone winds retrieved from synthetic aperture radar. Oceanography, 26(2), 46–57. https://doi.org/https://doi.org/10.5670/oceanog.2013.30
- Hostache, R., Chini, M., Giustarini, L., Neal, J., Kavetski, D., Wood, M., Corato, G., Pelich, R.-M., & Matgen, P. (2018). Near-real-time assimilation of SAR-derived flood maps for improving flood forecasts. Water Resources Research, 54(8), 5516–5535. https://doi.org/https://doi.org/10.1029/2017WR022205
- Huang, L., Li, X., Liu, B., Zhang, J. A., Shen, D., Zhang, Z., & Yu, W. (2018). Tropical cyclone boundary layer rolls in synthetic aperture radar imagery. Journal of Geophysical Research: Oceans, 123(4), 2981–2996. https://doi.org/https://doi.org/10.1029/2018JC013755
- Huang, X., Tan, H., Zhou, J., Yang, T., Benjamin, A., Wen, S. W., Li, S., Liu, A., Li, X., Fen, S., & Li, X., & others. (2008). Flood hazard in Hunan province of China: An economic loss analysis. Natural Hazards, 47(1), 65–73. https://doi.org/https://doi.org/10.1007/s11069-007-9197-z
- Jacinth Jennifer, J., Saravanan, S., & Abijith, D. (2020). Integration of SAR and multi-spectral imagery in flood inundation mapping–a case study on Kerala floods 2018. ISH Journal of Hydraulic Engineering, 1–11. https://doi.org/https://doi.org/10.1080/09715010.2020.1791265
- JPL, N. A. S. A. (2013). NASA shuttle radar topography mission water body data shapefiles & raster files [Data set]. NASA EOSDIS Land Processes DAAC. https://doi.org/https://doi.org/10.5067/MEASURES/SRTM/SRTMSWBD.003
- Kapur, J. N., Sahoo, P. K., & Wong, A. K. (1985). A new method for gray-level picture thresholding using the entropy of the histogram. Computer Vision, Graphics, and Image Processing, 29(3), 273–285. https://doi.org/https://doi.org/10.1016/0734-189X(85)90125-2
- Karlström, A., & Ceccato, V. (2000). A new information theoretical measure of global and local spatial association. Munich Personal RePEc Archive (MPRA) https://mpra.ub.uni-muenchen.de/6848/1/MPRA_paper_6848.pdf
- Kiage, L. M., Walker, N. D., Balasubramanian, S., Babin, A., & Barras, J. (2005). Applications of radarsat-1 synthetic aperture radar imagery to assess hurricane-related flooding of coastal louisiana. International Journal of Remote Sensing, 26(24), 5359–5380. https://doi.org/https://doi.org/10.1080/01431160500442438
- Kittler, J., & Illingworth, J. (1986). Minimum error thresholding. Pattern Recognition, 19(1), 41–47. https://doi.org/https://doi.org/10.1016/0031-3203(86)90030-0
- Kowe, P., Mutanga, O., Odindi, J., & Dube, T. (2020). A quantitative framework for analysing long term spatial clustering and vegetation fragmentation in an urban landscape using multi-temporal Landsat data. International Journal of Applied Earth Observation and Geoinformation, 88, 102057. https://doi.org/https://doi.org/10.1016/j.jag.2020.102057
- Kumar, S., Lal, P., & Kumar, A. (2020). Turbulence of tropical cyclone ‘Fani’ in the Bay Of Bengal and Indian subcontinent. Natural Hazards, 103(1), 1613–1622. https://doi.org/https://doi.org/10.1007/s11069-020-04033-5
- Kundu, S., Aggarwal, S., Kingma, N., Mondal, A., & Khare, D. (2015). Flood monitoring using microwave remote sensing in a part of Nuna river basin, Odisha, India. Natural Hazards, 76(1), 123–138. https://doi.org/https://doi.org/10.1007/s11069-014-1478-8
- Leandro, J., Schumann, A., & Pfister, A. (2016). A step towards considering the spatial heterogeneity of urban key features in urban hydrology flood modelling. Journal of Hydrology, 535, 356–365. https://doi.org/https://doi.org/10.1016/j.jhydrol.2016.01.060
- Li, X., Zhang, J. A., Yang, X., Pichel, W. G., DeMaria, M., Long, D., & Li, Z. (2013). Tropical cyclone morphology from spaceborne synthetic aperture radar. Bulletin of the American Meteorological Society, 94(2), 215–230. https://doi.org/https://doi.org/10.1175/BAMS-D-11-00211.1
- Lin, Y. N., Yun, S.-H., Bhardwaj, A., & Hill, E. M. (2019). Urban flood detection with sentinel-1 multi-temporal synthetic aperture radar (SAR) observations in a Bayesian framework: A case study for hurricane Matthew. Remote Sensing, 11(15), 1778. https://doi.org/https://doi.org/10.3390/rs11151778
- Manavalan, R. (2018). Review of synthetic aperture radar frequency, polarization, and incidence angle data for mapping the inundated regions. Journal of Applied Remote Sensing, 12(2), 021501. https://doi.org/https://doi.org/10.1117/1.JRS.12.021501
- Manjusree, P., Kumar, L. P., Bhatt, C. M., Rao, G. S., & Bhanumurthy, V. (2012). Optimization of threshold ranges for rapid flood inundation mapping by evaluating backscatter profiles of high incidence angle SAR images. International Journal of Disaster Risk Science, 3(2), 113–122. https://doi.org/https://doi.org/10.1007/s13753-012-0011-5
- Manjusree, P., Prasanna Kumar, L., Bhatt, C. M., Rao, G. S., & Bhanumurthy, V. (2012). Optimization of threshold ranges for rapid flood inundation mapping by evaluating backscatter profiles of high incidence angle SAR images. International Journal of Disaster Risk Science, 3(2), 113–122. https://doi.org/https://doi.org/10.1007/s13753-012-0011-5
- Martinis, S., Kuenzer, C., Wendleder, A., Huth, J., Twele, A., Roth, A., & Dech, S. (2015). Comparing four operational SAR-based water and flood detection approaches. International Journal of Remote Sensing, 36(13), 3519–3543. https://doi.org/https://doi.org/10.1080/01431161.2015.1060647
- Mason, D. C., Horritt, M. S., Dall’Amico, J. T., Scott, T. R., & Bates, P. D. (2007). Improving river flood extent delineation from synthetic aperture radar using airborne laser altimetry. IEEE Transactions on Geoscience and Remote Sensing, 45(12), 3932–3943. https://doi.org/https://doi.org/10.1109/TGRS.2007.901032
- Matgen, P., Hostache, R., Schumann, G., Pfister, L., Hoffmann, L., & Savenije, H. (2011). Towards an automated SAR-based flood monitoring system: Lessons learned from two case studies. Physics and Chemistry of the Earth, Parts A/B/C, 36(7–8), 241–252. https://doi.org/https://doi.org/10.1016/j.pce.2010.12.009
- Matgen, P., Schumann, G., Henry, J.-B., Hoffmann, L., & Pfister, L. (2007). Integration of SAR-derived river inundation areas, high-precision topographic data and a river flow model toward near real-time flood management. International Journal of Applied Earth Observation and Geoinformation, 9(3), 247–263. https://doi.org/https://doi.org/10.1016/j.jag.2006.03.003
- Mishra, A. K., & Vanganuru, N. (2020). Monitoring a tropical super cyclone Amphan over Bay Of Bengal and nearby region in May 2020. Remote Sensing Applications: Society and Environment, 20, 100408. https://doi.org/https://doi.org/10.1016/j.rsase.2020.100408
- NDMA. (2008). National disaster management guidelines—management of floods. Publication of NDMA, Government of India, pp. 1–135. https://ndma.gov.in/sites/default/files/PDF/Floods/flood.pdf
- Ord, J. K., & Getis, A. (1995). Local spatial autocorrelation statistics: Distributional issues and an application. Geographical Analysis, 27(4), 286–306. https://doi.org/https://doi.org/10.1111/j.1538-4632.1995.tb00912.x
- Otsu, N. (1979). A threshold selection method from gray-level histograms. IEEE Transactions on Systems, Man, and Cybernetics, 9(1), 62–66. https://doi.org/https://doi.org/10.1109/TSMC.1979.4310076
- Panhalkar, S., & Jarag, A. P. (2017). Flood risk assessment of panchganga river (kolhapur district, Maharashtra) using GIS-based multicriteria decision technique. CURRENT SCIENCE, 112(4), 785–793. https://doi.org/https://doi.org/10.18520/cs/v112/i04/785-793
- Pelich, R., Chini, M., Hostache, R., Matgen, P., & López-Martínez, C. (2020). Coastline detection based on sentinel-1 time series for ship-and flood-monitoring applications. IEEE Geoscience and Remote Sensing Letters, 10, 1–5. https://doi.org/https://doi.org/10.1109/LGRS.2020.3008011
- Peter, B. G., Cohen, S., Lucey, R., Munasinghe, D., Raney, A., & Brakenridge, G. R. (2020). Google Earth Engine Implementation of the Floodwater Depth Estimation Tool (FwDET-GEE) for rapid and large scale flood analysis. IEEE Geoscience and Remote Sensing Letters, 1–5. https://doi.org/https://doi.org/10.1109/LGRS.2020.3031190
- Pörtner, H.-O., Roberts, D. C., Masson-Delmotte, V., Zhai, P., Tignor, M., Poloczanska, E., Mintenbeck, K., Alegría, A., Nicolai, M., Okem, A., Petzold, J., Rama, B., & Weyer, N. M. (2019). Special Report on the Ocean and Cryosphere in a Changing Climate (pp. 1–66). Intergovernmental Panel on Climate Change. https://www.ipcc.ch/site/assets/uploads/sites/3/2019/12/02_SROCC_FM_FINAL.pdf
- Roy, S. S., Lakshmanan, V., Bhowmik, S. R., & Thampi, S. (2010). Doppler weather radar based nowcasting of cyclone Ogni. Journal of Earth System Science, 119(2), 183–199. https://doi.org/https://doi.org/10.1007/s12040-010-0016-7
- Sarkar, S. (2021). Rapid assessment of cyclone damage using NPP-VIIRS DNB and ancillary data. Natural Hazards, 106(1), 579–593. https://doi.org/https://doi.org/10.1007/s11069-020-04477-9
- Schumann, G., Brakenridge, G., Kettner, A., Kashif, R., & Niebuhr, E. (2018). Assisting flood disaster response with earth observation data and products: A critical assessment. Remote Sensing, 10(8), 1230. https://doi.org/https://doi.org/10.3390/rs10081230
- Scorzini, A. R., Radice, A., & Molinari, D. (2018). A new tool to estimate inundation depths by spatial interpolation (RAPIDE): Design, application and impact on quantitative assessment of flood damages. Water, 10(12), 1805. https://doi.org/https://doi.org/10.3390/w10121805
- Scotti, V., Giannini, M., & Cioffi, F. (2020). Enhanced flood mapping using synthetic aperture radar (SAR) images, hydraulic modelling, and social media: A case study of Hurricane Harvey (Houston, TX). Journal of Flood Risk Management, 13(4), e12647. https://doi.org/https://doi.org/10.1111/jfr3.12647
- Shen, X., Wang, D., Mao, K., Anagnostou, E., & Hong, Y. (2019). Inundation Extent Mapping by Synthetic Aperture Radar: A Review. Remote Sensing, 11(7), 879. https://doi.org/https://doi.org/10.3390/rs11070879
- Sherpa, S. F., Shirzaei, M., Ojha, C., Werth, S., & Hostache, R. (2020). Probabilistic Mapping of August 2018 Flood of Kerala, India, Using Space-Borne Synthetic Aperture Radar. IEEE Journal of Selected Topics in Applied Earth Observations and Remote Sensing, 13, 896–913. https://doi.org/https://doi.org/10.1109/JSTARS.2020.2970337
- Tay, C. W., Yun, S.-H., Chin, S. T., Bhardwaj, A., Jung, J., & Hill, E. M. (2020). Rapid flood and damage mapping using synthetic aperture radar in response to Typhoon Hagibis, Japan. Scientific Data, 7(1), 1–9. https://doi.org/https://doi.org/10.1038/s41597-020-0443-5
- Tewara, M. A., Mbah-Fongkimeh, P. N., Dayimu, A., Kang, F., & Xue, F. (2018). Small-area spatial statistical analysis of malaria clusters and hotspots in Cameroon; 2000–2015. BMC Infectious Diseases, 18(1), 1–15. https://doi.org/https://doi.org/10.1186/s12879-018-3534-6
- Thakur, P., Ranjan, R., Singh, S., Dhote, P., Sharma, V., Srivastav, V., Dhasmana, M., Aggarwal, S., Chauhan, P., Nikam, B., Garg, V., & Chouksey, A., & others. (2020). Synergistic use of remote sensing, GIS and hydrological models for study of August 2018 Kerala floods. The International Archives of Photogrammetry, Remote Sensing and Spatial Information Sciences, 43, 1263–1270. https://doi.org/https://doi.org/10.5194/isprs-archives-XLIII-B3-2020-1263-2020
- Tiwari, V., Kumar, V., Matin, M. A., Thapa, A., Ellenburg, W. L., Gupta, N., Thapa, S., & Schumann, G. J. P. (2020). Flood inundation mapping-Kerala 2018; Harnessing the power of SAR, automatic threshold detection method and Google Earth Engine. PLoS One, 15(8), e0237324. https://doi.org/https://doi.org/10.1371/journal.pone.0237324
- Tsai, D.-M. (1995). A fast thresholding selection procedure for multimodal and unimodal histograms. Pattern Recognition Letters, 16(6), 653–666. https://doi.org/https://doi.org/10.1016/0167-8655(95)80011-H
- Twele, A., Cao, W., Plank, S., & Martinis, S. (2016). Sentinel-1-based flood mapping: A fully automated processing chain. International Journal of Remote Sensing, 37(13), 2990–3004. https://doi.org/https://doi.org/10.1080/01431161.2016.1192304
- Vanama, V., Babu, K., & Rao, Y. (2020). Ground truth mapping with multi-temporal earth observation data in ESA CloudTool box: A case of Kerala flood event occurred in 2018. 2020 International Conference on Emerging Smart Computing and Informatics (ESCI), 133–136. https://doi.org/https://doi.org/10.1109/ESCI48226.2020.9167570URL
- Vanama, V., Rao, Y., & Bhatt, C. (2021). Change detection based flood mapping using multi-temporal Earth Observation satellite images: 2018 flood event of Kerala, India. European Journal of Remote Sensing,54(1), 42–58. https://doi.org/https://doi.org/10.1080/22797254.2020.1867901
- Vanama, V. S. K., Mandal, D., & Rao, Y. S. (2020). GEE4FLOOD: Rapid mapping of flood areas using temporal Sentinel-1 SAR images with Google Earth Engine cloud platform. Journal of Applied Remote Sensing, 14(3), 034505. https://doi.org/https://doi.org/10.1117/1.JRS.14.034505
- Vanama, V. S. K., Musthafa, M., Khati, U., R, G. Singh, G., & Rao, Y. S. (2021). Flood extent mapping of Kerala flood event in 2018 using ALOS-2 and temporal Sentinel-1 SAR images. Current Science, 120(5), 1–11. https://doi.org/https://doi.org/10.18520/cs/v120/i5/915-925
- Walker, J., Dasgupta, A., Hostache, R., Ramsankaran, R., Schumann, G., Grimaldi, S., & Pauwels, V. (2019). Optimizing Targeted SAR Acquisitions for Flood Extent Assimilation to Improve Inundation Forecasts (Vol. 2019, pp. H11M–1679). AGU Fall Meeting Abstracts.
- Wang, D., Ding, W., Lo, H., Stepinski, T., Salazar, J., & Morabito, M. (2013). Crime hotspot mapping using the crime related factors—A spatial data mining approach. Applied Intelligence, 39(4), 772–781. https://doi.org/https://doi.org/10.1007/s10489-012-0400-x
- White, L., Brisco, B., Pregitzer, M., Tedford, B., & Boychuk, L. (2014). RADARSAT-2 beam mode selection for surface water and flooded vegetation mapping. Canadian Journal of Remote Sensing, 40(2), 135–151. https://doi.org/https://doi.org/10.1080/07038992.2014.943393
- Zhang, B., Wdowinski, S., Oliver-Cabrera, T., Koirala, R., Jo, M., & Osmanoglu, B. (2018). Mapping the extent and magnitude of severe flooding induced by Hurricane IRMA with multi-temporal SENTINEL-1 SAR and Insar observations. The International Archives of Photogrammetry Remote Sensing and Spatial Information Sciences, XLII-3(43), 2237–2244. https://doi.org/https://doi.org/10.5194/isprs-archives-XLII-3-2237-2018