
 ?Mathematical formulae have been encoded as MathML and are displayed in this HTML version using MathJax in order to improve their display. Uncheck the box to turn MathJax off. This feature requires Javascript. Click on a formula to zoom.
ABSTRACT
Jiangxi Province boasts the second-highest forest coverage in China. Its forests play a crucial role in providing essential ecosystem services and maintaining the ecological health of the region. High-resolution and high-precision forest mapping are significant in the timely and accurate monitoring of dynamic forest changes to support sustainable forest management. This study used Sentinel-2 images from four seasons in the Google Earth Engine (GEE) platform to map forest distribution. Moreover, the classification results were compared and analyzed using different classification algorithms and feature-variable combinations. Based on the overall accuracy, the optimal image seasonality, feature combinations and classification algorithms were selected, and the forest maps of Jiangxi Province were mapped from 2019 to 2021. The accuracy evaluation showed that the winter image classification results had the highest accuracy (above 0.88). The red edge bands carried by Sentinel-2 could effectively improve the classification accuracy. The Random Forest classifier is the optimal classification algorithm for forest mapping in Jiangxi Province. The forest mapping obtained can be used for ecological health assessment and ecosystem function. The study provides a scientific basis for accurate and timely extraction of forest cover and can serve as a valuable resource for forest management planning and future research.
Introduction
Forests are crucial in providing various ecosystem services vital for human economies and well-being, such as timber and non-timber products, carbon sequestration, watershed protection, habitat diversity and even entertainment (Alamgir et al., Citation2016; Brockerhoff et al., Citation2017). Yet, forests have changed significantly and are now more endangered by climate change, fire and fragmentation (Bonan, Citation2008; Tariq, Mumtaz, Majeed, et al., Citation2022; Y. Wang et al., Citation2022). As a result, timely and accurate data on forest cover are critically needed to enable sustainable natural resource management, carbon storage and biodiversity research, as well as to give a direct method of monitoring forest changes (Gómez et al., Citation2016; Häyhä et al., Citation2015; Qin et al., Citation2021; Tariq, Mumtaz, Majeed, et al., Citation2022).
Forest mapping has been extensively studied and analyzed from various perspectives. However, traditional field measurement techniques are time-consuming and cannot provide large-scale and continuous forest distribution information. Therefore, remote sensing technology has become a valuable tool for identifying the size, types and changes in forests due to its high frequency and spatial resolution (Tariq & Mumtaz, Citation2022; Tariq, Mumtaz, Majeed, et al., Citation2022, Citation2022; Y. Wang et al., Citation2020). Many remote sensing-based products have been developed to cover a wide area of forest distribution and types (Giri et al., Citation2011; Gong et al., Citation2012; Hansen et al., Citation2013). However, these products may not always be up-to-date due to insufficient input data and a lengthy realization process (Y. Wang et al., Citation2022). Additionally, their precision on more minor scales is often unsatisfactory. A common concern is the accuracy of global maps, which are often less accurate than regional maps due to the limited sample size used (Barrett et al., Citation2016).
Sentinel-2 imagery is widely used to extract forest information due to its high spatial resolution, frequent revisits and rich spectral bands (Adjognon et al., Citation2019; Barakat et al., Citation2018; Ganz et al., Citation2020; Ma et al., Citation2021; Norovsuren et al., Citation2019; Ottosen et al., Citation2020; Szostak et al., Citation2017). Compared to commonly used images, Sentinel-2 has red-edge spectral bands located between the red and NIR parts of the EM, allowing for more accurate chlorophyll content measurement for vegetation monitoring (Filella & Penuelas, Citation2007). The red edge bands have been shown in multiple studies to improve classification accuracy by enhancing separability between different objects (Forkuor et al., Citation2017; Qiu et al., Citation2017). Additionally, red edge indices significantly enrich the feature space for land object classification and improve classification accuracy (Gorelick et al., Citation2017; S. Y. Huang et al., Citation2018; Kim & Yeom, Citation2014; Ustuner et al., Citation2014).
Utilizing multi-season remote sensing images is advantageous for forest mapping as it enables the detection of seasonal changes in vegetation and provides a comprehensive landscape view (Feng et al., Citation2016; Gao et al., Citation2015; R. Li et al., Citation2022; Zhu et al., Citation2012). However, most classification studies based on multi-seasonal imagery only consider the dry and rainy seasons, with four-season studies being rare (Fundisi et al., Citation2021; Kaszta et al., Citation2016; Pu et al., Citation2018). Given the study area’s primary forest type of evergreen coniferous forest, we hypothesized that using four-season remote sensing imagery would improve forest mapping accuracy. This is because, in winter, the forest remains evergreen while other easily confused vegetation, such as grasses and shrubs, is dormant, and agricultural land is harvested.
Machine learning algorithms have developed rapidly in recent years. The classification algorithms such as random forest (RF), support vector machine (SVM) and classification regression tree (CART) have been widely used for forest mapping (Talukdar et al., Citation2020). RF can perform feature selection, while SVM is effective for small sample data (Pelletier et al., Citation2016; Y. Yang, D. Yang, X. F. Wang, et al., Citation2021). CART is suitable for large-scale datasets (Shao & Lunetta, Citation2012). Many studies on forest cover mapping have employed various machine learning algorithms and compared their accuracy (Camargo et al., Citation2019; Jamali, Citation2019; X. Li et al., Citation2016; Rogan et al., Citation2008).
Jiangxi Province has a forest coverage rate of 61.16%, the second highest in China. However, due to rigorous management and activities like logging, forest growth and loss shifts have significant implications for forest structure and function (Ahrends et al., Citation2017). The Jiangxi Forestry Bureau conducts forest surveys every 5 years and issues resource reports, but dynamic forest changes are not accurately and promptly monitored due to the scattered and short-term impacts of disturbance (Hua et al., Citation2021). Therefore, more efficient and comprehensive methods, such as remote sensing techniques, must be adopted to monitor forest changes promptly and accurately. This study used RF, SVM and CART algorithms on the Google Earth Engine (GEE) platform to integrate four-season image data from Sentinel-2. Our study aimed to (1) assess the role of four-season remote sensing imagery in improving the accuracy of forest mapping, (2) analyze the impact of different feature combinations, especially the red edge bands and red edge indices, on the classification results, (3) evaluate the accuracy of each classification algorithm, (4) select the optimal combination to map the forest distribution of Jiangxi Province from 2019 to 2021. Overall, our study provides a scientific basis for the accurate and timely extraction of forest distribution, identifies the most suitable seasonal images for forest mapping in Jiangxi Province and offers a research reference for predicting future forest cover changes.
Materials and method
Study area
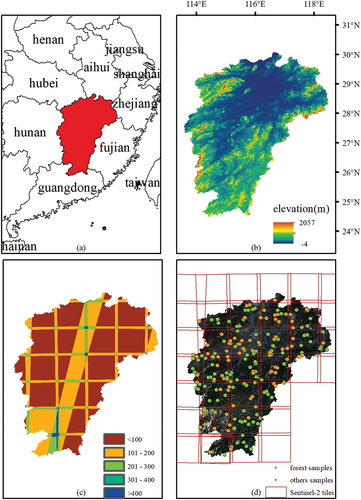
Jiangxi Province, located in southeastern China, covers an area of 166,900 km2 between 24°29’14“to 30°04’43” north latitude and 113°34’18“to 118°28’56” east longitude (). Its subtropical warm and humid monsoon climate zone has an average annual temperature of 16.3–19.5°C and a yearly precipitation of 1341–1943 mm, making it one of the rainiest provinces in China. Hills and mountains dominate the area and the terrain slopes from south to north. The forest coverage rate has significantly increased from 36.70% in 1973–1976 to 61.16% in 2014–2018, ranking second in the country (Hua et al., Citation2021). Despite having abundant forest resources, including evergreen broad-leaved, evergreen coniferous and mixed forests, these forests are extensively affected by various natural and human-induced disturbances, such as logging, insects, disease and fire (Deng et al., Citation2016).
Figure 1. The location of Jiangxi Province (a), elevation (b), the total number of Sentinel-2 observations during the study period (c) and sample distribution (d).
Data preparation
Sentinel-2 image data
Sentinel-2A carries a multispectral imager covering 13 spectral bands, including visible light, red-edge, near-infrared and short-wave infrared. The spatial resolution of the visible light bands and the near-infrared band is 10 m, while that of the red-edge and short-wave infrared bands is 20 m. We interpolated the red-edge bands to match the 10-meter resolution of the visible and near-infrared spectra to ensure a consistent resolution. We used Sentinel-2 Level-2A products from 2019 to 2020 for all four seasons to conduct our study. To ensure high-quality imagery, we filtered the image collections in GEE using three criteria: (1) the study area within Jiangxi Province, (2) the time interval from March 2019 to February 2020 and (3) a cloud percentage threshold of 20%. By applying these filters, we selected 1088 Sentinel-2 images in Jiangxi, each containing 12 spectral bands and three for quality assessment (QA). We used the QA60 band to remove clouds and create a cloud mask, resulting in cloud-free images.
STRM data
The study utilized highly accurate elevation data from the SRTM dataset, which was measured using synthetic aperture radar by NASA and NIMA (Su et al., Citation2021). We accessed and processed the digital elevation data from the SRTMGL1_003 products on the GEE platform for efficient geospatial data analysis.
Training and validation sample data
The accuracy and sufficiency of selecting training and validation samples significantly impact the accuracy of forest mapping (C. C. Li et al., Citation2014). To manage and analyze land cover and land use data, the Food and Agriculture Organization of the United Nations (FAO) developed Collect Earth, an open-source land monitoring software (Bey et al., Citation2016; Tzamtzis et al., Citation2019). We imported 200 random sample points from ArcGIS into Collect Earth and visually classified land use types as forest or others using Mapbox Satellite as the base map image (). Finally, we randomly divided the sample points into 70% training and 30% validation sets to assess the classification performance.
Research methodology
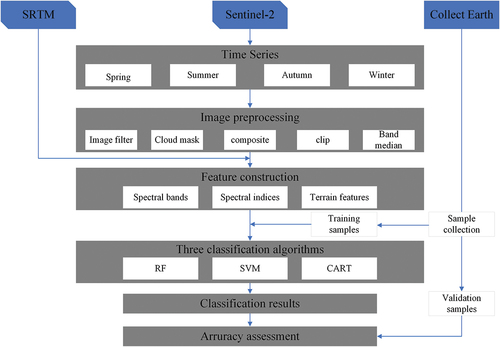
This study aims to map the forest distribution of Jiangxi Province from 2019 to 2021 using the classification algorithm of the GEE cloud platform and the four-season image data from Sentinel-2. The methodology consists of four steps: image preprocessing, feature construction, image classification and accuracy evaluation, as illustrated in .
Figure 2. The technical roadmap of this study.
Feature selection
Spectral bands
To investigate the contribution of red-edge bands in forest mapping, we selected seven relevant Sentinel-2 image bands (B2, B3, B4, B5, B6, B7 and B8) (). These spectral bands were then divided into two groups: one with no red-edge participation (B2, B3, B4 and B8) and the other with red-edge involvement (B2, B3, B4, B5, B6, B7 and B8). This approach allowed us to assess the impact of adding red-edge bands on the accuracy of forest cover identification.
Table 1. Characteristics of Sentinel-2 MSI bands used in this study.
Spectral indices
This study also aimed to explore the impact of red-edge indices on forest distribution mapping accuracy. Two commonly used vegetation indices, the Normalized Difference Vegetation Index (NDVI) and Soil Adjusted Vegetation Index (SAVI), were added to the experimental group without red-edge participation (Jordan, Citation1969; Rouse et al., Citation1974). In the experimental group with red-edge involvement, NDVI was replaced with Normalized Difference Vegetation Index Red Edge (NDVIRE), and Sentinel 2 Red Edge Position (S2REP) was added (Frampton et al., Citation2013; Rouse et al., Citation1974). All the spectral indices were calculated using their respective formulas through the GEE cloud platform. The calculation formulas for each index are as follows:
Here, NIR represents the Near Infrared band, RED represents the Red band, and RED EDGE1–3 represent the Red Edge bands. Adding these indices is expected to improve the accuracy of forest distribution mapping by providing additional information on vegetation and land cover characteristics.
Terrain features
Adding terrain features has been shown to improve classification accuracy (Y. Yang, D. Yang, X. F. Wang, et al., Citation2021). In this study, we used the SRTMGL1_003 digital elevation data product in GEE to derive elevation and slope, which were included as independent variables in the classification.
We added the selected feature variables to the combination of features with and without red-edge involvement to explore their contribution to the classification, as outlined in .
Table 2. Classification feature combinations.
Classification algorithms
Random forest
Breiman (Citation2001) proposed the random forest algorithm (RF), a simulation-based machine learning method that utilizes iteration and is categorized as a classification tree-based algorithm. RF has been widely used in various fields, including ground object extraction, image classification and regression analysis (Belgiu & Drăguţ, Citation2016; Cánovas-García et al., Citation2017; Jin et al., Citation2018; Kelley et al., Citation2018; Maxwell et al., Citation2019; Millard & Richardson, Citation2015; Pelletier et al., Citation2016; Teluguntla et al., Citation2018). In RF-based remote sensing image classification, the primary factors affecting accuracy are the number of decision trees and the minimum number of leaf nodes. Previous research suggests that the value of RF parameters has a limited effect on the accuracy (Pelletier et al., Citation2016). In this study, we set the number of decision trees to 40 and used the default value for the minimum leaf population. The explain function in GEE was used to calculate the importance score of selected features, which is relative and varies with the features and sample data involved in the classification (Q. Y. Li et al., Citation2020; C. Liu et al., Citation2020).
Support vector machine
Vapnik introduced the support vector machine (SVM) classification algorithm in 1995 (Shao & Lunetta, Citation2012). SVM is a popular choice for remote sensing image classification due to its ability to handle high-dimensional data, prevent overfitting and achieve high accuracy (C. Huang et al., Citation2010; Praticò et al., Citation2021). Previous research has shown that SVM performs exceptionally well in computing small samples (Shi & Yang, Citation2015; Y. Yang, D. Yang, X. F. Wang, et al., Citation2021). Although selecting appropriate parameters is crucial for SVM classification, default values are generally suitable for many classification problems. Given the research scope, we used the default parameter values in this study.
Classification and regression tree
The classification and regression tree (CART) is a popular single-tree decision classifier used for MODIS and TM image classification due to its simplicity, fast computation and accessible interpretation (Shao & Lunetta, Citation2012; Y. Yang, D. Yang, X. F. Wang, et al., Citation2021). Two key parameters must be considered to optimize CART performance for remote sensing image classification in GEE: the minimum leaf population and the maximum number of nodes. This study used the default parameter values for classification calculations.
Accuracy assessment
The confusion matrix is a widely used method for evaluating the accuracy of image classifications (Rana et al., Citation2020; Z. H. Wang et al., Citation2017). In this study, we utilized the confusion matrix in GEE to calculate two evaluation indices: the overall accuracy and the kappa coefficient. These metrics comprehensively assess the classification results and their accuracy. The overall accuracy assesses the algorithm’s performance by correctly classifying samples in relation to the total number of validation samples. The Kappa coefficient provides insights into the model’s performance by measuring the agreement between the sample data and the predicted values (Mahdianpari et al., Citation2018).
Results
Four-season images comparison
displays the accuracy of SVM, CART and RF algorithms for forest mapping using different feature combinations of Sentinel-2 four-season images. Winter images attained the highest average accuracy of 0.88. The highest classification accuracy for each experimental combination was also found in the combination based on winter images, with an accuracy of 0.92. Spring imagery had the second-highest average accuracy, while summer images had the poorest classification accuracy. These findings suggest that winter images are the most suitable for forest mapping in the study area.
Table 3. The classification accuracy of different experimental combinations.
Feature importance
shows that adding red edge bands to the feature combination improved classification performance, especially for the RF classifier. The red edge bands increased the accuracy of spring and summer images by 0.02 in the RF classifier but did not affect autumn and winter images. However, the advantage of red edge bands was less significant in the CART classifier, with only a slight improvement in the accuracy of summer images and a reduction in the accuracy of spring, autumn and winter images.
To determine the importance of each feature variable for classification accuracy, we used the importance scores provided by the RF classifier, which indicate that variables with higher scores are more critical (Sun et al., Citation2020). We selected the experimental group with the highest classification accuracy in (winter images with red edge bands using the RF classification algorithm) for importance score calculation. shows the distribution of importance scores for the feature variables used in this experimental group.
Figure 3. Importance score distribution for feature variables used in the experimental group with the highest classification accuracy (winter images with red edge bands using the RF classification algorithm).
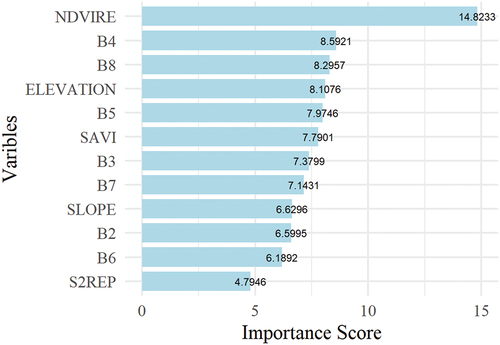
According to , red edge indices have the highest importance score, followed by spectral band score, whereas topographic feature has a relatively low importance score. Notably, the NDVIRE has the highest importance score (14.8233), significantly higher than the second-ranked feature variable, B4 (8.5921). However, the importance score of S2REP was unexpectedly low at 4.7946. The remaining feature variable importance scores are relatively similar, ranging from 6.1892 to 8.5921. Specifically, B4, B8 and elevation have importance scores above 8, while Slope, B2 and B6 have relatively low importance scores ranging from 6 to 7.
Classifier comparison
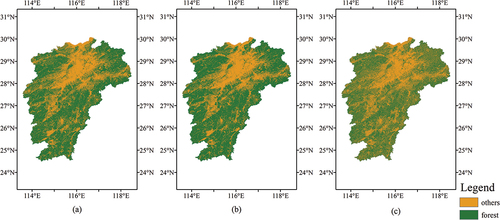
shows that the RF achieved the highest classification accuracy in the region with an overall accuracy above 0.85 and a maximum of 0.92. SVM is the second-best classifier, with a classification accuracy above 0.8, while CART has the lowest classification accuracy among the three, with an accuracy of above 0.67.
illustrates the forest distribution obtained from the winter images with red edge bands using different classification algorithms. The forest maps generated by the RF and SVM classifiers exhibit highly consistent distribution patterns, while the forest map generated using the CART classifier presents a more fragmented forest area than the other two classifiers.
Figure 4. Forest distribution obtained from winter images with red edge bands using the RF classification algorithm (a), forest distribution obtained from winter images with red edge bands using the SVM classification algorithm (b), forest distribution obtained from winter images with red edge bands using the CARF classification algorithm (c).
Forest map
Based on the overall accuracy results, we found that the winter images with red edge bands using the RF classification algorithm were the best combination. Therefore, we used this feature combination to map the forest in 2019, 2020 and 2021 and obtained the overall accuracy for each year. As shown in , the maps had an overall accuracy above 0.88 for each of the 3 years.
Table 4. Classification accuracy of forest maps in 2019, 2020 and 2021.
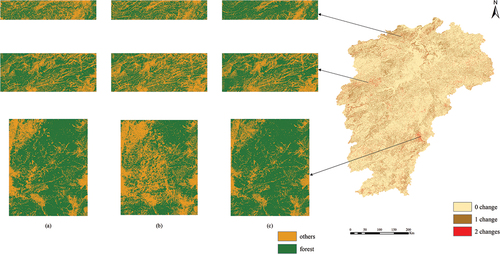
The forest maps produced for three periods were utilized to track forest distribution changes from 2019 to 2021 (). Significant land cover changes were concentrated in the study area’s northern, western and southeastern regions. The northern area experienced an increase in forest cover, likely due to reforestation efforts and the conversion of agricultural land to the forest during this period. Conversely, both the western and southeastern areas experienced forest loss followed by regrowth, possibly due to logging and forest fires.
Figure 5. Forest cover change 2019–2021. Map of forest distribution from 2019 to 2021 for three areas of high change (a-c).
Discussion
Comparison of the performances of multispectral images in four seasons
Our study highlights that winter remote sensing images are more suitable for forest mapping in our study area. The result contrasts with findings in other regions where the application of growing season imagery for mapping forest distribution was deemed more precise (Gao et al., Citation2015; Q. S. Liu et al., Citation2019; Townshend et al., Citation2012; Tucker et al., Citation2004). This difference is mainly due to the prevalence of evergreen forest types in the study area. The presence of dormant vegetation during the winter helps reduce confusion with forests in feature recognition. Deciduous vegetation exhibits reflectance characteristics that differ significantly from evergreen species, lacking a green peak, red edge effect and lower reflectance in the NIR band.
displays the annual and seasonal average NDVIRE values for the highest importance scores from . Both land use categories exhibit higher NDVIRE values during summer but lower values in winter compared to the year-round average. The differences in winter NDVIRE values are more consistent with the forest distribution results in . Furthermore, shows that the two land use categories differ primarily in winter regarding NDVIRE values. During the growing season, the non-forest vegetation experiences significant NDVIRE fluctuations that could cause feature misclassification. These findings support our hypothesis that utilizing previous knowledge-based winter remote sensing images is more suitable for mapping forests in Jiangxi Province.
Figure 6. The average NDVIRE values for forest and the other category throughout the year (a), the average NDVIRE values for forest and the other category throughout the spring (b), the average NDVIRE values for forest and the other category throughout the summer (c), the average NDVIRE values for forest and the other category throughout the autumn (d), the average NDVIRE values for forest and the other category throughout the winter (e).
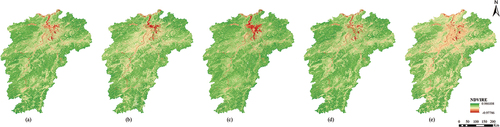
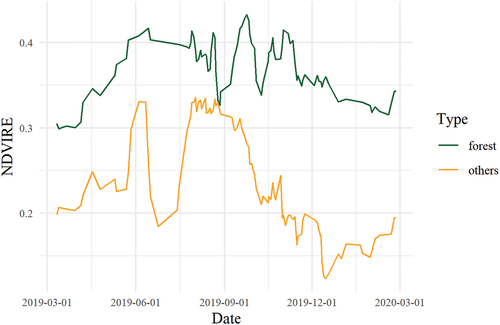
Figure 7. Monthly averages of NDVIRE for each land class from 2019 to 2020.
The effects of feature variables on classification performance
The red-edge bands and indices are significant in the classification process, evidenced by the accuracy of various experimental combinations and importance scores. Red-edge bands are particularly useful for differentiating morphologically similar plants due to their unique characteristics of sharp increases in vegetation reflectance (Filella & Penuelas, Citation2007; Fundisi et al., Citation2021). In forest mapping, red-edge bands have also been emphasized in previous studies. Son et al. used Rapideye imagery to map mangrove density in Central America, as did Ottosen use Sentinel-2 satellite imagery to map tree cover in Europe and found that combinations including red edges had the highest accuracy (Ottosen et al., Citation2020; Son et al., Citation2017). Additionally, some studies confirm that red-edge indices based on the red-edge bands can effectively improve classification accuracy by expanding the feature space of the object (Kim & Yeom, Citation2014; Shamsoddini & Raval, Citation2018). Therefore, our study further highlights the value of Sentinel-2’s red-edge bands and indices in forest mapping.
Comparison of the performances of the different classifiers
This study compared RF, SVM and CART for forest mapping in Jiangxi Province, with the highest overall accuracy achieved by RF, followed by SVM and CART. Similarities and differences were found in previous studies (Eskandari & Ali Mahmoudi, Citation2022; Na et al., Citation2010; Senf et al., Citation2020; Shi & Yang, Citation2017). The variations in classification effectiveness may depend on the study area, topography and land cover types (Y. Yang, D. Yang, X. F. Wang, et al., Citation2021). Therefore, the finding that RF is the optimal classifier for forest mapping in Jiangxi Province only applies to this region.
Limitations and research prospects
Like other studies, this study has many limitations. Although the 3-year forest map is accurate with a precision above 0.88, it only considers two land cover types. Furthermore, selecting samples through visual interpretation with Collect Earth is labor-intensive and may not be suitable for studying complex land cover types at a large scale. To overcome this limitation, we will employ a technique that efficiently and automatically transfer reference-year ground-truth samples based on Sentinel-2 images (Ghorbanian et al., Citation2020). In future studies, we plan to improve forest mapping accuracy by integrating the vegetation identification ability of Sentinel-2 red edge bands with Sentinel-1 multi-temporal data. With the increasing popularity of remote sensing data in object recognition, we hope to enhance our ability to classify land cover types in more complex environments accurately.
Conclusion
This study tested the hypothesis that using four-season remote sensing imagery would improve forest mapping accuracy. To achieve this, we employed three algorithms (RF, SVM and CART) to classify four-season images of Sentinel-2. Winter images achieved the highest accuracy rates for forest mapping (0.88), likely due to the distinction between evergreen vegetation dominating the study area and other vegetation during winter. Furthermore, our findings indicated that the red edge bands and indices carried by Sentinel-2 significantly improved classification accuracy. RF was the most suitable algorithm for forest distribution in Jiangxi Province, followed by SVM and CART. We generated forest maps of Jiangxi Province from 2019 to 2021 using the highest accuracy feature combinations, with a classification accuracy of >0.88. High-resolution satellite images provided crucial insights into the spatiotemporal dynamics of forests in Jiangxi Province and helped assess the sustainability of forest resources and climate change. Our study provides a scientific basis for accurate and timely extraction of forest distribution and is a valuable resource for forest management planning and future research.
Disclosure statement
No potential conflict of interest was reported by the author(s).
Data availability statement
The codes and datasets that support the findings of this study are available from the corresponding author upon reasonable request.
Additional information
Funding
References
- Adjognon, G. S., Rivera-Ballesteros, A., & van Soest, D. (2019). Satellite-based tree cover mapping for forest conservation in the drylands of Sub Saharan Africa (SSA): Application to Burkina Faso gazetted forests. Development Engineering, 4, 100039. https://doi.org/10.1016/j.deveng.2018.100039
- Ahrends, A., Hollingsworth, P. M., Beckschafer, P., Chen, H., Zomer, R. J., Zhang, L., Wang, M., & Xu, J. (2017). China’s fight to halt tree cover loss. Proceedings Biological Sciences / the Royal Society, 284(1854), 20162599. https://doi.org/10.1098/rspb.2016.2559
- Alamgir, M., Turton, S. M., Macgregor, C. J., & Pert, P. L. (2016). Ecosystem services capacity across heterogeneous forest types: Understanding the interactions and suggesting pathways for sustaining multiple ecosystem services. Science of the Total Environment, 566, 584–13. https://doi.org/10.1016/j.scitotenv.2016.05.107
- Barakat, A., Khellouk, R., El Jazouli, A., Touhami, F., & Nadem, S. (2018). Monitoring of forest cover dynamics in eastern area of Béni-Mellal Province using ASTER and Sentinel-2A multispectral data. Geology, Ecology, & Landscapes, 2(3), 203–215. https://doi.org/10.1080/24749508.2018.1452478
- Barrett, F., McRoberts, R. E., Tomppo, E., Cienciala, E., & Waser, L. T. (2016). A questionnaire-based review of the operational use of remotely sensed data by national forest inventories. Remote Sensing of Environment, 174, 279–289. https://doi.org/10.1016/j.rse.2015.08.029
- Belgiu, M., & Drăguţ, L. (2016). Random forest in remote sensing: A review of applications and future directions. ISPRS Journal of Photogrammetry and Remote Sensing, 114, 24–31. https://doi.org/10.1016/j.isprsjprs.2016.01.011
- Bey, A., Sanchez-Paus, D. A., Maniatis, D., Marchi, G., Mollicone, D., Ricci, S., Bastin, J., Moore, R., Federici, S., Rezende, M., Patriarca, C., Turia, R., Gamoga, G., Abe, H., Kaidong, E., & Miceli, G. (2016). Collect Earth: Land use and land cover assessment through augmented visual interpretation. Remote Sensing, 8(10), 1–24. https://doi.org/10.3390/rs8100807
- Bonan, G. B. (2008). Forests and climate change: Forcings, feedbacks, and the climate benefits of forests. Science: Advanced Materials and Devices, 320(5882), 1444–1449. https://doi.org/10.1126/science.1155121
- Breiman, L. (2001). Random forest. Machine Learning, 45(1), 5–32. https://doi.org/10.1023/A:1010933404324
- Brockerhoff, E. G., Barbaro, L., Castagneyrol, B., Forrester, D. I., Gardiner, B., Gonzalez-Olabarria, J. R., Lyver, P. O., Meurisse, N., Oxbrough, A., Taki, H., Thompson, I. D., van der Plas, F., & Jactel, H. (2017). Forest biodiversity, ecosystem functioning and the provision of ecosystem services. Biodiversity and Conservation, 26(13), 3005–3035. https://doi.org/10.1007/s10531-017-1453-2
- Camargo, F. F., Sano, E. E., Almeida, C. M., Mura, J. C., & Almeida, T. (2019). A comparative assessment of machine-learning techniques for land use and land cover classification of the Brazilian Tropical Savanna using ALOS-2/PALSAR-2 polarimetric images. Remote Sensing, 11(13), 1600–1616. https://doi.org/10.3390/rs11131600
- Cánovas-García, F., Alonso-Sarría, F., Gomariz-Castillo, F., & Oñate-Valdivieso, F. (2017). Modification of the random forest algorithm to avoid statistical dependence problems when classifying remote sensing imagery. Computers & Geosciences, 103, 1–11. https://doi.org/10.1016/j.cageo.2017.02.012
- Deng, L. I., Zhang, C. H., Wei, J. U., & Liu, L. J. (2016). Forest net primary productivity dynamics and driving forces in Jiangxi Province, China. Chinese Journal of Plant Ecology, 40(7), 643–657. https://doi.org/10.17521/cjpe.2015.0348
- Eskandari, S., & Ali Mahmoudi, S. (2022). Mapping land cover and forest density in Zagros forests of Khuzestan province in Iran: A study based on Sentinel-2, Google Earth and field data. Ecological Informatics, 70, 101727. https://doi.org/10.1016/j.ecoinf.2022.101727
- Feng, D., Zhao, Y. Y., Yu, L., Li, C. C., Wang, J., Clinton, N., Bai, Y. Q., Belward, A., Zhu, Z. L., & Gong, P. (2016). Circa 2014 African land-cover maps compatible with FROM-GLC and GLC2000 classification schemes based on multi-seasonal Landsat data. International Journal of Remote Sensing, 37(19), 4648–4664. https://doi.org/10.1080/01431161.2016.1218090
- Filella, I., & Penuelas, J. (2007). The red edge position and shape as indicators of plant chlorophyll content, biomass and hydric status. International Journal of Remote Sensing, 15(7), 1459–1470. https://doi.org/10.1080/01431169408954177
- Forkuor, G., Dimobe, K., Serme, I., & Tondoh, J. E. (2017). Landsat-8 vs. Sentinel-2: Examining the added value of sentinel-2’s red-edge bands to land-use and land-cover mapping in Burkina Faso. GIScience & Remote Sensing, 55(3), 331–354. https://doi.org/10.1080/15481603.2017.1370169
- Frampton, W. J., Dash, J., Watmough, G., & Milton, E. J. (2013). Evaluating the capabilities of Sentinel-2 for quantitative estimation of biophysical variables in vegetation. ISPRS Journal of Photogrammetry and Remote Sensing, 82, 83–92. https://doi.org/10.1016/j.isprsjprs.2013.04.007
- Fundisi, E., Tesfamichael, S. G., & Ahmed, F. (2021). A bi-seasonal classification of woody plant species using Sentinel-2A and SPOT-6 in a localised species-rich savanna environment. Geocarto International, 32(21), 1–22. https://doi.org/10.1080/10106049.2021.1939441
- Ganz, S., Adler, P., & Kändler, G. (2020). Forest cover mapping based on a combination of aerial images and Sentinel-2 satellite data compared to National Forest Inventory Data. Forests, 11(12), 1322. https://doi.org/10.3390/f11121322
- Gao, T., Zhu, J., Zheng, X., Shang, G., Huang, L., & Wu, S. (2015). Mapping spatial distribution of larch plantations from multi-seasonal Landsat-8 OLI imagery and multi-scale textures using random forests. Remote Sensing, 7(2), 1702–1720. https://doi.org/10.3390/rs70201702
- Ghorbanian, A., Kakooei, M., Amani, M., Mahdavi, S., Mohammadzadeh, A., & Hasanlou, M. (2020). Improved land cover map of Iran using Sentinel imagery within google earth engine and a novel automatic workflow for land cover classification using migrated training samples. ISPRS Journal of Photogrammetry and Remote Sensing, 167, 276–288. https://doi.org/10.1016/j.isprsjprs.2020.07.013
- Giri, C., Ochieng, E., Tieszen, L. L., Zhu, Z., Singh, A., Loveland, T., Masek, J., & Duke, N. (2011). Status and distribution of mangrove forests of the world using earth observation satellite data. Global Ecology and Biogeography, 20(1), 154–159. https://doi.org/10.1111/j.1466-8238.2010.00584.x
- Gómez, C., White, J. C., & Wulder, M. A. (2016). Optical remotely sensed time series data for land cover classification: A review. ISPRS Journal of Photogrammetry and Remote Sensing, 116, 55–72. https://doi.org/10.1016/j.isprsjprs.2016.03.008
- Gong, P., Wang, J., Yu, L., Zhao, Y., Zhao, Y., Liang, L., Niu, Z., Huang, X., Fu, H., Liu, S., Li, C., Li, X., Fu, W., Liu, C., Xu, Y., Wang, X., Cheng, Q., Hu, L. … Chen, J. (2012). Finer resolution observation and monitoring of global land cover: First mapping results with Landsat TM and ETM+ data. International Journal of Remote Sensing, 34(7), 2607–2654. https://doi.org/10.1080/01431161.2012.748992
- Gorelick, N., Hancher, M., Dixon, M., Ilyushchenko, S., Thau, D., & Moore, R. (2017). Google Earth Engine: Planetary-scale geospatial analysis for everyone. Remote Sensing of Environment, 202, 18–27. https://doi.org/10.1016/j.rse.2017.06.031
- Hansen, M. C., Potapov, P. V., Moore, R., Hancher, M., Turubanova, S. A., Tyukavina, A., Thau, D., Stehman, S. V., Goetz, S. J., Loveland, T. R., Kommareddy, A., Egorov, A., Chini, L., Justice, C. O., & Townshend, J. R. G. (2013). High-resolution global maps of 21st-century forest cover change. Science: Advanced Materials and Devices, 342(6160), 850–853. https://doi.org/10.1126/science.1244693
- Häyhä, T., Franzese, P., Paletto, A., & Fath, B. D. (2015). Assessing, valuing, and mapping ecosystem services in Alpine forests. Ecosystem Services, 14, 12–23. https://doi.org/10.1016/j.ecoser.2015.03.001
- Hua, J. W., Chen, G. S., Yu, L., Ye, Q., Jiao, H. B., & Luo, X. F. (2021). Improved mapping of long-term forest disturbance and recovery dynamics in the subtropical China using all available Landsat time-series imagery on google earth engine platform. IEEE Journal of Selected Topics in Applied Earth Observations and Remote Sensing, 14, 2754–2768. https://doi.org/10.1109/jstars.2021.3058421
- Huang, C., Davis, L. S., & Townshend, J. R. G. (2010). An assessment of support vector machines for land cover classification. International Journal of Remote Sensing, 23(4), 725–749. https://doi.org/10.1080/01431160110040323
- Huang, S. Y., Yang, L., Chen, X., & Yuan, Y. (2018). Study of typical arid crops classification based on machine learning. Spectroscopy Spectral Analysis, 38(10), 3169–3176. https://doi.org/10.2147/CMAR.S169459
- Jamali, A. (2019). Evaluation and comparison of eight machine learning models in land use/land cover mapping using Landsat 8 OLI: A case study of the northern region of Iran. SN Applied Sciences, 1(11), 1448–1459. https://doi.org/10.1007/s42452-019-1527-8
- Jin, Y. H., Liu, X. P., Chen, Y. M., & Liang, X. (2018). Land-cover mapping using Random Forest classification and incorporating NDVI time-series and texture: A case study of central Shandong. International Journal of Remote Sensing, 39(23), 8703–8723. https://doi.org/10.1080/01431161.2018.1490976
- Jordan, C. F. (1969). Derivation of leaf‐area index from quality of light on the forest floor. Ecology, 50(4), 663–666. https://doi.org/10.2307/1936256
- Kaszta, Z., Van De Kerchove, R., Ramoelo, A., Cho, M., Madonsela, S., Mathieu, R., & Wolff, E. (2016). Seasonal Separation of African Savanna components using worldview-2 imagery: A comparison of pixel- and object-based approaches and selected classification algorithms. Remote Sensing, 8(9), 763–782. https://doi.org/10.3390/rs8090763
- Kelley, L. C., Pitcher, L., & Bacon, C. (2018). Using google earth engine to map complex shade-grown coffee landscapes in Northern Nicaragua. Remote Sensing, 10(6), 952–971. https://doi.org/10.3390/rs10060952
- Kim, H., & Yeom, J. (2014). Effect of red-edge and texture features for object-based paddy rice crop classification using RapidEye multi-spectral satellite image data. International Journal of Remote Sensing, 35(19), 7046–7068. https://doi.org/10.1080/01431161.2014.965285
- Li, X., Chen, W., Cheng, X., & Wang, L. Z. (2016). A comparison of machine learning algorithms for mapping of complex surface-mined and agricultural landscapes using ZiYuan-3 stereo satellite imagery. Remote Sensing, 8(6), 514–541. https://doi.org/10.3390/rs8060514
- Li, R., Fang, P., Xu, W., Wang, L., Ou, G., Zhang, W., & Huang, X. (2022). Classifying forest types over a mountainous area in southwest china with Landsat data composites and multiple environmental factors. Forests, 13(1), 135. https://doi.org/10.3390/f13010135
- Li, Q. Y., Qiu, C. P., Ma, L., Schmitt, M., & Zhu, X. (2020). Mapping the land cover of Africa at 10 m resolution from multi-source remote sensing data with google earth engine. Remote Sensing, 12(4), 602–624. https://doi.org/10.3390/rs12040602
- Liu, C., Li, W. L., Zhu, G. F., Zhou, H. K., Yan, H. P., & Xue, P. F. (2020). Land use/land cover changes and their driving factors in the Northeastern Tibetan Plateau based on geographical detectors and google earth engine: A case study in gannan prefecture. Remote Sensing, 12(19), 3139–3157. https://doi.org/10.3390/rs12193139
- Liu, Q. S., Song, H. W., Liu, G. H., Huang, C., & Li, H. (2019). Evaluating the potential of multi-seasonal CBERS-04 imagery for mapping the quasi-circular vegetation patches in the yellow river delta using random forest. Remote Sensing, 11(10), 1216–1240. https://doi.org/10.3390/rs11101216
- Li, C. C., Wang, J., Wang, L. Z., Hu, L. Y., & Gong, P. (2014). Comparison of classification algorithms and training sample sizes in urban land classification with Landsat thematic mapper imagery. Remote Sensing, 6(2), 964–983. https://doi.org/10.3390/rs6020964
- Mahdianpari, M., Salehi, B., Mohammadimanesh, F., Homayouni, S., & Gill, E. (2018). The first wetland inventory map of newfoundland at a spatial resolution of 10 m using Sentinel-1 and Sentinel-2 data on the google earth engine cloud computing platform. Remote Sensing, 11(1), 43–70. https://doi.org/10.3390/rs11010043
- Ma, M., Liu, J., Liu, M., Zeng, J., & Li, Y. (2021). Tree species classification based on Sentinel-2 imagery and random forest classifier in the eastern regions of the qilian mountains. Forests, 12(12), 1736. https://doi.org/10.3390/f12121736
- Maxwell, A. E., Strager, M. P., Warner, T. A., Ramezan, C. A., Morgan, A. N., & Pauley, C. E. (2019). Large-area, high spatial resolution land cover mapping using random forests, GEOBIA, and NAIP Orthophotography: Findings and recommendations. Remote Sensing, 11(12), 1409–1436. https://doi.org/10.3390/rs11121409
- Millard, K., & Richardson, M. (2015). On the importance of training data sample selection in random forest image classification: A case study in peatland ecosystem mapping. Remote Sensing, 7(7), 8489–8515. https://doi.org/10.3390/rs70708489
- Na, X., Zhang, S., Li, X., Yu, H., & Liu, C. (2010). Improved land cover mapping using random forests Combined with Landsat Thematic Mapper Imagery and Ancillary Geographic Data. Photogrammetric Engineering & Remote Sensing, 76(7), 833–840. https://doi.org/10.14358/PERS.76.7.833
- Norovsuren, B., Renchin, T., Tseveen, B., Yangiv, A., & Altanchimeg, T. (2019). Estimation of Forest Coverage in Northern Region of Mongolia Using Sentinel and Landsat Data. The International Archives of the Photogrammetry, Remote Sensing and Spatial Information Sciences, XLII-5/W3, 71–76. https://doi.org/10.5194/isprs-archives-XLII-5-W3-71-2019
- Ottosen, T. B., Petch, G., Hanson, M., & Skjoth, C. A. (2020). Tree cover mapping based on Sentinel-2 images demonstrate high thematic accuracy in Europe. International Journal of Applied Earth Observations & Geoinformation, 84, 101947. https://doi.org/10.1016/j.jag.2019.101947
- Pelletier, C., Valero, S., Inglada, J., Champion, N., & Dedieu, G. (2016). Assessing the robustness of random forests to map land cover with high resolution satellite image time series over large areas. Remote Sensing of Environment, 187, 156–168. https://doi.org/10.1016/j.rse.2016.10.010
- Praticò, S., Solano, F., DiFazio, S., & Modica, G. (2021). Machine learning classification of Mediterranean forest habitats in google earth engine based on seasonal Sentinel-2 time-series and input image composition optimisation. Remote Sensing, 13(4), 586. https://doi.org/10.3390/rs13040586
- Pu, R., Landry, S., & Yu, Q. (2018). Assessing the potential of multi-seasonal high resolution Pléiades satellite imagery for mapping urban tree species. International Journal of Applied Earth Observation and Geoinformation, 71, 144–158. https://doi.org/10.1016/j.jag.2018.05.005
- Qin, Y., Xiao, X., Wigneron, J.-P., Ciais, P., Brandt, M., Fan, L., Li, X., Crowell, S., Wu, X., Doughty, R., Zhang, Y., Liu, F., Sitch, S., & Moore, B. (2021). Carbon loss from forest degradation exceeds that from deforestation in the Brazilian Amazon. Nature Climate Change, 11(5), 442–448. https://doi.org/10.1038/s41558-021-01026-5
- Qiu, S., He, B., Yin, C., & Liao, Z. (2017). Assessments of Sentinel-2 vegetation red-edge spectral bands for improving land cover classification. The International Archives of the Photogrammetry, Remote Sensing and Spatial Information Sciences, XLII-2/W7, 871–874. https://doi.org/10.5194/isprs-archives-XLII-2-W7-871-2017
- Rana, V. K., Venkata, S., & M, T. (2020). Performance evaluation of MLE, RF and SVM classification algorithms for watershed scale land use/land cover mapping using sentinel 2 bands. Remote Sensing Applications: Society & Environment, 19, 100351. https://doi.org/10.1016/j.rsase.2020.100351
- Rogan, J., Franklin, J., Stow, D., Miller, J., Woodcock, C. E., & Roberts, D. (2008). Mapping land-cover modifications over large areas: A comparison of machine learning algorithms. Remote Sensing of Environment, 112(5), 2272–2283. https://doi.org/10.1016/j.rse.2007.10.004
- Rouse, J. W., Haas, R. H., Schell, J. A., & Deering, D. W. (1974). Monitoring vegetation systems in the great plains with erts. Third Earth Resources Technology Satellite-1 Symposium (pp. 309–317). https://ntrs.nasa.gov/citations/19740022614
- Senf, C., Laštovička, J., Okujeni, A., Heurich, M., & van der Linden, S. (2020). A generalized regression-based unmixing model for mapping forest cover fractions throughout three decades of Landsat data. Remote Sensing of Environment, 240, 111691. https://doi.org/10.1016/j.rse.2020.111691
- Shamsoddini, A., & Raval, S. (2018). Mapping red edge-based vegetation health indicators using Landsat TM data for Australian native vegetation cover. Earth Science Informatics, 11(4), 545–552. https://doi.org/10.1007/s12145-018-0347-5
- Shao, Y., & Lunetta, R. S. (2012). Comparison of support vector machine, neural network, and CART algorithms for the land-cover classification using limited training data points. ISPRS Journal of Photogrammetry and Remote Sensing, 70, 78–87. https://doi.org/10.1016/j.isprsjprs.2012.04.001
- Shi, D., & Yang, X. J. (2015). Support Vector Machines for Land Cover Mapping from Remote Sensor Imagery. In Monitoring and Modeling of Global Changes: A Geomatics Perspective (pp. 265–279). Springer, Dordrecht. https://doi.org/10.1007/978-94-017-9813-6_13
- Shi, D., & Yang, X. J. (2017). A relative evaluation of random forests for land cover mapping in an urban area. Photogrammetric Engineering & Remote Sensing, 83(8), 541–552. https://doi.org/10.14358/pers.83.8.541
- Son, N.-T., Chen, C.-F., & Chen, C.-R. (2017). Mapping mangrove density from rapideye data in Central America. Open Geosciences, 9(1), 211–220. https://doi.org/10.1515/geo-2017-0018
- Su, Y., Li, X., Feng, M., Nian, Y., Huang, L., Xie, T., Zhang, K., Chen, F., Huang, W., Chen, J., & Chen, F. (2021). High agricultural water consumption led to the continued shrinkage of the Aral Sea during 1992-2015. Science of the Total Environment, 777, 145993. https://doi.org/10.1016/j.scitotenv.2021.145993
- Sun, S. B., Zhang, Y. G., Song, Z. L., Chen, B. Z., Zhang, Y. J., Yuan, W. P., Chen, C., Chen, W., Ran, X. B., & Wang, Y. D. (2020). Mapping coastal wetlands of the bohai rim at a spatial resolution of 10 m using multiple open-access satellite data and terrain indices. Remote Sensing, 12(24), 4114–4140. https://doi.org/10.3390/rs12244114
- Szostak, M., Hawryło, P., & Piela, D. (2017). Using of Sentinel-2 images for automation of the forest succession detection. European Journal of Remote Sensing, 51(1), 142–149. https://doi.org/10.1080/22797254.2017.1412272
- Talukdar, S., Singha, P., Mahato, S., Shahfahad Pal, S., Liou, Y., & Rahman, A. (2020). Land-use land-cover classification by machine learning classifiers for satellite observations—a review. Remote Sensing, 12(7), 1135–1159. https://doi.org/10.3390/rs12071135
- Tariq, A., & Mumtaz, F. (2022). Modeling spatio‑temporal assessment of land use land cover of Lahore and its impact on land surface temperature using multi‑spectral remote sensing data. Environmental Science and Pollution Research, 1–17. https://doi.org/10.1007/s11356-022-23928-3
- Tariq, A., Mumtaz, F., Majeed, M., & Zeng, X. (2022). Spatio‑temporal assessment of land use land cover based on trajectories and cellular automata Markov modelling and its impact on land surface temperature of Lahore district Pakistan. Environmental Monitoring and Assessment, 195(1), 114. https://doi.org/10.1007/s10661-022-10738-w
- Tariq, A., Mumtaz, F., Zeng, X., Baloch, M. Y. J., & Moazzam, M. F. U. (2022). Spatio-temporal variation of seasonal heat islands mapping of Pakistan during 2000–2019, using day-time and night-time land surface temperatures MODIS and meteorological stations data. Remote Sensing Applications: Society & Environment, 27, 100779. https://doi.org/10.1016/j.rsase.2022.100779
- Tariq, A., Yan, J., & Mumtaz, F. (2022). Land change modeler and CA-Markov chain analysis for land use land cover change using satellite data of Peshawar, Pakistan. Physics and Chemistry of the Earth, Parts A/B/C, 128, 103286. https://doi.org/10.1016/j.pce.2022.103286
- Teluguntla, P., Thenkabail, P. S., Oliphant, A., Xiong, J., Gumma, M. K., Congalton, R. G., Yadav, K., & Huete, A. (2018). A 30-m Landsat-derived cropland extent product of Australia and China using random forest machine learning algorithm on Google Earth Engine cloud computing platform. ISPRS Journal of Photogrammetry and Remote Sensing, 144, 325–340. https://doi.org/10.1016/j.isprsjprs.2018.07.017
- Townshend, J. R., Masek, J. G., Huang, C., Vermote, E. F., Gao, F., Channan, S., Sexton, J. O., Feng, M., Narasimhan, R., Kim, D., Song, K., Song, D., Song, X.-P., Noojipady, P., Tan, B., Hansen, M. C., Li, M., & Wolfe, R. E. (2012). Global characterization and monitoring of forest cover using Landsat data: Opportunities and challenges. International Journal of Digital Earth, 5(5), 373–397. https://doi.org/10.1080/17538947.2012.713190
- Tucker, C. J., Grant, D. M., & Dykstra, J. D. (2004). NASA’s global orthorectified Landsat dataset. Photogrammetric Engineering & Remote Sensing, 70(3), 313–322. https://doi.org/10.14358/PERS.70.3.313
- Tzamtzis, I., Federici, S., & Hanle, L. (2019). a methodological approach for a consistent and accurate land representation using the FAO open foris collect earth tool for GHG Inventories. Carbon Management, 10(4), 437–450. https://doi.org/10.1080/17583004.2019.1634934
- Ustuner, M., Sanli, F. B., Abdikan, S., Esetlili, M. T., & Kurucu, Y. (2014). Crop type classification using vegetation indices of rapideye imagery. The International Archives of the Photogrammetry, Remote Sensing and Spatial Information Sciences, 40(7), 195–198. https://doi.org/10.5194/isprsarchives-XL-7-195-2014
- Wang, Y., Liu, H., Sang, L., & Wang, J. (2022). Characterizing forest cover and landscape pattern using multi-source remote sensing data with ensemble learning. Remote Sensing, 14(21), 5470. https://doi.org/10.3390/rs14215470/
- Wang, Y., Lu, Z., Sheng, Y., & Zhou, Y. (2020). Remote sensing applications in monitoring of protected areas. Remote Sensing, 12(9), 1370. https://doi.org/10.3390/rs12091370
- Wang, Z. H., Song, W., Liang, S. L., Sun, J. Q., Xu, S. J., & Huang, D. M. (2017). Accuracy assessment model for classification result of remote sensing image based on spatial sampling. Journal of Applied Remote Sensing, 11(4), 046023–046023. https://doi.org/10.1117/1.Jrs.11.046023
- Yang, Y., Yang, D., Wang, X. F., Zhang, Z., & Nawaz, Z. (2021). Testing accuracy of land cover classification algorithms in the qilian mountains based on GEe cloud platform. Remote Sensing, 13(24), 5064–5089. https://doi.org/10.3390/rs13245064/
- Yang, Y., Yang, D., Wang, X., Zhang, Z., & Nawaz, Z. (2021). Testing accuracy of land cover classification algorithms in the qilian mountains based on GEE cloud platform. Remote Sensing, 13(24), 5064. https://doi.org/10.3390/rs13245064
- Zhu, Z., Woodcock, C., Rogan, J., & Kellndorfer, J. (2012). Assessment of spectral, polarimetric, temporal, and spatial dimensions for urban and peri-urban land cover classification using Landsat and SAR data. Remote Sensing of Environment, 117, 72–82. https://doi.org/10.1016/j.rse.2011.07.020