
 ?Mathematical formulae have been encoded as MathML and are displayed in this HTML version using MathJax in order to improve their display. Uncheck the box to turn MathJax off. This feature requires Javascript. Click on a formula to zoom.
ABSTRACT
This study examines the spatiotemporal variability and trends of rainfall in the central highlands of Abbay Basin using the Integrated Multi-satellite Retrievals for GPM (IMERG-06) dataset. Parameters on onset and cessation dates, dry spells, Coefficient of Variation (CV%), and Standardized Rainfall Anomalies were utilized to evaluate rainfall variability and seasonality. Trend analysis was carried out using Mann-Kendall test and Sen’s slope estimator. The results highlighted a consistent pattern of late onset and early cessation of rainfall. The CV values for annual (10.7%), kiremt (11.7%), and belg (10.6%) seasons rainfall indicate moderate variability, while bega (22.6%) rainfall showed higher variability. SRA findings reveal episodic fluctuations between wet and dry years. The trend analysis demonstrates a statistically significant increasing trend in annual (9.14 mm/year) and belg seasons (6.94 mm/year) rainfall. However, kiremt season exhibited statistically non-significant (p > 0.05) decreasing trend. The temporal variability in rainfall onset, cessation dates and duration significantly impacts agricultural processes such as tillage and planting operations, affecting crop production. While the study area holds potential for agricultural activities, climate variability may reduce productivity. Therefore, the study findings are valuable for agricultural developers, planners and water resource managers. Including additional weather elements is crucial to enhance the precision and reliability of these findings for practical applications.
Introduction
Climate change and variability are real, rapidly advancing and widespread threats that the earth is facing (Adeoti et al., Citation2016). For example, (IPCC, Citation2022) stated that the global surface temperatures have increased by approximately 1.1°C since the pre-industrial era and 1.5°C above pre-industrial era. Global sea levels have risen by about 15 cm during the 20th century, and the rate of rise has increased in recent decades (IPCC, Citation2019). There have been shifts in rainfall patterns, including increased rainfall in some regions and decreased in others (IPCC, Citation2014). Further, climate change has altered annual and seasonal features of rainfall along with its spatial distribution (Banerjee et al., Citation2020).
In Africa, precipitation variability is expected to increase, while precipitation is likely to decrease over most regions of sub-Saharan Africa (Nicholson, Citation2017). According to Banerjee et al. (Citation2024), average land surface temperature increased by 0.01°C/year along with decreasing rainfall 1.89 mm/year. However, this system in sub-Saharan Africa is a risky proposition due to its low and irregular rainfall and exposure to long periods of drought (Tadesse et al., Citation2014). In most part of Ethiopia in the middle of the 21st century, temperature will increase greater than 1°C and annual rainfall will increase (in central highlands, southern, southwestern parts of the country, in Afar, Ogaden and Danakil depression), whereas rainfall will decrease in south in Negele area. Although annual precipitation over Ethiopia will increase in the middle of the 21st century, it will decrease during the main rainy season of June, July and August (Tamiru, Citation2020).
Agriculture is ranked as the most susceptible sector to climate variability impacts and so do the livelihoods of subsistence farmers and pastoralists (Sherbinin et al., Citation2008). This sector is the backbone of the Ethiopian economy, providing livelihoods for millions of people and playing a crucial role in poverty reduction (ATA) (https://www.ata.gov.et/about/accessed on December 21/2023. It employs over 70% of Ethiopia’s population and contributes around 35% to the country’s GDP (Dube et al., Citation2019; Yurdakul & Kamasak, Citation2020) and 85% of export revenue (Berhane et al., Citation2018). Climate variability, including increased temperature and changes in rainfall patterns, negatively affects crop yield in Ethiopia. In addition, the temporal distribution of rainfall during the growing season has an important influence on crop yield and can induce food shortage and famine (Araro et al., Citation2019; Bewket & Conway, Citation2007).
Temperature and rainfall records from meteorological stations show a significant warming trend and changes in rainfall patterns over the past few decades. For example, a study by (Zewdu et al., Citation2019) found a consistent increase in temperature. While (Bewket & Conway, Citation2007) found a decrease in total annual rainfall in parts of the Amhara region over a 40-year period. In addition, Ayalew et al. (Citation2012b) showed that the onset date of the growing season has been undergoing a little shift, whereas the end date of the rain is noted to be shortened in most of the areas found in the Amhara region. The maximum temperature during the Kiremt season varies between 0.4 and 0.6°C decade−1, and the belg season temperatures show more rapid increase greater than 0.6°C decade−1 (Addisu et al., Citation2015).
Characterization of the spatiotemporal variability of meteorological elements is a prerequisite for a better understanding of the climate at regional and local scales (Asfaw et al., Citation2018; Gebrechorkos et al., Citation2019). Gauge-based rainfall measurement is tangible, direct and accurate. However, installing a dense gauge-based network to capture rainfall variability can be impractical (Dinku et al., Citation2018). Due to this, most of the time, gauge-based data are inadequate and incomplete (Kaspar et al., Citation2022). Satellite-based rainfall estimates could be a good alternative, where gauge-based observed rainfall data are not available or inconsistent (Banerjee et al., Citation2020; Wedajo et al., Citation2021). Huffman et al. (Citation2020) suggested that the combination of microwave and infrared climate estimates can be a helpful approach that resulted from a high-resolution satellite precipitation algorithm.
A number of studies were conducted on the spatiotemporal variability of climate, for instance; Alemu and Bawoke (Citation2020), Ayalew et al. (Citation2012a), Ayalew et al. (Citation2012b), Bewket and Conway (Citation2007), Mengistu et al. (Citation2014), Legese et al. (Citation2016), Yohannes et al. (Citation2017), M. Teshome (Citation2017), Weldegerima et al. (Citation2018), Mebratu and Prem (Citation2020), Abeje et al. (Citation2019), Addisu et al. (Citation2015), Arragaw and Woldeamlak (Citation2017), Gebrehiwot and Van (Citation2013), Kassie et al. (Citation2014), Senbeta and Olsson (Citation2009). Most of these studies reported that the climate system of most of their study areas showed change and variability in the form of increasing temperature and insignificant but decreasing trends of rainfall. For example, the study made by Asfaw et al. (Citation2018) showed statistically significant trends of declining annual and kiremt rainfall while the belg rainfall did not show a significant declining trend. Furthermore, they have also observed that there was intra- and inter-annual variability of rainfall in northcentral Ethiopia. Similar results indicated a decreasing, but insignificant trend for annual and seasonal (kiremt and belg) rainfall was noted by (Ayalew et al., Citation2012b; Bewket, Citation2009; Bewket & Conway, Citation2007; Rosell & Holmer, Citation2007). In contrast, Mengistu et al. (Citation2014) reported increasing but statistically insignificant trends of the annual total, summer, autumn and winter rainfall, over the Upper Blue Nile river basin. The majority of these authors mentioned above used meteorological gauge-based and some of them used blended data for analyzing the climate system of their study areas.
While previous studies have reported changes/variability in temperature and rainfall, there was a need to conduct a detail and site-specific analysis focused on the spatiotemporal variability and trends of rainfall using satellite-based rainfall dataset, i.e. the Integrated Multi-satellitE Retrievals for GPM (IMER-06). This study provided more accurate and current assessment of the rainfall features that may have occurred in recent years for people where their livelihood depends on rainfed agriculture. Therefore, the key objectives of this study were to analyze the spatiotemporal variability and to examine the trend of rainfall over west Gojjam zone, central highlands of Abbay Basin, using the satellite-based datasets GPM (IMERG-06) for 2001–2020.
Materials and methods
Description of the study area
This study was carried out in west Gojjam zone, which is located between 10°16′ to 11°54′ Latitude and 36°31′ to 37°57′ Longitude in the central highlands of Abbay Basin (). West Gojjam zone has a total area of 13,311.9 Km2 and the lowest and the highest peaks of the area are 684 and 3592 m a.s.l, respectively (Csa, Citation2017).
Figure 1. Location and agroecological map (a), mean monthly rainfall, minimum, and maximum temperatures (b) of west Gojjam zone, central highlands of Abbay Basin, Ethiopia.
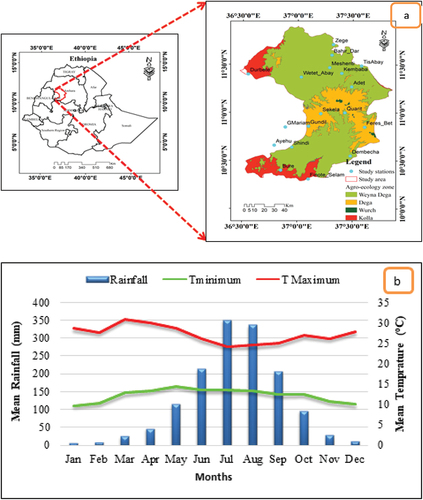
Based on altitude, west Gojjam has four climatic zones known as Wurch, Dega, Weyna Dega and Kolla. Wurch (upper highlands) has a type of alpine climate (Weldegerima et al., Citation2023). The annual average temperature is less than 11°C. Annual rainfall is between 900 and 2,200 mm/yr, the zone exists at altitudes more than 3200 m (m) above mean sea level (amsl). Dega (highlands) is also known as the alpine vegetated climate. The annual rainfall is between 900 and 1,200 mm/yr. This zone is a coldish less than temperate zone with altitudes ranging between 2,300 and 3200 m amsl. Weyna Dega (midlands) or the temperate zone ranges between 1500 m and 2300 m in elevation. Annual rainfall lies in between 800 and 1,200 mm/yr. Temperature ranges between 16 and 20°C, and Kolla (lowlands) looks like the hot zone. It is much drier and warmer than the Weyna Dega zone. This zone received annual rainfall of less than 800 mm/y. This zone elevated between 500 and 1,500 m amsl (). Based on 30 years of temperature and rainfall records of National Meteorological Agency of Ethiopia, the average minimum and maximum temperature of the zone was 11.2°C and 25.9°C, respectively. The mean annual rainfall varies in between 1248.4 mm (2002) and 1699.7 mm (2017), mean annual and kiremt season rainfall of the area were 1365 mm and 997 mm, respectively (NMA, Citation2020). According to the population projection of Ethiopia, west Gojjam zone has a total population of 2,542,221, of which 2,220,038 people lived in rural areas (Csa, Citation2017). The majority of the population is living in rural kebeles engaged in rainfed agricultural activities. It is the main source of livelihood for this community (Gebreegziabher et al., Citation2016). This zone has different agroecologies and played a pivotal role for the agricultural activities, there by contributing a significant role for the country’s economy. However, as the activity mainly depends on rainfed, the patterns and variability of rainfall influences the sector, may lead to severe droughts in some places and water logging in others (Zeleke et al., Citation2023).
The study area has three distinct seasons, each season comprises of 4 months. For example, kiremt season includes, June, July, August and September; bega season has October, November, December and January; and belg season months are February, March, April and May (Abebe, Citation2006; Segele et al., Citation2015; Wbg, Citation2021). According to Omay et al. (Citation2023), the main producing period of this area is Kiremt season ().
Data sources
Meteorological station data
Daily rainfall data were collected from 15 gauge-based stations over the period of 2001– 2020 from the National Meteorological Services Agency of Ethiopia to validate the data extracted from the satellite-based datasets (Taye et al., Citation2023).
IMERG-06 satellite data
The Integrated Multi-satellite Retrieval for GPM (IMERG-06) product combines precipitation observations using infrared and microwave sensors from a constellation of partner satellites, united by the GPM Core Observatory, to provide near real-time half-hourly precipitation estimates at 0.1 degree resolution for the entire globe; https://gpm.nasa.gov/data/imerg accessed 2/1/2023, (Huffman et al., Citation2020; Sharma et al., Citation2020). The product Integrated Multi-satellitE Retrieval, IMERG-06 final daily time step rainfall, was extracted the point-pixel data as per the station locations (Taye et al., Citation2023). The data available on IMERG-06 dataset begin from 2001.
Methods of data analysis
Validation of IMERG-06 rainfall dataset
Temporally and spatially direct, consistent and long-term ground-based observed rainfall data are generally accurate near the sensor location and important (Behrangi et al., Citation2011; Nguyen et al., Citation2019). However, the observed rainfall data are usually lacking of such quality and are subjected to missing data, this may be inconsistent distribution of meteorological station, limited number of meteorological station in the region, and interruption of data recording by different reasons (Githungo et al., Citation2016; Kaspar et al., Citation2022; Kidd et al., Citation2012; Maggioni et al., Citation2016; Sisay et al., Citation2017).
The performance of IMERG-06 was evaluated quantitatively against the reference rain gauge observation data using categorical and continuous statistical techniques. The categorical techniques, such as Probability of detection (POD), False alarm ratio (FAR), Critical Success Index (CSI), and Accuracy, were employed to evaluate the detection performance of the data set. Further, the estimation capacity of the data set was assessed using continuous statistical techniques like bias ratio, Relative bias, Mean Absolute Error (MAE), Root Mean Square Error (RMSE), and Correlation Coefficient (CC) indices (Taye et al., Citation2023).
Spatiotemporal variability
Characteristics of rainfall features
Onset, and cessation date, duration and dry-spell length of rainfall
Characterizing rainfall features in terms of the starting date, and the cessation date of rainfall, the length of rainy season and dry-spell length in main rainy season is too important, especially for areas where their economic activities highly rely on rain-fed agriculture. The main rainy season of the study area is kiremt (Gummadi et al., Citation2018) and .
Daily rainfall data were subjected to a detailed analyses using several sequences of statistical packages. For instance, the satellite data were analyzed with respect to the onset, cessation date, duration and dry-spell length of rainfall in kiremt season via R-Instat 0.7.3.1 (Roger et al., Citation2021). The outset, the Box and Whiskers plotting techniques were used for examination and visual illustration of inter-annual spread of the rainfall series with respect to the onset date, cessation date and duration of the main wet season rainfall (Banacos, Citation2011).
The onset date is the first day of the year when the dataset record 20 mm of total rainfall for at least for three consecutive days that were not followed by eight or more days of dry days (<0.1 mm day−1) in subsequent 30 days (Segele & Lamb, Citation2005). On the other hand, the cessation date of the rainy season is defined basically as the first day of a dry spell (0.1 mm day−1) at least 20 days duration after the occurrence of onset and the soil water reaches zero (Segele & Lamb, Citation2005; Stern & Coe, Citation1982). In addition, length of the rainy season is an important factor in determining the maturity of crops/seeds grown under different conditions (Bogale, Citation2023). Length of the rainy season was calculated by taking the differences between the cessation date of rainfall and onset date of rainfall at a given period of time (Mupangwa et al., Citation2011). Dry-spell length represents number of consecutive days without rainfall during kiremt season (Kebede et al., Citation2017). A dry spell is a period of 3 or more days of lack of rainfall during the wet season (Sanchi et al., Citation2021). The occurrences of dry spells within the kiremt season were identified for a threshold of less than 0.85/1 mm−d within the season’s months (Abebe, Citation2006).
Pattern of rainfall
From daily rainfall data, monthly, seasonal and annual averages were derived. To summarize the data, descriptive statistics such as mean, Coefficient of variation (CV%), standard deviation (SD) and percentage rainfall contribution of seasons for the annual total were calculated. In addition, general linear model was employed to check rainfall variation between study stations, and within study years was either significant or not. Finally, the spatial distribution of annual, kiremt, bega and belg rainfall was visually illustrated using ArcGIS 10.6.
Coefficient of variation (CV%)
The coefficient of variation (CV) was calculated to evaluate the extent of spatial and temporal variability of mean annual and seasonal (kiremt, bega and belg) rainfall for each station. Coefficient of variation less than 20%, between 20 and 30% and greater than 30% indicate lower, moderate and higher variability of rainfall, respectively (Hare, Citation2003). It is computed as:
where CV is the coefficient of variation of rainfall, is the standard deviation of rainfall, and
is the mean of rainfall over the year of observations (2001–2020).
Standardized rainfall anomaly
The Standardized Rainfall Anomalies (SRA) were calculated and graphically presented to evaluate the inter-annual fluctuations of rainfall in the study area over the year of observations (2001–2020). The positive values represent periods of above-normal rainfall/wet years from the long-term mean while the negative values reflect below-normal rain/dry years (Muthoni et al., Citation2019). The SRA was calculated according to Agnew and Chappell (Citation1999):
where SRA is standardized rainfall anomaly, Pt is an annual rainfall in year t, Pm is long-term mean annual rainfall over a period of observation and σ is the standard deviation of annual rainfall over the period of observation.
Trend analysis of rainfall
Mann-Kendall test
Unlike parametric methods, non-parametric tests are more flexible as they do not depend on normally distributed time series data (Gilbert, Citation1987). Mann-Kendall (MK) test, one of the non-parametric method, and Sen’s slope estimates were employed to examine the temporal trend and magnitude of annual and seasonal rainfall, respectively. The MK test uses the correlation between the ranks of a time series and their sequence. It computes the difference between the later measured values and all early measured values for a time series of interest over time (Kendall, Citation1938). When a data value from a later time period is higher than a data value from an earlier time period, the MK test statistic S is incremented by 1. On the other hand, if the data value from a later time period is lower than a data value sampled earlier, S is decremented by 1. The MK statistics S is computed as:
where S is Mann-Kendall’s test statistics, Xi and Xj are the sequential data values of the time series in the years i and j (j > i), and N is the length of the time series. A positive S value indicates an increasing trend and a negative value indicated a decreasing trend in the data series.
where Xi and Xj are sequential data values for the time series data of length N;
For samples, N ≥ 10, the S statistic is approximately normally distributed and the mean of S is zero, and the variance of S is given as:
where N is the number of observations in the time series, m is the number of tied groups, and ti is the number of observations in the ith group.
The significance of a trend is computed by the Z sore using;
When the Z value exceeds either of the confidence limit lines, it shows a significant trend at a given significance level. Hence, the null hypothesis (Ho) is rejected and in place, the alternative hypothesis (H1) is accepted (Mann, Citation1945).
Sen s estimator of slope
Sen s slope estimator (Sen, Citation1968) is employed to estimate the magnitude of the trends in time series data. If a linear trend exists in a time series, then the true slope of the trend is estimated using a Sen-Theil trend line (Sen, Citation1968; Theil, Citation1950), an alternative to linear regression, in combination with the MK test. The slope (Ti) of all data sets is computed as:
, for i = 1, 2, 3 … N
where Xi and Xk are taken as data values at time j and k (j > k), respectively. The median of these N values of Ti is denoted as Sen s estimator of slope, which is expressed as:
where Qi indicates the β value of the slope estimator in Sen s slope method. A positive value of Qi suggests an increasing trend and a negative value of Qi offers a decreasing trend in the time series.
Results and discussion
Validation result
The result indicated that IMERG-06 had better detection and estimation capacity. As it was clearly stated by Hartke and Wright (Citation2022), indirect precipitation measurements of satellite products experience uncertainty and retrieval conditions. However, IMERG-06 has comparable performance in precipitation detection to gauge-based data at very low gauge densities. For the daily time scale, the value of POD and FAR, IMERG-06 had 0.73 and 0.31 values, respectively. During the kiremt season, IMERG-06 had a POD value of 0.82 and 0.18 FAR. On the other hand, the estimation performance of this data set at the daily time scale was equivalent to (r ∼0.8). In addition, in terms of RMSE, IMERG-06 provides relatively lower error, with the values for both daily (50.3 mm) and kiremt season (75.9 mm) than others and MAE (7.7 mm) rainfall for daily time scale (Taye et al., Citation2023). Furthermore, results of similar studies (Khodadoust Siuki et al., Citation2017; Wedajo et al., Citation2021) showed the same concept as IMERG-06 had a reasonable agreement with the gauge-based data and could be a reliable rainfall data source for climate analysis.
Spatiotemporal variation of rainfall
Characteristics of rainfall features
show the variability of the onset date, cessation date and duration of rainfall in each study station. The mean onset date of west Gojjam was 142 (22-May) day of the year (DOY) (). The mean onset date in the study stations ranged from 132 (12, May) at Gundil to 166 (15, June) at Finoteselam DOY. In addition, the mean onset date of most of the study stations exhibited spatial variation (). On the other hand, mean onset date of the year; 2001 (139), 2005 (138), 2008 (131), 2010 (133), 2014 (135), 2015 (136), 2016 (130), 2017 (134) and 2020 (134 DOY) was slightly similar and early compared with mean onset date of the study zone. While during 2002 (159), 2003 (162), 2004 (157) and 2009 (160 DOY) and were late ().
Figure 2. Box and whisker plots for onset date (a), cessation date (b), and length the rainy season (c) in west Gojjam zone, central highlands of Abbay Basin (2001–2020).
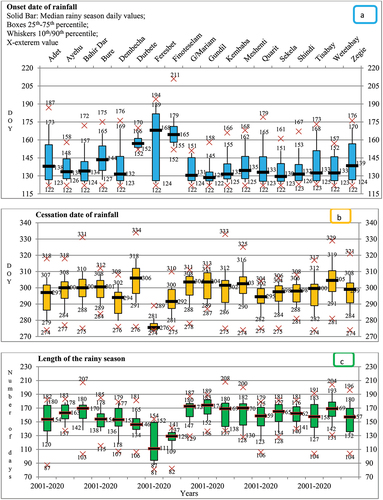
Table 1. Mean onset, cessation date, length of the rainy season and dry-spell length for study stations (2001–2020).
Table 2. Mean onset date, cessation date, length of the rainy season and total rainfall of main rainy season (2001–2020) in west Gojjam zone, central highlands of Abay Basin.
Mainly the onset date of rain in 2003 and 2009 was relatively too late for almost all stations: such as the onset dates of Adet, Bahir Dar, Durbete, Feresbet, Tisabay and Zegie were 176 and 187; 157 and 172; 157 and 170; 175 and 184; 168 and 170; and 159 and 170 DOY, respectively (). Except for Durbete and Finoteselam, the lower extreme of the onset date of the study station was 122, early onset of rain, while the upper extreme of onset date, late onset of rain, of Finoteselam was 211 in 2015, Feresbet (194) in 2002, Adet (187) in 2009, Quarit (179) in 2003 (). The 10th, 25th, median, 75th, and 90th percentile of the box and whisker plots indicated that Gundil had early onset date, i.e. 122 DOY, among the study stations. While 25th and 10th percentiles of Finoteselam, median, 75th and 90th percentile of Feresbet exhibited late onset date, 158, 155 and 168, 189 and 182 DOY, respectively, than the others ( and Appendix 1). The delayed rainfall onset in those years may be due to large-scale climate drivers like El Niño events or other teleconnection patterns affecting precipitation timing and distribution in the region. Research by (Wang & Zhou, Citation2008) highlights ENSO’s impact on East Africa’s rainfall patterns, leading to delayed or reduced precipitation in certain years. (Mason & Goddard, Citation2001) have also shown how the IOD can influence rainfall variability in the Horn of Africa, potentially delaying the start of the rainy season.
The findings of the present study are in line with the study by (Kebede et al., Citation2017; Markos et al., Citation2023), which showed that the mean onsets of the rainy season for the majority of study stations occur during the third meteorological decade of May. The above analysis of onset date indicated variation through all observation years in all study stations. While this study result in contrast with Omay et al. (Citation2023), who stated that the kiremt season recorded widespread decrease in onset date variability over most parts of highlands of central and northern Ethiopia, this might be due to the difference in topographical and vegetation cover. The temporal variability of onset date of rainfall has an impact on all agricultural processes including tillage and planting operations, which in turn affect crop production (Wakjira et al., Citation2021). Therefore, information about the start of the rains is too crucial for appropriate agricultural decision making and reduction in yield of the crops is avoided by taking appropriate action (Abebe, Citation2006).
portrays that the mean cessation date of rainfall of the study stations ranged from 277 (4,October) at Feresbet to 305 (1,November) DOY at Wetetabay. The mean cessation date of the study zone was 297 (24,October) DOY (). In addition, the cessation date of the study area showed spatial and temporal variation (). The boxes and whiskers at 25th, 10th, median, 75th, and 90th percentiles indicated that rainfall terminated relatively too early at Feresbet compared with the remaining stations. While Wetetabay showed relatively better at 25th and 90th percentiles, and Durbete exibited 10th and 75th percentiles of relatively better termination day among the study stations ( and Appendix 1). The result of the study indicated that the rainy season of the study zone, i.e. 297 DOY, was terminated early relative to the 308 DOY that used to cease in most part of the Amhara region (Ayalew et al., Citation2012b).
The result of the study is in line with the results of Taye et al. (Citation2013) who revealed that the mean cessation date of rainfall in western Amhara region which was between 266 to 304 DOY during their study period between 1979 and 2008. Too early cessation of rainfall was found in Feresbet station for almost all study years, i.e. mean cessation date was 276 DOY (3, October) (). This station cessation date of rainfall was similar to stations studied by Kebede et al. (Citation2017) in the Upper Baro-Akobo, Ethiopia. On the other hand, too late cessation of rainfall was observed in Kembaba 333 DOY (29,November) during 2006 (Fig ure 2b). This is ascertain by the study of Omay et al. (Citation2023) who stated that the study years 2011–2020 showed delay of 7–14 days in mean cessation dates over central and northwestern Ethiopia. The study of Segele and Lamb (Citation2005) revealed that the tendency for delayed cessation for some station may be due to orographic effects.
The result of present study showed that the mean rainfall duration of the study stations ranged in between 119 and 170 days. From studied stations, Feresbet had the least duration (<120 days) of rainfall, whereas Gundil had the maximum duration of rainfall, i.e. 170 days (). The majority of studied stations had long-duration of rainfall during main rainy season, i.e. >150 days (except, Feresbet and Finote selam) (). The boxes and whiskers illustrated the variation of length of the rainy season, for example, short duration of rainfall recorded at Feresbet for 25th and 10th percentiles including median and at Finoteselam for 90th and 75th percentiles. Whereas Gundil had better length of the rainy season for 25th, 10th percentiles and for the median and Wetetabay was relatively best for 90th and 75th percentiles than others ( and Appendix 1). This study result agreed with the findings of Ayalew et al. (Citation2012b), Taye et al. (Citation2013), and Omay et al. (Citation2023) the majority of their study areas had long-duration of rainfall in the Amhara region and western Ethiopia. This as explained by Tarkegn and Jury (Citation2020) is due to the earlier arrival and later departure of rains. The shortest duration of rainfall was observed in Feresbet in contrast to the findings of Gummadi et al. (Citation2018) who studied the spatiotemporal variability and trends of precipitation and extreme rainfall events in Ethiopia from 1980 to 2010 and stated that the duration of the rainy season in the highland was high. In general, the 10th −90th and 25th-75th percentiles of the box and whisker plots indicated the presence of spatiotemporal variation of onset, cessation date and length of the rainy season among stations over the study period ( and appendix 1).
The mean of study stations dry-spell length varies in between 6 and 31 days. According to Froidurot and Diedhiou (Citation2017) and Gong et al. (Citation2005), the dry-spells with less than 10 days referred as short dry-spell while the long dry-spells refer to the other. The shortest dry-spell length was found in Gundil and followed by Durbete and Wetetabay, whereas Feresbet recorded the longest dry-spell length, i.e. 31 days. Adet, Dembecha, Kembaba, Quarit, Tisabay and Zegie had almost the same length of the dry-spell (). This is similar with the study of Segele and Lamb (Citation2005) who stated that central and western Ethiopia have the shortest dry-spells. Linear regression were used to estimate the temporal trend of the series for each station. The visual inspection () indicated a clear increasing and decreasing trend, for example the trend line of dry-spell at Adet, Ayehu, Bure, Durbete, Finoteselam, G/Mariam and Shindi have indicated decreasing trend. While Bahir Dar, Kembaba, Meshenti, Sekela and Tisabay showed increasing trend. From the ternd lines, it has been noticed that the change is not significant. Further, study stations with short dry-spell length had less R2 value. This indicated no trend of dry-spell length over the study period, such as, Wetetabay and Gundil. Similarly, the mean result indicated that dry-spell length over west Gojjam zone, central highlands of Abbay Basine showed almost no trend over the period of analysis (). On the other hand, Adet (12), Dembecha (10), Feresbet (31), Kembaba (10), Quarit (11), Tisabay (12) and Zegie (10) had long dry spells (). Long dry-spells have a strong influence on agriculture and increasing the occurrence of drought (Gong et al., Citation2005; Huth et al., Citation2000). Sanchi et al. (Citation2021), also emphasized that dry-spell threatens agricultural productions and undermining the economic development of rural farmers.
Figure 3. Dry-spell length for all study stations (a) and, west Gojjam zone (b) (2001–2020).
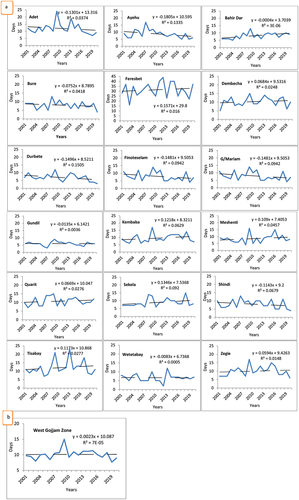
In general, from the Dega agroecological zone, Feresbet had late onset, early cessation dates, and long dry-spell length, June 7, October 4 and 31 days, respectively, than Sekela and other Weyna Dega agro ecological zones. Among Weyna Dega agroecological zones Finoteselam, and Durbete had late onset dates and Adet had long dry-spell length ( and ).
Pattern of rainfall
The results of the study revealed the temporal and spatial features of rainfall. The mean annual rainfall of study stations ranged in between 1029 mm rainfall at Feresbet and 1605 mm rainfall at Wetetabay (). On the other hand, mean of kiremt season rainfall for the study years (2001–2020) was ranged in between 765 mm rainfall in 2015 and 1195 mm rainfall in 2006. In addition, the year 2007, 2009, 2012, 2017 and 2014 received least amount of rainfall compared with the remaining study years (). This indicated that west Gojjam zone experienced spatiotemporal variation of rainfall.
Table 3. Mean annual and seasonal rainfall CV (%) and SD (mm) of all study stations, from 2001 to 2020.
West Gojjam zone received a mean annual rainfall of 1364.8 mm rainfall with a standard deviation of 146 mm rainfall. Data from IMERG-06 data set for all study stations exhibited that all stations experienced more than 1000 mm mean annual rainfall (). The mean rainfall of the kiremt season was 997 mm rainfall with a standard deviation of 115 mm, which contributed to the maximum share of the annual rainfall (73%) of the study area (). The result of the present study is in line with the study by Gummadi et al. (Citation2018), who stated that the summer season (June to September) contributed 74% of the annual rainfall for most parts of Ethiopia. On the other hand, the mean belg and bega seasons rainfall was 223 mm and 145 mm with a standard deviation of 23 mm and 33 mm, respectively. From the present study, it is 3 and 4 possible to note that belg rainfall makes a considerable contribution to the annual total; belg and bega seasons contributed 16.3% and 12.4% rainfall, respectively (). Similarly Abebe (Citation2006) and NMA (Citation2009) noted that the contribution of belg season rainfall over the north, northeastern and eastern highlands is ranging from 5% to 30%.
Table 4. The annual and seasonal MK trend analysis of rainfall in west Gojjam zone, central highlands of Abbay Basin (2001–2020).
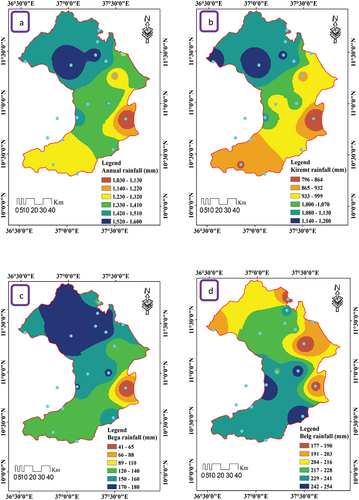
The spatial distribution of the mean annual, kiremt, bega and belg rainfall is presented in . The visual inspection of mean annual rainfall showed that the northern and northwestern parts of the study area received maximum rainfall while the southern and southeastern and western parts of the study area received relatively low rainfall (). Similarly, during kiremt and bega seasons, the highest rainfall was observed in the northern and northwestern parts of the zone (). In contrast, during the belg season southern, southeastern and western parts of the zone received the highest rainfall (). This is due to the migration of the Inter-Tropical Convergence Zone (ITCZ) and this resulted a strong inter-annual variability across the country (Wbg, Citation2021).
Figure 4. Spatial distribution of mean annual (a), kiremt (b), bega (c), and belg (d) rainfall in west Gojjam zone, central highlands of Abbay Basin (2001–2020).
Temporal variability
The temporal variability of annual and seasonal rainfall was assessed using a coefficient of variation, which showed a strong relationship with the amount of rainfall received during that specific period (). The CV of annual, kiremt, bega, and belg seasons rainfall of the study stations varied between 9 to 20%, 8 to 19%, 27 to 74%, and 30 to 45%, respectively (). The highest variation was observed in the highland (Dega agro-ecological zone) area of the study, i.e. Feresbet station. During bega and belg seasons, the variation is greater than 30% in almost all study stations. The CV of annual (11.7%), kiremt (12.6%) and belg (10.6%) rainfall revealed moderate variability, whereas CV of bega (22.6%) rainfall had higher variability in the study area (). The result of the study is in agreement with the finding of a study by Anteneh (Citation2022), who reported lower values of CV for stations and seasons with higher annual rainfall amounts than for stations with lower annual rainfall amounts.
Figure 5. Spatial distribution of (CV%) annual (a), kiremt (b), bega (c) and belg (d) rainfall in west Gojjam zone, central highlands of Abbay Basin (2001–2020).
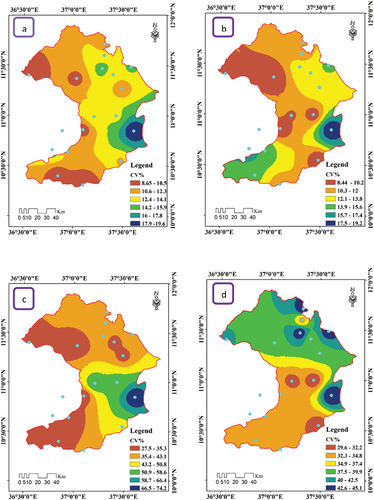
The CV values of the spatial distribution of rainfall indicated that eastern part of the study area had high variability of annual and bega season rains (). Eastern and southwestern parts of the study area had a high coefficient of variation during the kiremt season (). On the other hand, the northern part of the study area had high variability during the belg season (). As compared to annual rainfall, the bega seasonal rainfall had high variability up to 74.2% ().
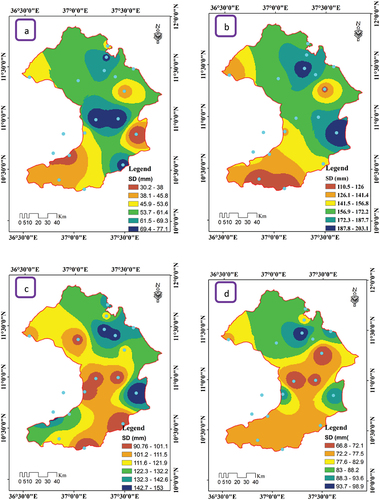
The mean deviation of annual, kiremt, bega, and belg season rainfall for each station was calculated, and the spatial distribution of the mean deviation is illustrated in . Annual rainfall indicated high deviation from the mean rainfall in the northern and, central parts of the west Gojjam zone (). Whereas northern and eastern part of the study zone exhibited high deviation from mean during kiremt season rainfall (). In addition during the bega seasons northern, northeastern and southwestern parts of the study area had high standard deviation (). Northern, eastern and western parts indicated high deviation from the belg season rainfall (). This deviation indicated the presence of spatiotemporal variation of rainfall in west Gojjam zone.
Figure 6. Spatial distribution of SD (mm) of annual (a), kiremt (b), bega (c) and belg (d) rainfall in west Gojjam zone, central highlands of Abbay Basin (2001–2020).
General linear model was employed to show the spatiotemporal variation for annual, kiremt, bega and belg seasons rainfall. The result indicated that the variation of annual, kiremt, bega and belg seasons rainfall showed stastical significance at p < 0.01. This showed the presence of substantial spatiotemporal variation of annual, kiremt, bega and belg season rainfall over the study period and in almost all study stations (Appendix 2).
Inter-annual fluctuation of rainfall
illustrates the temporal variability of rainfall in the study area from 2001 to 2020. The presence of inter-annual variability in rainfall, as indicated by standardized rainfall anomalies, can be justified by the complex interactions of various climatic factors influencing rainfall patterns. The observed percentages of positive anomalies (50%) and negative anomalies (45%) suggest significant fluctuations in rainfall amounts from year to year, reflecting the dynamic nature of the climate system. The small percentage (5%) indicating no deviation from the long-term mean annual rainfall underscores the rarity of years with rainfall amounts closely matching historical averages, further highlighting the variability inherent in rainfall patterns ().
Figure 7. Standardized anomalies of annual (a), kiremt (b), bega (c), and belg (d) rainfall in west Gojjam zone, central highlands of Abbay Basin (2001–2020).
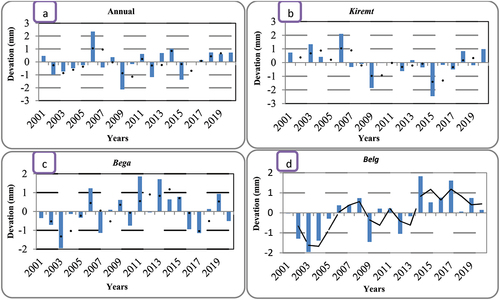
The highest positive (2.4) and negative (−2.1) rainfall anomalies were observed in the years 2006 and 2009, which were extremely wet and extremely dry years, respectively. This can be attributed to the influence of climatic phenomena such as El Niño or La Niña events, which can significantly impact precipitation patterns. Research by Gobie and Miheretu (Citation2021) has shown that strong El Niño events, like the one observed in 2006, can lead to above-average rainfall in certain regions, while La Niña events, as in 2009, are associated with drier conditions.
The years 2002, 2003, 2009, 2012, and 2015 were dry, whereas 2006, 2014, 2018, 2019 and 2020 were wet years. During the wettest years, annual rainfall has been around 2.4 times the standard deviations above the long-term (2001–2020) average. On the other hand, annual rainfall was found to be 2.1 times the standard deviation below the long-term average during the dry years (). As indicated by Zhang et al. (Citation2018), the possible reason for such variabilities might be due to atmospheric circulation patterns, such as the Indian Ocean Dipole, influencing extreme wet and dry years in East Africa. According to this author, variations in large-scale climate drivers can result in the observed anomalies in annual rainfall, with wet years exceeding standard deviations above the long-term average and dry years falling below.
Substantial positive anomalies were observed during the kiremt season in the years 2001, 2003, 2006, 2018, and 2020. The rainfall in the wettest years deviated from the mean rainfall by factors of 0.73, 1.34, 2.1, 0.84 and 0.98 (). Extreme negative anomalies were recorded during the kiremt season in 2009 and 2015, with deviations of 1.85 and 2.46, respectively. Positive rainfall anomalies during the kiremt season at all stations throughout the study period accounted for 60% compared to negative anomalies (). This finding aligns with a previous study by A. Teshome and Zhang (Citation2019), which highlighted the erratic nature of standardized rainfall anomalies during the kiremt season in eastern and northwestern Ethiopia. Similar variability in rainfall was observed during the belg and bega seasons, with negative anomalies of around 40% and 55%, respectively (). Overall, the time series analysis of annual and seasonal rainfall in the west Gojjam zone indicates episodic fluctuations between wet and dry years. Similarly, the study of Abdi and Yimenu (Citation2020) also revealed that both negative and positive rainfall anomalies were occurred between 1996 and 2016 in Quarit district of west Gojjam zone.
Trend analysis of annual and seasonal rainfall
The trend analysis of annual and seasonal rainfall revealed different patterns during the study period from 2001 to 2020. The Mann-Kendall (MK) test results indicated a statistically significant increasing trend in annual rainfall (9.14 mm/year), and the belg season (6.94 mm/year) (). A similar increasing trend, although not statistically significant, was observed during the bega season. Conversely, the kiremt season showed a non-significant decreasing trend at p < 0.05. These results align with Alemayehu et al. (Citation2022), who reported varying degrees of increment in rainfall distribution in Northwest Ethiopia, excluding the kiremt season. Additionally, Alemu and Bawoke (Citation2020) noted an overall increasing trend in annual and seasonal rainfall over the Amhara region, except during the winter season. In contrast, Asfaw et al. (Citation2018) found a statistically significant decreasing trend in annual and kiremt season rainfall, with a decreasing but non-significant trend in the belg season in north-central Ethiopia. Similarly, the study of Abdi and Yimenu (Citation2020) also reported that very slightly decreasing trend of rainfall was occurred in Quarit district of west Gojjam zone from 1997 to 2016.
Conclusions
The prime aim of this study was to examine the spatiotemporal variability and trends of rainfall in west Gojjam zone of the central highlands of Abbay Basin, utilizing the Integrated Multi-satellitE Retrievals for GPM (IMERG-06) dataset from 2001 to 2020. Giving crucial role of rainfall in the livelihood of people who rely on rainfed agriculture, this study focused on onsets, cessation date, length of the rainy season, and dry-spell length of rainfall for kiremt season, CV% and SRA were used to evaluate variability and seasonality of rainfall. Mann-Kendall s test and Sen s slope estimator were used for trend analysis of rainfall.
The results of the study showed that the mean onset and cessation date of the study stations exhibited spatial and temporal variation. The mean onset date of central highlands of Abbay Basin was late, whereas the mean cessation date of the study area was too early, i.e. 142 and 297 DOY, respectively. Growing season length and quality are affected substantially by the frequency and duration of dry spells within a season. The distribution of mean annual and kiremt season rainfall showed that the northern and northwestern parts of the study area received maximum rainfall while the southern and southeastern and western parts of the study area received relatively low rainfall. Annual (11.7%), kiremt (12.6%) and belg (10.6%) seasons rainfall revealed moderate variability, whereas bega (22.6%) season rainfall had higher variability in the study area. Further, Eastern and southwestern parts of the study area had high variation during the kiremt season. Inter-annual rainfall variability was evident for the occurrence of dry and wet years. The Kiremt season positive rainfall anomalies of all stations during the study period accounted 60% over negative anomalies. The annual (9.14 mm/year) and belg (6.94 mm/year) season rainfall exhibited statistically significant increasing trends, while the kiremt (−1.88 mm/year) season had a non-significant decreasing trend at p < 0.05.
Such information will facilitate Ethiopian agricultural planning and development in general, and west Gojjam zone in particular, helps to reduce the adverse effects of climate variability, and promote full capitalization when abundant rains occur. The study area time of production is Kiremt. Hence, emphasis was placed on Kiremt onset, cessation date, length of the rainy season and dry-spell length.
Further research incorporating additional climate elements and long-time series data is recommended for enhanced precision and understanding of local weather patterns and their implications for water resources and ecosystem management.
Availability of data
The data used for analysis for the current study are available up on the corresponding author and National Meteorological Station Agency (NMA) on reasonable request.
Supplemental Material
Download MS Word (24.7 KB)Supplemental Material
Download MS Word (535.9 KB)Acknowledgments
The authors acknowledge the National Meteorology Agency of Ethiopia (NMA) for providing the study with long-term gauge-based daily rainfall data. The authors also acknowledge the use of the IMERG-06 dataset from Integrated Multi-satellitE Retrievals for GPM (https://gpm.nasa.gov/data/imerge). We are grateful to Bahir Dar University for providing the first author with study leave.
Disclosure statement
No potential conflict of interest was reported by the author(s).
Supplementary material
Supplemental data for this article can be accessed online at https://doi.org/10.1080/22797254.2024.2372856.
References
- Abdi, Y., & Yimenu, Y. (2020). Effect of rainfall and temperature on crop production in Quarit District. International Journal of Environmental Monitoring and Analysis, 8(4), 88–19. https://doi.org/10.11648/j.ijema.20200804.12
- Abebe, M. (2006). The onset, cessation and dry spells of the small rainy season (belg) of Ethiopia. Meteorological Research and Studies Department National Meteorological Agency, Addis Ababa, Ethiopia.
- Abeje, M. T., Tsunekawa, A., Haregeweyn, N., Nigussie, Z., Adgo, E., Ayalew, Z. & Masunaga, T. (2019). Communities’ livelihood vulnerability to climate variability in Ethiopia. Sustainability, 11(22), 6302. https://doi.org/10.3390/su11226302
- Addisu, S., Selassie, Y. G., Fissha, G., & Gedif, B. (2015). Time series trend analysis of temperature and rainfall in lake Tana Sub-basin, Ethiopia. Environmental Systems Research, 4(1), 25. https://doi.org/10.1186/s40068-015-0051-0
- Adeoti, A., Coster, A., & Akanni, T. (2016). Analysis of farmers’ vulnerability, perception adaptation to climate change in Kwara State, Nigeria. International Journal of Climate Research, 1(1), 1–16. https://doi.org/10.18488/journal.112/2016.1.1/112.1.1.16
- Agnew, C. T., & Chappell, A. (1999). Drought in the Sahel. Geo Journal, 48(4), 299–311. https://doi.org/10.1023/A:1007059403077
- Alemayehu, Z. Y., Minale, A. S., & Legesse, S. A. (2022). Spatiotemporal rainfall and temperature variability in suha watershed, Upper Blue Nile Basin, Northwest Ethiopia. Environmental Monitoring and Assessment, 194(8), 1–25. https://doi.org/10.1007/s10661-022-10165-x
- Alemu, M. M., & Bawoke, G. T. (2020). Analysis of spatial variability and temporal trends of rainfall in amhara region, Ethiopia. Journal of Water and Climate Change, 11(4), 1505–1520. https://doi.org/10.2166/wcc.2019.084
- Anteneh, M. (2022). Climate variability patterns and farmers’ perceptions of its impact on food production: A case study of the gelda watershed in the Lake Tana Basin in Northwest Ethiopia. Air, Soil and Water Research, 15, 11786221221135093. https://doi.org/10.1177/11786221221135093
- Araro, K., Legesse, S. A., & Meshesha, D. T. (2019). Climate change and variability impacts on rural livelihoods and adaptation strategies in Southern Ethiopia. Earth Systems and Environment, 4(1), 15–26. https://doi.org/10.1007/s41748-019-00134-9
- Arragaw, A., & Woldeamlak, B. (2017). Local spatiotemporal variability and trends in rainfall and temperature in the central highlands of Ethiopia. Geografiska Annaler, Series A: Physical Geography, 99(2), 85–101. https://doi.org/10.1080/04353676.2017.1289460
- Asfaw, A., Simane, B., Hassen, A., & Bantider, A. (2018). Variability and time series trend analysis of rainfall and temperature in northcentral Ethiopia: A case study in Woleka sub-basin. Weather and Climate Extremes, 19, 29–41. https://doi.org/10.1016/j.wace.2017.12.002
- Ayalew, D., Tesfaye, K., Mamo, G., Yitaferu, B., & Bayu, W. (2012a). Outlook of future climate in northwestern Ethiopia. Agricultural Sciences, 3(4), 608–624. https://doi.org/10.4236/as.2012.34074
- Ayalew, D., Tesfaye, K., Mamo, G., Yitaferu, B., & Bayu, W. (2012b). Variability of rainfall and its current trend in Amhara region, Ethiopia. African Journal of Agricultural Research, 7(10), 1475–1486. https://doi.org/10.5897/AJAR11.698
- Banacos, P. C. (2011). Box and whisker plots for local climate datasets interpretation and creation using Excel 2007/2010.
- Banerjee, A., Ariz, D., Turyasingura, B., Pathak, S., Sajjad, W., Yadav, N., & Kirsten, K. L. (2024). Long-term climate change and anthropogenic activities together with regional water resources and agricultural productivity in Uganda using Google Earth Engine. Physics and Chemistry of the Earth, Parts A/B/C, 134, 103545. https://doi.org/10.1016/j.pce.2024.103545
- Banerjee, A., Chen, R. E., Meadows, M., Singh, R., Mal, S., & Sengupta, D. (2020). An analysis of long-term rainfall trends and variability in the uttarakhand himalaya using google earth engine. Remote Sensing, 12(4), 709. https://doi.org/10.3390/rs12040709
- Behrangi, A., Khakbaz, B., Jaw, T. C., AghaKouchak, A., Hsu, K., & Sorooshian, S. (2011). Hydrologic evaluation of satellite precipitation products over a mid-size basin. Journal of Hydrology, 397(3–4), 225–237. https://doi.org/10.1016/j.jhydrol.2010.11.043
- Berhane, T., Shibabaw, N., Awgichew, G., & Kebede, T. (2018). Modeling and forecasting rainfall in Ethiopia. International Journal of Computing Science and Applied Mathematics, 4(2), 42–46. https://doi.org/10.12962/j24775401.v4i2.3824
- Bewket, W. (2009). Rainfall variability and crop production in Ethiopia: Case study in the Amhara region. Paper presented at the Proceedings of the 16th International Conference of Ethiopian Studies, Norwegian University of Science.
- Bewket, W., & Conway, D. (2007). A note on the temporal and spatial variability of rainfall in the drought‐prone Amhara region of Ethiopia. International Journal of Climatology: A Journal of the Royal Meteorological Society, 27(11), 1467–1477. https://doi.org/10.1002/joc.1481
- Bogale, G. A. (2023). Analysis the characterization of climate change and its impacts on smallholder farmers in Eastern Ethiopia. Heliyon, 9(10), e20293. https://doi.org/10.1016/j.heliyon.2023.e20293
- Csa, C. S. A. (2017). Population projection of ethiopia for all regions at wereda level from 2014 – 2017, federal demographic Republic of Ethiopia. Central Statstical Agency. Retrieved from Addis Ababa.
- Dinku, T., Funk, C., Peterson, P., Maidment, R., Tadesse, T., Gadain, H., & Ceccato, P. (2018). Validation of the CHIRPS satellite rainfall estimates over eastern Africa. Quarterly Journal of the Royal Meteorological Society, 144(S1), 292–312. https://doi.org/10.1002/qj.3244
- Dube, A. K., Fawole, W. O., Govindasamy, R., & Özkan, B. (2019). Agricultural development led industrialization in Ethiopia: Structural break analysis. International Journal of Agriculture Forestry and Life Sciences, 3(1), 193–201.
- Froidurot, S., & Diedhiou, A. (2017). Characteristics of wet and dry spells in the West African Monsoon System. Atmospheric Science Letters, 18(3), 125–131. https://doi.org/10.1002/asl.734
- Gebrechorkos, S. H., Hülsmann, S., & Bernhofer, C. (2019). Long-term trends in rainfall and temperature using high-resolution climate datasets in East Africa. Scientific Reports, 9(1), 1–9. https://doi.org/10.1038/s41598-019-47933-8
- Gebreegziabher, S. B., Yimer, S. A., & Bjune, G. A. (2016). Qualitative assessment of challenges in tuberculosis control in west gojjam zone, Northwest Ethiopia: Health workers’ and tuberculosis control program coordinators’ perspectives. Tuberculosis Research and Treatment, 2016, 1–8. https://doi.org/10.1155/2016/2036234
- Gebrehiwot, T., & Van, D. V. A. (2013). Farm level adaptation to climate change: The case of farmer’s in the Ethiopian highlands. Environmental Management, 52(1), 29–44. https://doi.org/10.1007/s00267-013-0039-3
- Gilbert, R. O. (1987). Statistical methods for environmental pollution monitoring. John Wiley & Sons.
- Githungo, W., Otengi, S., Wakhungu, J., & Masibayi, E. (2016). Infilling monthly rain gauge data gaps with satellite estimates for Asal of Kenya. Hydrology, 3(4), 40. https://doi.org/10.3390/hydrology3040040
- Gobie, B. G., & Miheretu, B. A. (2021). Effects of El nino southern oscillation events on rainfall variability over northeast Ethiopia. Modeling Earth Systems and Environment, 7(4), 2733–2739. https://doi.org/10.1007/s40808-020-01060-w
- Gong, D. Y., Wang, J. A., & Han, H. (2005). Trends of summer dry spells in china during the late twentieth century. Meteorology and Atmospheric Physics, 88(88), 203–214. https://doi.org/10.1007/s00703-004-0081-z
- Gummadi, S., Rao, K. P. C., Seid, J., Legesse, G., Kadiyala, M. D. M., Takele, R. & Whitbread, A. (2018). Spatio-temporal variability and trends of precipitation and extreme rainfall events in Ethiopia in 1980–2010. Theoretical and Applied Climatology, 134(3), 1315–1328. https://doi.org/10.1007/s00704-017-2340-1
- Hare, W. (2003). Assessment of knowledge on impacts of climate change–contribution. Arctic, 100(6).
- Hartke, S. H., & Wright, D. B. (2022). Where can IMERG provide a better precipitation estimate than interpolated gauge data? Remote Sensing, 14(21), 5563. https://doi.org/10.3390/rs14215563
- Huffman, G. J., Bolvin, D. T., Braithwaite, D., Hsu, K. L., Joyce, R. J., Kidd, C, & Xie, P. (2020). Chapter 19: Integrated Multi-satellitE Retrievals for the Global Precipitation Measurement (GPM) mission (IMERG). In V. Levizzani, C. Kidd, D. B. Kirschbaum, C. D. Kummerow, K. Nakamura, & F. J. Turk (Eds.), Satellite Precipitation Measurement (Vol. 67, pp. 343–353). Springer, Cham. https://doi.org/10.1007/978-3-030-24568-9_19
- Huth, R., Kyselyy, J., & Pokorna, L. (2000). A GCM simulation of heat waves, dry spells, and their relationships to circulation. Climatic Changes, 46(16), 29–60. https://doi.org/10.1023/A:1005633925903
- IPCC. (2014). Climate change 2014: Impacts, adaptation, and vulnerability. contribution of working group ii to the fifth assessment report of the intergovernmental panel on climate change (Vol. 2). Cambridge University Press.
- IPCC. (2019). Climate change and land: an IPCC special report on climate change, desertification, land degradation, sustainable land management, food security, and greenhouse gas fluxes in terrestrial ecosystems.
- IPCC. (2022). Global Warming of 1.5 C: IPCC special report on impacts of global warming of 1.5 C above pre-industrial levels in context of strengthening response to climate change, sustainable development, and efforts to eradicate poverty. In V. Masson-Delmotte, P. Zhai, H.-O. Pörtner, D. Roberts, J. Skea, & P.R. Shukla (Eds.), Global Warming of 1.5 oC. Cambridge University Press.
- Kaspar, F., Andersson, A., Ziese, M., & Hollmann, R. (2022). Contributions to the improvement of climate data availability and quality for sub-Saharan Africa. Frontiers in Climate, 3, 815043. https://doi.org/10.3389/fclim.2021.815043
- Kassie, B., Rötter, R., Hengsdijk, H., Asseng, S., Van Ittersum, M., Kahiluoto, H., & Van Keulen, H. (2014). Climate variability and change in the Central Rift Valley of Ethiopia: Challenges for rainfed crop production. The Journal of Agricultural Science, 152(1), 58–74. https://doi.org/10.1017/S0021859612000986
- Kebede, A., Diekkrüger, B., & Edossa, D. C. (2017). Dry spell, onset and cessation of the wet season rainfall in the upper baro-akobo basin, Ethiopia. Theoretical and Applied Climatology, 129(3), 849–858. https://doi.org/10.1007/s00704-016-1813-y
- Kendall, M. G. (1938). A new measure of rank correlation. Biometrika, 30(1/2), 81–93. https://doi.org/10.1093/biomet/30.1-2.81
- Khodadoust Siuki, S., Saghafian, B., & Moazami, S. (2017). Comprehensive evaluation of 3-hourly TRMM and half-hourly GPM-IMERG satellite precipitation products. International Journal of Remote Sensing, 38(2), 558–571. https://doi.org/10.1080/01431161.2016.1268735
- Kidd, C., Bauer, P., Turk, J., Huffman, G., Joyce, R., Hsu, K.-L., & Braithwaite, D. (2012). Intercomparison of high-resolution precipitation products over northwest Europe. Journal of Hydrometeorology, 13(1), 67–83. https://doi.org/10.1175/JHM-D-11-042.1
- Legese, S., Olutayo, O., Sulaiman, H., & Rao, P. (2016). Assessing climate change impacts in the Lake Tana Sub-Basin, Ethiopia using livelihood vulnerability approach. Journal of Earth Science and Climatic Change, 7(368), 1–10. https://doi.org/10.4172/2157-7617.1000368
- Maggioni, V., Meyers, P. C., & Robinson, M. D. (2016). A review of merged high-resolution satellite precipitation product accuracy during the Tropical Rainfall Measuring Mission (TRMM) era. Journal of Hydrometeorology, 17(4), 1101–1117. https://doi.org/10.1175/JHM-D-15-0190.1
- Mann, H. B. (1945). Nonparametric tests against trend. Econometrica: Journal of the Econometric Society, 13(3), 245–259. https://doi.org/10.2307/1907187
- Markos, D., Worku, W., Mamo, G., & Coughlan de Perez, E. (2023). Spatio-temporal variability and rainfall trend affects seasonal calendar of maize production in southern central rift valley of Ethiopia. PLOS Climate, 2(6), e0000218. https://doi.org/10.1371/journal.pclm.0000218
- Mason, S. J., & Goddard, L. (2001). Influence of the Indian ocean dipole on rainfall variability in the horn of Africa. Climate Dynamics, 18(2–3), 107–121.
- Mebratu, D., & Prem, K. (2020). Analysis of climate variability and adaptive strategies of rural household: the case of Abobo District and itag Special Districts, gambella Region State, Ethiopia. Asian Journal of Agriculture Extension, Economics and Sociology, 38(4), 82–93. https://doi.org/10.9734/ajaees/2020/v38i430340
- Mengistu, D., Bewket, W., & Lal, R. (2014). Recent spatiotemporal temperature and rainfall variability and trends over the Upper Blue Nile River Basin, Ethiopia. International Journal of Climatology, 34(7), 2278–2292. https://doi.org/10.1002/joc.3837
- Mupangwa, W., Walker, S., & Twomlow, S. (2011). Start, end and dry spells of the growing season in semi-arid southern Zimbabwe. Journal of Arid Environments, 75(11), 1097–1104. https://doi.org/10.1016/j.jaridenv.2011.05.011
- Muthoni, F. K., Odongo, V. O., Ochieng, J., Mugalavai, E. M., Mourice, S. K., Hoesche-Zeledon, I. & Bekunda, M. (2019). Long-term spatial-temporal trends and variability of rainfall over Eastern and Southern Africa. Theoretical and Applied Climatology, 137(3), 1869–1882. https://doi.org/10.1007/s00704-018-2712-1
- Nguyen, P., Shearer, E. J., Tran, H., Ombadi, M., Hayatbini, N., Palacios, T. & Sorooshian, S. (2019). The CHRS Data Portal, an easily accessible public repository for PERSIANN global satellite precipitation data. Scientific Data, 6(1), 1–10. https://doi.org/10.1038/sdata.2018.296
- Nicholson, S. E. (2017). Climate and climatic variability of rainfall over eastern Africa. Reviews of Geophysics, 55(3), 590–635. https://doi.org/10.1002/2016RG000544
- NMA. (2009). Seasonal agro-meteorological bulletin belg, 19(15).
- NMA. (2020). National Meteorology Service Agency. Bahir Dar district.
- Omay, P. O., Muthama, N. J., Oludhe, C., Kinama, J. M., Artan, G., & Atheru, Z. (2023). Changes and variability in rainfall onset, cessation, and length of rainy season in the IGAD region of Eastern Africa. Theoretical and Applied Climatology, 152(1–2), 871–893. https://doi.org/10.1007/s00704-023-04433-0
- Roger, S., Parsons, D., Stern, D., & Torgbor, F. (2021). R-Instat Climatic Guide. University of Reading and Stats4sd. https://stats4sd.org/IDEMSInternational https://www.idems.international
- Rosell, S., & Holmer, B. (2007). Rainfall change and its implications for Belg harvest in South Wollo, Ethiopia. Geografiska Annaler, Series A: Physical Geography, 89(4), 287–299. https://doi.org/10.1111/j.1468-0459.2007.00327.x
- Sanchi, I. D., Alhassan, Y. J., Sabo, Y. A., & Hamid, B. J. (2021). Critical review of the causes and effects of dry spell in 2021 rainy season in danko wasagu local government, Kebbi State. Nigeria Cross Current International Journal of Agriculture and Veterinary Sciences, 3(8). https://doi.org/10.36344/ccijavs.2021.v03i08.001
- Segele, Z. T., & Lamb, P. J. (2005). Characterization and variability of Kiremt rainy season over Ethiopia. Meteorology and Atmospheric Physics, 89(1), 153–180. https://doi.org/10.1007/s00703-005-0127-x
- Segele, Z. T., Richman, M. B., Leslie, L. M., & Lamb, P. J. (2015). Seasonal-to-interannual variability of ethiopia/horn of Africa monsoon. Part II: Statistical multimodel ensemble rainfall predictions. Journal of Climate, 28(9), 3511–3536. https://doi.org/10.1175/JCLI-D-14-00476.1
- Sen, P. K. (1968). Estimates of the regression coefficient based on Kendall’s tau. Journal of the American Statistical Association, 63(324), 1379–1389. https://doi.org/10.1080/01621459.1968.10480934
- Senbeta, A. F., & Olsson, J. (2009). Climate change impact on livelihood, vulnerability and coping mechanisms: A case study of West-Arsi Zone. Lund University, Lund, 54.
- Sharma, S., Khadka, N., Hamal, K., Shrestha, D., Talchabhadel, R., & Chen, Y. (2020). How accurately can satellite products (TMPA and IMERG) detect precipitation patterns, extremities, and drought across the Nepalese Himalaya? Earth and Space Science, 7(8), e2020EA001315. https://doi.org/10.1029/2020EA001315
- Sherbinin, D. A., VanWey, L. K., McSweeney, K., Aggarwal, R., Barbieri, A., Henry, S. & Walker, R. (2008). Rural household demographics, livelihoods and the environment. Global Environmental Change, 18(1), 38–53. https://doi.org/10.1016/j.gloenvcha.2007.05.005
- Sisay, K., Thurnher, C., & Hasenauer, H. (2017). Daily climate data for the Amhara region in Northwestern Ethiopia. International Journal of Climatology, 37(6), 2797–2808. https://doi.org/10.1002/joc.4880
- Stern, R. D., & Coe, R. (1982). The use of rainfall models in agricultural planning. Agricultural Meteorology, 26(1), 35–50. https://doi.org/10.1016/0002-1571(82)90056-5
- Tadesse, B., Admassu, S., Jemal, S., & Abebe, Z. (2014). Seasonal climate variability dependent effects of conservation agriculture practices across different agro ecologies in Ethiopia. Paper presented at the National Conference on Conservation Agriculture: Climate Change Impacts Winnipeg Convention Centre, Winnipeg Mantoba.
- Tamiru, B. S. (2020). Smallholder farmers perceptions and adaptation strategies to climate change in Ethiopia review. Agricultural Research & Technology, 25(1). https://doi.org/10.19080/ARTOAJ.2020.25.556288
- Tarkegn, G. B., & Jury, M. R. (2020). Changes in the seasonality of Ethiopian highlands climate and implications for crop growth. Atmosphere, 11(9), 892. https://doi.org/10.3390/atmos11090892
- Taye, M., Mengistu, D., & Sahlu, D. (2023). Performance evaluation of multiple satellite rainfall data sets in central highlands of Abbay Basin, Ethiopia. European Journal of Remote Sensing, 56(1), 2233686. https://doi.org/10.1080/22797254.2023.2233686
- Taye, M., Zewdu, F., & Ayalew, D. (2013). Characterizing the climate system of Western Amhara, Ethiopia: A GIS approach. American Journal of Research Communication, 1(10), 319–355.
- Teshome, A., & Zhang, J. (2019). Increase of extreme drought over Ethiopia under climate warming. Advances in Meteorology, 2019, 1–18. https://doi.org/10.1155/2019/5235429
- Teshome, M. (2017). Perceived impact of climate change on crop yield trend in denbia woreda of amhara region, Northwest Ethiopia. MOJ Ecology & Environmental Sciences, 2(7). https://doi.org/10.15406/mojes.2017.02.00047
- Theil, H. (1950). A rank-invariant method of linear and polynomial regression analysis. Indagationes Mathematicae, 12(85), 173.
- Wakjira, M. T., Peleg, N., Anghileri, D., Molnar, D., Alamirew, T., Six, J., & Molnar, P. (2021). Rainfall seasonality and timing: Implications for cereal crop production in Ethiopia. Agricultural and Forest Meteorology, 310(108633), 108633. https://doi.org/10.1016/j.agrformet.2021.108633
- Wang, X., & Zhou, Y. (2008). Impact of ENSO on East Africa’s rainfall patterns. Journal of Climate, 20(5), 987–1002.
- WBG, World Bank Group. (2021). Climate change knowlede portal. https://climateknowledgeportal.worldbank.org/country/ethiopia
- Wedajo, G. K., Muleta, M. K., & Awoke, B. G. (2021). Performance evaluation of multiple satellite rainfall products for Dhidhessa River Basin (DRB), Ethiopia. Atmospheric Measurement Techniques, 14(3), 2299–2316. https://doi.org/10.5194/amt-14-2299-2021
- Weldegerima, T. M., Birhanu, B. S., & Zeleke, T. T. (2023). Zoning and agro-climatic characterization of hotspots in the tana-beles sub-basin–Ethiopia. African Journal of Agricultural Research, 19(4), 455–465. https://doi.org/10.5897/AJAR2021.15613
- Weldegerima, T. M., Zeleke, T. T., Birhanu, B. S., Zaitchik, B. F., & Fetene, Z. A. (2018). Analysis of rainfall trends and its relationship with SST signals in the Lake Tana Basin, Ethiopia. Advances in Meteorology, 2018, 1–10. https://doi.org/10.1155/2018/5869010
- Yohannes, Z. A., Ayoade, J. O., Adelekan, I. O., & Zeleke, M. T. (2017). Rural communities’ perception of climate change and its determinants in Dejen district, Nile basin of Ethiopia. Asian Journal of Agriculture and Rural Development, 7(5), 102–114. https://doi.org/10.18488/journal.1005/2017.7.5/1005.5.102.114
- Yurdakul, H., & Kamasak, R. (2020). Investment through public private partnership (PPP): The impact of PPP activities on the growth of GDP. Press Academia Procedia, 11(1), 150–152. https://doi.org/10.17261/Pressacademia.2020.1257
- Zeleke, G., Teshome, M., & Ayele, L. (2023). Farmers’ livelihood vulnerability to climate-related risks in the north wello zone, northern Ethiopia. Environmental and Sustainability Indicators, 17, 100220. https://doi.org/10.1016/j.indic.2022.100220
- Zewdu, S., Bewket, W., & Teferi, E. (2019). Analysis of rainfall and temperature variability and trends in the upper blue nile basin, Ethiopia. International Journal of Environmental Research and Public Health, 16(17), 3079.
- Zhang, A., Lee, B., & Wang, C. (2018). Variabilities of rainfall due to atmospheric circulation patterns. International Journal of Climatology, 42(3), 789–802.