
ABSTRACT
This study investigated the hepatoprotective role of natural compounds [glycyrrhizin (GL) and omega-3 fatty acids (ω-3)] against thioacetamide (TAA)-induced liver fibrosis and clarified their underlying molecular mechanism through their effect on oxidative stress and toll-like receptor-4 (TLR-4). Forty male Wistar rats were randomized to five groups: Control group and four groups received TAA 200 mg/kg i.p. twice weekly for 8 weeks: TAA group, TAA+GL group (received GL 25 mg/kg daily by oral tube), TAA+ω-3 group (received ω-3150 mg/kg daily by oral tube), TAA+GL+ω-3 group (received similar combined doses of both natural compounds). GL, ω-3 and their combination protected the liver from TAA-hepatotoxic effects. Their hepatoprotective effects were confirmed by histopathological analysis as they significantly reduced the necroinflammatory scores and the extent of fibrosis. They act as anti-oxidant as they significantly decreased the liver malondialdehyde level (P < 0.005). They also significantly increased liver inactive TLR-4 concentration (P < 0.005) which indicates inhibition of TLR-4 pathway. This is confirmed by a significant decrease in liver TLR-4 mRNA expression (P < 0.005). In conclusion, glycyrrhizin, omega-3 fatty acids and their combination have potent anti-inflammatory, anti-oxidant and anti-fibrotic effects through inhibition of TLR-4.
Introduction
Chronic liver disease is the 14th most common cause of death in adults worldwide; it results in 1.03 million deaths per year worldwide [Citation1]. Different mechanisms of liver injury lead to chronic liver disease by causing necroinflammation and fibrogenesis. Histologically liver injury causes diffuse nodular regeneration surrounded by dense fibrotic septa with subsequent parenchymal extinction and collapse of liver structures and pronounced distortion of hepatic vascular architecture [Citation2]. Chronic liver disease in developed countries is mainly caused by hepatitis B virus, hepatitis C virus, alcohol misuse and alcoholic liver disease [Citation3].
Toll-like receptor-4 (TLR-4) has a critical role in innate immunity as the first line of host defense. Dimerization of two receptor molecules precedes TLR-4 activation [Citation4]. The TLR-4 pathway consists of two different signaling pathways, the myeloid differentiating primary response gene 88 (MyD88)-dependent and the MyD88-independent pathway. (MyD88)-dependent pathway results in the production of pro-inflammatory cytokines through activation of nuclear factor-κB (NF-κB), while the MyD88-independent pathway results in the production of type 1 interferons [Citation5]. Innate immune responses are initiated when danger associated molecule patterns and pathogen-associated molecular patterns (PAMP) are recognized by pattern recognition receptors including TLR-4 [Citation6]. A classical PAMP is a lipopolysaccharide (LPS) from gram-negative bacteria which activates high mobility group box1 (HMGB1). HMGB1 is a highly conserved protein released by injured or dying cells as a result of pathogenic products [Citation7]. HMGB1 may trigger an inflammatory response via activation of TLR-4 pathway which activates NF-κB. This consequently causes an enhancement in the production of tumor necrosis factor α (TNF-α), interleukin-1b (IL-1b) and nitric oxide [Citation8].
Glycyrrhizin (GL), the main bioactive component of licorice root extract, is a glycosylated saponin composed of one molecule of glycyrrhetinic acid and two molecules of glucuronic acid [Citation9]. GL has potent anti-inflammatory properties which are thought to play a vital role in its hepatoprotective effects [Citation10]. GL is reported to bind directly to HMGB1 so it decreases the HMGB1 concentration [Citation11]. Experimental strategies that selectively target HMGB1 prevent activation of innate immunity and inflammation effectively. So, they protect different tissues against injury and damage [Citation7].
Omega-3 fatty acids (ω-3) such as eicosapentaenoic acid (EPA) and docosahexaenoic acid (DHA) are bioactive dietary compounds [Citation12]. ω-3 supplements are reported to be used in hepatic injury and steatosis [Citation13]. ω-3 are also reported to alter the production of inflammatory mediators such as chemokines, growth factors and matrix proteases [Citation14].
Materials and methods
Drugs and chemicals
Thioacetamide (TAA) and Glycyrrhizin (Glycyrrhizic acid ammonium salt) from licorice (Glycyrrhiza Glabra) root were purchased from Sigma–Aldrich (Sigma, St. Louis, MO, USA). Omega-3 fatty acids containing EPA and DHA in a 3:2 ratio were purchased from Lifeplan (Elizabethan Way, Lutterworth, United Kingdom).
Animals
Forty Male Sprague–Dawley rats weighing (180–200 g) were purchased from ‘Egyptian Organization for Biological Products and Vaccines’, Giza, Egypt. Animals were housed and had free access to standard rat food and tap water for 1 week for acclimatization. The animal care and experiments described in this study complied with ‘Research Ethics Committee’ Faculty of Pharmacy, Mansoura University, Egypt which are in accordance with ‘Principles of Laboratory Animal Care’ (NIH publication No. 85–23, revised 1985.) Rats in all groups were fed a normal pellet diet (control diet).
Induction of liver fibrosis
Liver fibrosis was induced according to the method of Esmat et al. [Citation15]. Thirty-two male Sprague–Dawley rats were intraperitoneally (i.p.) injected with freshly prepared TAA (200 mg/kg of body weight) in 0.2 ml sterile saline twice weekly (days 2 and 6) for eight consecutive weeks. Liver fibrosis induction was confirmed by the histopathological examination of liver tissue.
Experimental design
Rats were distributed randomly to five groups as illustrated in : Control group (8 rats) were injected i.p. with 0.2 ml sterile saline twice weekly (days 2 and 6) for eight consecutive weeks, TAA group (8 rats): TAA-induced fibrotic group as described above, TAA+GL group (8 rats): hepatic fibrosis treated with GL (25 mg/kg/day by oral tube dissolved in distilled water) [Citation16] for 8 weeks along with TAA, TAA+ω-3 group (8 rats): hepatic fibrosis treated with ω-3 (150 mg/kg/day by oral tube) [Citation17] for 8 weeks along with TAA, TA+GL+ω-3 group (8 rats): hepatic fibrosis treated with a combination of GL and ω-3 (received similar doses) along with TAA.
Figure 1. The outline of the liver fibrosis model and the administration of natural products.
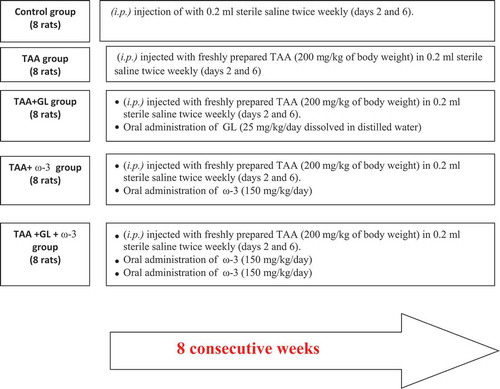
Rats in all groups were fed normal pellet diet (control diet) and no change in the food intake among groups was detected. Therefore, diet did not interfere with the effect of natural compounds used. Natural compounds were administrated using gastric gavage.
Collection of blood samples and liver tissues
At the end of the experiment, rats fasted for 12 h and then 5 ml blood samples were taken from the retro-orbital puncture under light ether anesthesia. The clotted blood samples were centrifugated at 5000 rpm for 5 min. Serum was divided into aliquots and stored at −80°C for biochemical analysis. Animals were sacrificed and the liver dissected out, rinsed in ice-cold phosphate buffer saline (PBS) pH 7.4 and blotted dry on a filter paper and divided into3parts:
A small part from the right lobe of the liver was cut and fixed in 10%phosphate-buffered formalin (pH 7.2) for histopathological examination.
Part of the remaining liver tissues was homogenized in cold PBS and then centrifuged at 5000 rpm for 15 min; then the supernatant was removed, divided into two parts and stored at −80°C for assay of malondialdehyde (MDA) by spectrophotometry and liver inactive TLR-4 by ELISA assay.
Last part was immediately immersed in liquid nitrogen and stored at −80°C for quantitative real-time reverse transcription-polymerase chain reaction (qRT-PCR) analysis.
Biochemical analysis
Serum was used for determination of ALT, AST activities, serum total bilirubin, total protein and albumin levels using commercial kits from Biodiagnostic (Cairo, Egypt).
Liver tissue homogenate was used for assaying lipid peroxidation by measuring MDA using a commercial kit from Biodiagnostic (Cairo, Egypt) and assaying Rat inactive TLR-4 using ELISA kitsfromMybiosource (San Diego, CA, USA).
Gene expression of TLR-4
RNA isolation and cDNA synthesis
Total RNA was isolated from liver tissues using easy-RED total RNA extraction kit (iNtRONBiotechnology, Seongnam, Korea) according to the manufacturer’s protocol. RNA was extracted with chloroform, followed by centrifugation at 4◦C to separate into aqueous and organic phases. RNA pellets were recovered from the aqueous phase by isopropyl alcohol precipitation and resuspended in nuclease-free water (Thermo Fisher Scientific Inc.). A total of 1 μg of RNA was used for cDNA synthesis using Maxima First Strand cDNA Synthesis Kit for RT-qPCR (Thermo Fisher Scientific Inc.), according to the manufacturer’s instructions. The resulting cDNA products were stored at – 20◦C.
Real-time reverse transcriptase-polymerase chain reaction
Real-time RT-PCR was performed using the Piko Real-PCR System (Thermo Fisher Scientific Inc.), according to the manufacturer’s instructions. For a final reaction volume of 20 μL, the following reagents were added: 4 μLhotfirepolEvaGreenqPCR Mix (Solis BioDyne, Tartu, Estonia), 1 μL each of forward and reverse 10 μM primers, 12 μL nuclease-free water and 2 μLcDNA template. The primers used were designed using premierBiosoft, the USA and the specific gene sequences were obtained from Pubmed (Entrez Gene). Primer sequence is described in .
Table 1. Primer sets used in qRT-PCR.
The amplification was performed as follows: 1 cycle of initial activation of DNA polymerase at 95◦C for 15 min, then repeated three-step cycling for 40 cycles: denaturation at 95◦C for 15 s, annealing at 60◦C for 20 s and elongation at 72◦C for 20 s. mRNA levels were quantified by using the comparative CT method (2−ΔΔCT method). The data were normalized to GAPDH RNA to account for differences in reverse transcriptase efficiencies and the amount of template in the reaction mixtures.
Histopathological examination
Phosphate-buffered formalin-fixed liver tissues were embedded in paraffin, and then they were cut into 4 µm thick sections and they were stained with hematoxylin and eosin (H&E) and Masson’s trichrome for histopathological examination.
Assessment of necroinflammatory activity grades
Liver samples stained with (H&E) were assessed for total and individual activity parameters guided by Ishak’s activity index [Citation18]. Classified according to the following parameters: interface hepatitis (piecemeal necrosis) (P1–P4), confluent necrosis (C0–C5), focal lobular necrosis and degeneration (FN0–FN4), and portal inflammation (PI1–PI4).
Quantification of fibrotic areas
Quantitative analysis of collagen fiber deposition in Masson’s trichrome stained liver tissues was performed by morphometric analysis [Citation19]. Images were taken by a digital camera mounted on a BX51 Olympus optical microscope (Olympus Corporation, Tokyo, Japan). The NIH image software was used for extraction and analyzing of collagenous areas stained with Masson trichrome. The extent of fibrosis was expressed as the percentage of fibrotic area relative to the total tissue area.
Statistical analysis
All the results were expressed as the mean ± Standard error of the mean (SE). One-way analysis of variance (ANOVA) followed by Bonferroni test was used for analyzing statistically significant differences between groups. P values of less than 0.05 were considered significant. The analysis and graphs were carried out using GraphPad Prism V 5.02 (GraphPad Software Inc., San Diego, CA, USA).
Results
Relative liver weight and liver function tests
Thioacetamide group showed a significant increase in relative liver weight (62.5%) (), serum ALT (404.4%) and AST (155.6%) activities ()), and serum total bilirubin concentration (510.5%) () compared with the control group (P < 0.005). TAA group also showed a significant decrease in serum concentrations of albumin (−20.9%) and total protein (−20.5%), compared with the control group (P < 0.005) ()).
Figure 2. Change in relative liver weight in rats after oral administration of glycyrrhizin (GL) (25mg/kg/day), omega-3 fatty acids (ω-3) (150 mg/kg/day) and their combination for 8 weeks along with thioacetamide (TAA) (200mg/kg twice weekly).
Values: (Mean ± SE), n = 8 rats per group.** = significant against normal group at P < 0.005, ## = significant against TAA group at P < 0.005.
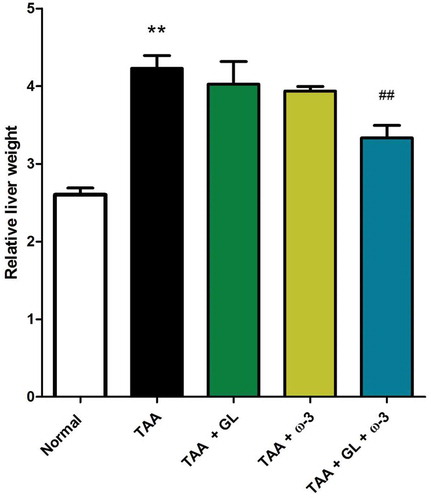
Figure 3. Change in serum (a) alanine aminotransferase (ALT) and (b) aspartate aminotransferase (AST) activities in rats after oral administration of glycyrrhizin (GL) (25mg/kg/day), omega-3 fatty acids (ω-3) (150 mg/kg/day) and their combination for 8 weeks along with thioacetamide (TAA) (200mg/kg twice weekly).
Values: (Mean ± SE), n = 8 rats per group. .* = significant against normal group at P < 0.05, *** = significant against normal group at P < 0.0005, ## = significant against TAA group at P < 0.05, ### = significant against TAA group at P < 0.005 $$ = significant against GL group at P < 0.005. ¥ = significant against ω-3 group at P < 0.05. ¥¥¥ = significant against ω-3 group at P < 0.0005.
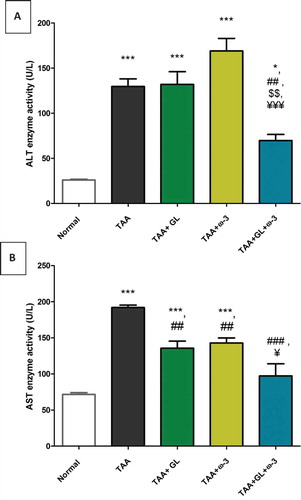
Figure 4. Change in serum total bilirubin concentration in rats after oral administration of glycyrrhizin (GL) (25mg/kg/day), omega-3 fatty acids (ω-3) (150 mg/kg/day) and their combination for 8 weeks along with thioacetamide (TAA) (200mg/kg twice weekly).
Values: (Mean ± SE), n = 8 rats per group.*** = significant against normal group at P < 0.0005, ### = significant against TAA group at P < 0.0005.
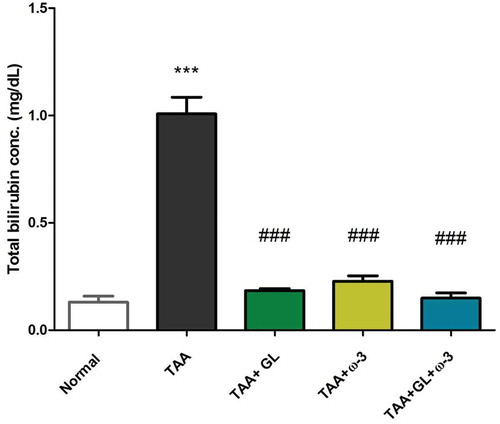
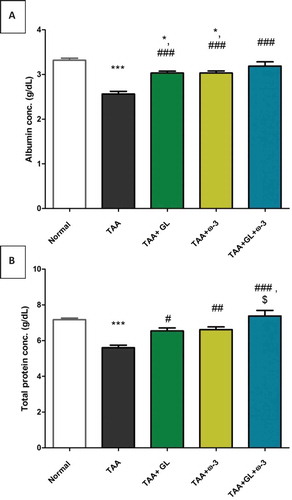
Figure 5. Change in serum (a) albumin and (b) total protein concentrations in rats after oral administration of glycyrrhizin (GL) (25mg/kg/day), omega-3 fatty acids (ω-3) (150 mg/kg/day) and their combination for 8 weeks along with thioacetamide (TAA) (200mg/kg twice weekly).
Values: (Mean ± SE), n = 8 rats per group.* = significant against normal group at P < 0.05, *** = significant against normal group at P < 0.0005, # = significant against TAA group at P < 0.05. ## = significant against TAA group at P < 0.005, ### = significant against TAA group at P < 0.0005, $ = significant against GL group at P < 0.05.
Administration of a combination of GL and ω-3 resulted in a significant decrease in relative liver weight (P < 0.005) (), serum ALT and AST activities (), compared with TAA group (P < 0.05, P < 0.005), respectively.
Administration of GL, ω-3 and their combination improved the liver detoxification pathway, as the serum total bilirubin concentration was decreased significantly compared with the TAA group (P < 0.005) (). Moreover, administration of GL, ω-3 and their combination protected the liver synthesis activity as the serum concentrations of albumin and total protein were significantly increased to the normal values compared with TAA group (P < 0.005, P < 0.05), respectively ().
Liver homogenate MDA concentration
Thioacetamide group showed a significant increase in hepatic MDA concentration (843.7%) in comparison to the control group (P < 0.005) ().
Figure 6. Change in liver malondialdehyde (MDA) concentration in rats after oral administration of glycyrrhizin (GL) (25mg/kg/day), omega-3 fatty acids (ω-3) (150 mg/kg/day) and their combination for 8 weeks along with thioacetamide (TAA) (200mg/kg twice weekly).
Values: (Mean ± SE), n = 8 rats per group.* = significant against normal group at P < 0.05, *** = significant against normal group at P < 0.0005, ### = significant against TAA group at P < 0.0005.
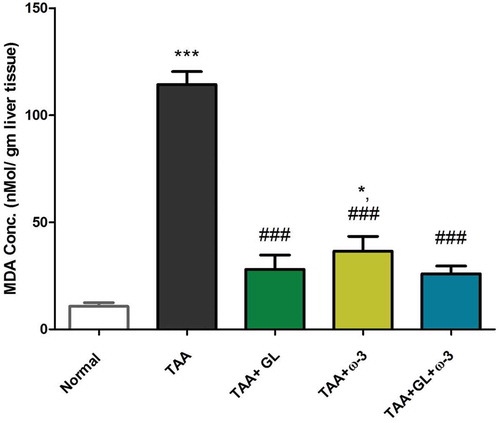
Administration of GL, ω-3 and their combination significantly decreased the elevated MDA concentrations compared with the TAA group (P < 0.005). The ω-3 group only showed a significant increase in MDA concentration compared with the control group (209.7%) (P < 0.05) ().
Liver homogenate inactive TLR-4concentrationand TLR-4 gene expression
Thioacetamide group showed a significant decrease in hepatic inactive TLR-4 concentration (−51.5%) ()) and a significant increase in hepatic gene expression of TLR-4 (149.5%) ()) in comparison to the control group (P < 0.0005, 0.005, respectively).
Figure 7. Change in (a) liver inactive toll-like receptor-4 (TLR-4) concentration and (b) liver TLR-4 gene expression in rats after oral administration of glycyrrhizin (GL) (25mg/kg/day), omega-3 fatty acids (ω-3) (150 mg/kg/day) and their combination for 8 weeks along with thioacetamide (TAA) (200mg/kg twice weekly).
Values: (Mean ± SE), n = 8 rats per group.* = significant against normal group at P < 0.05,** = significant against normal group at P < 0.005,*** = significant against normal group at P < 0.0005, ## = significant against TAA group at P < 0.005, ### = significant against TAA group at P < 0.0005
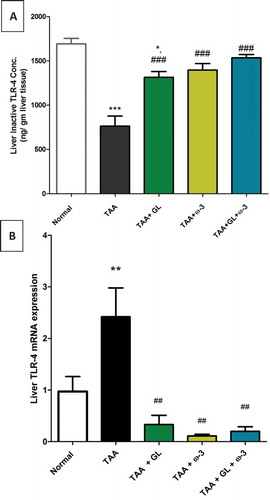
Administration of GL, ω-3 and their combination significantly increased hepatic inactive TLR-4 concentrations (P < 0.0005) ()), while significantly decreased hepatic gene expression of TLR-4 (P < 0.005) ()).
Liver necroinflammatory activity and fibrosis
Examination of TAA group showed moderate to severe necroinflammatory activity with average scores of (14.5) which characterized by marked piecemeal necrosis, zone 3 necrosis, multiple portal central bridging necrosis, frequent apoptosis, focal inflammation in addition to moderate and marked portal inflammation. TAA also significantly increased the amount of collagen deposition in liver tissue stained with Masson’s trichrome ( and ).
Figure 8. The left vertical panel showed marked necroinflammation in the TAA group that became reduced after combined treatment with (GL + ω-3) more than single treatment (arrows around bridging necrosis). The right panel showed increased collagen deposition in the TAA group with its reduction after combined treatment (GL + ω-3) more than single treatment (arrows around fibrous bridges).
Thioacetamide (TAA), Glycyrrhizin (GL), Omega-3 fatty acids (ω-3) and (GL + ω-3) groups (magnification ×100).
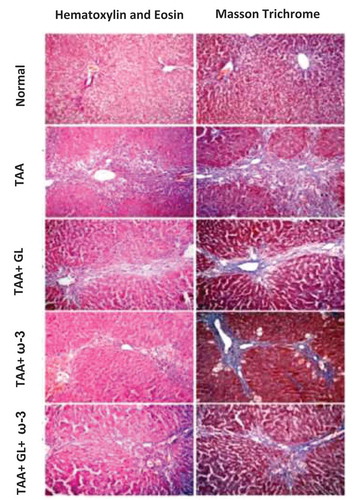
Figure 9. Change in liver necroinflammatory score and percentage of fibrotic area in rats after oral administration of glycyrrhizin (GL) (25mg/kg/day), omega-3 fatty acids (ω-3) (150 mg/kg/day) and their combination for 8 weeks along with thioacetamide (TAA) (200mg/kg twice weekly).
Values: (Mean ± SE). n = 8 rats per group** = significant against normal group at P < 0.005, # = significant against TAA group at P < 0.05, ## = significant against TAA group at P < 0.005.
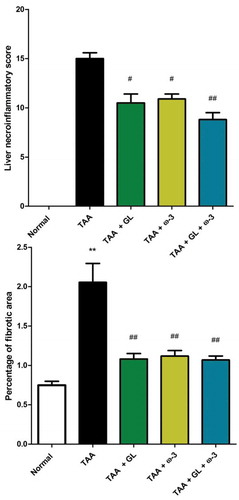
Administration of GL, ω-3 and their combination significantly protected the liver from hepatotoxic effects of TAA reflected by significant reduction of necroinflammation to (10.3) (p < 0.05), (10.5) (p < 0.05) and (9) (p < 0.005), respectively, and significant decrease in percentage of fibrotic area and collagen content compared with TAA group (P < 0.005), showing no significant change when compared with control group ( and ).
Correlation analysis of studied parameters
Liver inactive TLR-4 concentration was negatively correlated with liver MDA concentration (−0.740, P < 0.001), liver necroinflammatory score (−0.765, P < 0.001), percentage of the fibrotic area (−0.560, P < 0.001), serum AST activity (−0.692, P < 0.001) and serum total bilirubin concentration (−0.754, P < 0.001). On the other hand, Liver inactive TLR-4 concentration was positively correlated with serum albumin concentration (0.679, P < 0.001) and serum total protein concentration (0.640, P < 0.001) as shown in , .
Table 2. Correlational analysis of the studied parameters.
Figure 10. Significant negative correlation between liver inactive TLR-4 concentration and (a) Liver MDA concentration (r = −0.740), (b) Liver necroinflammatory score (r = −0.765) and (c) Liver percentageof fibrotic area (r = −0.560).
TLR-4, toll-like receptor-4; MDA, malondialdehyde
Discussion
The present study was carried out to evaluate the potential role of TLR-4 in the hepatoprotective, anti-oxidant and anti-inflammatory effects of GL, ω-3 and their combination by concomitant administration of these natural compounds with thioacetamide (TAA)-induced fibrosis in rats.
Thioacetamide is a potent hepatotoxin used for the induction of liver fibrosis in rats. TAA-induced hepatic injury showed lesions similar to those seen in most cases of human liver disease [Citation20]. In this study, TAA intoxication caused intense oxidative stress as evidenced by the dramatic increase in the hepatic MDA concentration. This was in consistence with a previous study [Citation16,Citation21]. Oxidative stress is believed to be a major participating factor in TAA-induced liver fibrosis. TAA induces cytotoxic injury through a two-step bioactivation which causes lipid peroxidation at the plasma membrane level [Citation20].
The results of this study indicated that GL and ω-3 protected the liver from the oxidative stress caused by TAA as they significantly decreased liver MDA content. A decrease of lipid peroxidation mediated oxidative stress may be a potential and effective strategy for the prevention and treatment of hepatic failure [Citation22,Citation23]. Thioacetamide-induced hepatotoxic effects were characterized by a significant increase in collagen deposition and fibrotic areas. Also, these findings were confirmed by a significant increase in serum ALT and AST activities and total bilirubin concentration as well as a significant decrease in serum albumin and total protein concentrations in the TAA group. These findings agree with the previous studies [Citation20,Citation21].
Our results indicated the hepatoprotective effects of GL and ω-3 as natural compounds decreased serum AST activity, total bilirubin concentration, necroinflammatory score, and liver fibrosis compared to the TAA group. They also increased the lowered albumin and total protein concentrations. These results are in consistency with the effect of GL against different models of hepatic injury and fibrosis [Citation17,Citation23,Citation24] and the effect of ω-3 against liver fibrosis [Citation25].
Both GL administration and ω-3 administration showed no significant changes in ALT activities compared with the TAA group. Other studies showed a significant decrease in serum ALT activity with either GL or ω-3 [Citation15,Citation23]. The decreased ALT activity in TAA group may be a result of massive necrosis and late stage of fibrosis, while decreased ALT activity in GL and ω-3 groups may be due to recovery, as decreasing ALT activity in hepatic injury occur both with recovery and with massive necrosis [Citation26,Citation27]. Also, there is no significant correlation between ALT activity and both liver fibrosis and liver necroinflammatory score. These may be explained as the enzyme activity does not reflect the severity of fibrosis and hence there is no significant correlation between serum ALT activity and histological changes [Citation27].
Our study elucidated the underlying molecular mechanism of TAA-induced hepatotoxicity through TLR-4 pathway. The results indicated that TAA significantly activated TLR-4 and increased its mRNA expression. These findings agree with other results [Citation8,Citation28]. So, we can conclude that TAA leads to activation of TLR-4 and to the production of pro-inflammatory and fibrogenic cytokines such as TNF-α, IL-1β, and nitric oxide. This inflammation leads to collagen deposition, necrosis, and fibrosis.
The aim of this study was using natural compounds: HMGB1 antagonist (GL) [Citation29–Citation31] and anti-inflammatory (ω-3) to inhibit TLR signaling pathway as a step for prevention of liver fibrosis. In the present study, GL and ω-3 increased liver inactive TLR-4 concentration and decreased TLR-4 mRNA expression effectively, indicating that they inhibited the TLR-4 signaling pathway. To our knowledge, this is the first study to elucidate the effect of GL and ω-3 on TLR-4 against experimentally TAA-induced liver fibrosis.
Recent studies found that GL is an anti-HMGB1 induced injury as GL directly blocks HMGB1 [Citation29–Citation31]and this is in agreement with the present study. Thus, GL suppressed the TLR-4 pathway, inflammatory mediators, lipid peroxidation, collagen deposition, and necroinflammation.
To our knowledge, this study is the first study to use the combination of GL and ω-3. The combined usage of GL and ω-3 caused a non-significant increase in the efficacy of GL and ω-3. This may be related to the high protection efficacy of either GL or ω-3 alone. In conclusion, the protection potency of either GL or ω-3 alone is nearly the same as their combination against liver fibrosis. Anti-oxidant properties of natural products such as GL and ω-3 may play a potential role to modulate the inflammation.
The role of inflammation and lipid peroxidation in collagen deposition, fibrotic areas and necroinflammation were also confirmed by the significant positive correlation between liver MDA concentration and both the percentage of the fibrotic area and necroinflammatory score. These results indicated the role of anti-inflammatory properties of both GL and ω-3 in association with anti-fibrotic properties.
Conclusion
The results of the current study supported the potential role of TLR-4 pathway in liver fibrosis and demonstrated the hepatoprotective effect of glycyrrhizin, omega-3 fatty acids and their combination against liver fibrosis as they significantly decreased both the fibrotic areas and the necroinflammatory scores. The mechanism behind hepatoprotective effects of glycyrrhizin and omega-3 fatty acids included suppression of oxidative stress and inhibition of TLR-4 pathway. So the hepatoprotective effects of glycyrrhizin, omega-3 fatty acids and their combination against TAA-induced fibrosis are mediated via its antioxidant, anti-inflammatory, and anti-fibrotic properties. The protection potency of either GL or ω-3 alone is nearly the same as their combination against liver fibrosis. We advise fulfilling some clinical studies on these natural compounds as a supplementary nutrient to protect against liver fibrosis.
Role of the funding source
The authors declare that they have no funding sources. The research was funded by the authors.
Ethical approval
The animal care and experiments described in this study complied with ‘Research Ethics Committee’ Faculty of Pharmacy, Mansoura University, Egypt which are in accordance with ‘Principles of Laboratory Animal Care’ (NIH publication No. 85–23, revised 1985).
Authors’ contributions
All authors read and approved the final manuscript.
Disclosure statement
No potential conflict of interest was reported by the authors.
References
- Lozano R, Naghavi M, Foreman K, et al. Global and regional mortality from 235 causes of death for 20 age groups in 1990 and 2010: a systematic analysis for the global burden of disease study 2010. Lancet. 2012;380:2095–2128.
- Schuppan D, Afdhal NH. Liver cirrhosis. Lancet. 2008;371:838–851.
- Blachier M, Leleu H, Peck-Radosavljevic M, et al. The burden of liver disease in Europe: a review of available epidemiological data. J Hepatol. 2013;58:593–608.
- Nagai Y, Akashi S, Nagafuku M, et al. Essential role of MD-2 in LPS responsiveness and TLR4 distribution. Nat Immunol. 2002;3:667–672.
- Loiarro M, Ruggiero V, Sette C. Targeting TLR/IL-1R signalling in human diseases. Mediators Inflamm. 2010;2010:674363.
- Jeong E, Lee JY. Intrinsic and extrinsic regulation of innate immune receptors. Yonsei Med J. 2011;52:379–392.
- Andersson U, Tracey KJ. HMGB1 is a therapeutic target for sterile inflammation and infection. Annu Rev Immunol. 2011;29:139–162.
- Bai T, Yang Y, Wu YL, et al. Thymoquinone alleviates thioacetamide-induced hepatic fibrosis and inflammation by activating LKB1-AMPK signaling pathway in mice. Int Immunopharmacol. 2014;19:351–357.
- Tolstikov GA, Baltina LA, Shul’ts EE, et al. [Glycyrrhizic acid]. Bioorganicheskaia khimiia. 1997;23:691–709.
- Kimura M, Moro T, Motegi H, et al. In vivo glycyrrhizin accelerates liver regeneration and rapidly lowers serum transaminase activities in 70% partially hepatectomized rats. Eur J Pharmacol. 2008;579:357–364.
- Sitia G, Iannacone M, Muller S, et al. Treatment with HMGB1 inhibitors diminishes CTL-induced liver disease in HBV transgenic mice. J Leukoc Biol. 2007;81:100–107.
- Kromhout D, de Goede J. Update on cardiometabolic health effects of omega-3 fatty acids. Curr Opin Lipidol. 2014;25:85–90.
- Marsman HA, de Graaf W, Heger M, et al. Hepatic regeneration and functional recovery following partial liver resection in an experimental model of hepatic steatosis treated with omega-3 fatty acids. Br J Surg. 2013;100:674–683.
- Calder PC. Omega-3 fatty acids and inflammatory processes. Nutrients. 2010;2:355–374.
- Esmat AY, Said MM, Soliman AA, et al. Bioactive compounds, antioxidant potential, and hepatoprotective activity of sea cucumber (Holothuria atra) against thioacetamide intoxication in rats. Nutrition. 2013;29:258–267.
- Zhao J, Wan X-Y, Luo M, et al. Antifibrotic effects of glycyrrhizin and matrine in vitro and in vivo. Biomed Preventive Nutr. 2012;2:132–137.
- Yokoyama M, Origasa H, Matsuzaki M, et al., E.P.A.l.i.s.I. Japan. Effects of eicosapentaenoic acid on major coronary events in hypercholesterolaemic patients (JELIS): a randomised open-label, blinded endpoint analysis. Lancet. 2007;369:1090–1098.
- Ishak K, Baptista A, Bianchi L, et al. Histological grading and staging of chronic hepatitis. J Hepatol. 1995;22:696–699.
- James J, Bosch KS, Aronson DC, et al. Sirius red histophotometry and spectrophotometry of sections in the assessment of the collagen content of liver tissue and its application in growing rat liver. Liver. 1990;10:1–5.
- Ile Gerilemesi OKFS. Regression of thioacetamide, alcohol and schistosomiasis induced liver fibrosis in mice by silymarin. Türk Biyokimya Dergisi [Turkish Journal of Biochemistry–Turk J Biochem]. 2008;33:131–137.
- Abo El-Magd NF, El-Karef A, El-Shishtawy MM, et al. Hepatoprotective effects of glycyrrhizinand omega-3 fatty acids on nuclear factor-kappa B pathway in thioacetamide-induced fibrosis in rats. Egypt J Basic Appl Sci. 2015;2:65–74.
- Tsuchiya D, Hong S, Matsumori Y, et al. Overexpression of rat heat shock protein 70 is associated with reduction of early mitochondrial cytochrome C release and subsequent DNA fragmentation after permanent focal ischemia. J Cereb Blood Flow Metab. 2003;23:718–727.
- Orazizadeh M, Fakhredini F, Mansouri E, et al. Effect of glycyrrhizic acid on titanium dioxide nanoparticles-induced hepatotoxicity in rats. Chem Biol Interact. 2014;220:214–221.
- Guo XL, Liang B, Wang XW, et al. Glycyrrhizic acid attenuates CCl(4)-induced hepatocyte apoptosis in rats via a p53-mediated pathway. World J Gastroenterol. 2013;19:3781–3791.
- Li YH, Yang LH, Sha KH, et al. Efficacy of poly-unsaturated fatty acid therapy on patients with nonalcoholic steatohepatitis. World J Gastroenterol. 2015;21:7008–7013.
- Tygstrup N, Ranek L, Assessment of prognosis in fulminant hepatic failure. Semin Liver Dis. 1986;6:129–137.
- Haber MM, West AB, Haber AD, et al. Relationship of aminotransferases to liver histological status in chronic hepatitis C. Am J Gastroenterol. 1995;90:1250–1257.
- Wu JB, Chuang HR, Yang LC, et al. A standardized aqueous extract of Anoectochilus formosanus ameliorated thioacetamide-induced liver fibrosis in mice: therole of Kupffer cells. Biosci Biotechnol Biochem. 2010;74:781–787.
- Lau A, Wang S, Liu W, et al. Glycyrrhizic acid ameliorates HMGB1-mediated cell death and inflammation after renal ischemia reperfusion injury. Am J Nephrol. 2014;40:84–95.
- Luo L, Jin Y, Kim ID, et al. Glycyrrhizin suppresses HMGB1 inductions in the hippocampus and subsequent accumulation in serum of a kainic acid-induced seizure mouse model. Cell Mol Neurobiol. 2014;34:987–997.
- Wu CX, He LX, Guo H, et al. Inhibition effect of glycyrrhizin in lipopolysaccharide-induced high-mobility group box 1 releasing and expression from RAW264.7 cells. Shock. 2015;43:412–421.