
 ?Mathematical formulae have been encoded as MathML and are displayed in this HTML version using MathJax in order to improve their display. Uncheck the box to turn MathJax off. This feature requires Javascript. Click on a formula to zoom.
ABSTRACT
Macrobenthic invertebrate’s species are differently sensitive to a biotic and biotic parameters in their environment. So they are used as bioindicators of stat and water quality of aquatic environment. The main objective of this research is using benthic invertebrates for biological assessment of water quality. Twenty-three stations along River Nile from Aswan to Cairo were selected for sampling of benthic macroinvertebrates. Benthic fauna were collected seasonally by a Naturalist Rectangle Dredge with a net 500 µm mesh size. During the monitoring period (four seasons), forty taxa were identified. They belong to benthos sensitive individuals (25%) and medium tolerant benthos (10%) and tolerant benthos individuals (65%). Relations between macrobenthic communities and circumstances of aquatic ecosystem have been lately used to perform the Biological Monitoring Water Quality (BMWQ) score to evaluate quality level in River Nile water. The total BMWQ (T-BMWQ) score and the average BMWQ (A-BMWQ) score are calculated, and their relations with MacArther, Margalef, Menhinick diversity indices and family richness are also examined. BMWQ scores are more subtle measures to assess the response of macroinvertebrates to organic pollution than diversity indices and total population density. However, the A-BMWQ score is more sensitive to changes in family composition than the T-BMWQ score, whereas T-BMWQ score is more subtle to family richness and size of sample. A-BMWQ score is suggested for the biological evaluation of freshwater quality. Also Trent Biotic Index (TBI) was calculated in each station. All these biological indices examined in this study using benthic macroinvertebrates proved that some stations in Nile River were classified as good water quality, most of studied stations were moderate water quality and very few stations were classified as poor water quality.
Introduction
Nile River is the longest river in the world. It runs from the lakes of Central Africa toward the north to Mediterranean Sea. Nile plays an important role in the life of Egyptians, in the river’s valley about 97% of Egypt’s population lives, 98% of water in Egypt comes from the Nile [Citation1] and it provides Egypt with 44.73% of its annual fish production (9.86% wild fisheries and 34.87% from fish farming) [Citation2]. Water pollution in River Nile caused by sewage, agriculture and industries affect aquatic community biodiversity and the species composition. The species composition reflects water pollution because the nature species changes to tolerant species [Citation3]. Cao et al. [Citation4] and Abdel Gawad [Citation5] reported that high levels of pollutants reduce biodiversity because of reducing the species to tolerant species. For determination anthropogenic and natural effects on water resources, biological methods are used because biota respond to any changes from multiple spatial or time scales integratively [Citation6]. Also, they save time and costs if compared with physico-chemical estimation of water quality [Citation7], which provide little prudence into the temporal variation of conditions.
Water quality bioassessment is deduced by several methods, the most common one, diversity indices of macrobenthic invertebrate community, as species richness, abundance; and multimetric indices of different macroinvertebrate taxa and multienvironmental factors [Citation8]. Macroinvertebrate taxa tolerance to pollution frequently depends on their life history characteristics and feeding behaviors [Citation9]. Some taxa are indicators of pollutions, survive in a certain level of water quality and cannot live in other levels of water quality. For example, the existence and abundance of Arachnida, Oligochaeta and Gastropoda are indicators of organic pollution [Citation10]. Some chironomid species are tolerant to pollution and can live in heavy polluted water [Citation11–Citation13].
Using biotic indices for pollution monitoring in rivers was developed in Europe and then in the United States. Indices have been developed by using many groups of organisms as, Protozoa [Citation14,Citation15]; Diatoms, Macrophytes and Fish [Citation16–Citation18]; Benthic invertebrates [Citation19–Citation23]. Macrobenthic invertebrates appears to be the best and preferred biological indicators for condition of aquatic ecosystem [Citation24,Citation25] then using this group in biotic indices facilitate the interpretation of great quantity of data obtained from the biological surveillance of water quality in fresh water [Citation24,Citation26]. Benthic invertebrates have been commonly regarded in this respect because they have several benefits including species diversity and habits. Many sedentary species can indicate effects at site of sampling. Respond to changes may occur for whole communities. Some species that have long life cycle can indicate pollution effects over time. Sampling of this group is easy and tools for collection are simple. Good taxonomic keys are present for identification of families [Citation27,Citation28].
The main purpose of this study was to assess the water quality biologically taking into consideration the presence, density and tolerance of macrobenthic invertebrate species. This study provides data about macrobenthic invertebrates as indicators of water quality in Nile River by calculating (1) some biotic indices as Trent Biotic Index (TBI), total biological monitoring water quality (T-BMWQ) and average biological monitoring water quality (A-BMWQ). (2) Diversity indices as MacArther, Margalef and Menhinick diversity indices. Also, the relations between the biotic and diversity indices were examined.
Materials and methods
Study area
The stretch of River Nile studied was about 1035 km from Aswan High Dam to El-Kanater Barrage in Cairo. Various levels of agricultural, domestic and industrial activities take place along River Nile, therefore some sites in the river are considerably polluted [Citation29]. Twenty-three stations were selected for sampling to cover the Nile in this area. The location of selected sampling stations and their key feature were shown in and .
Figure 1. Map showing sampling stations on River Nile.
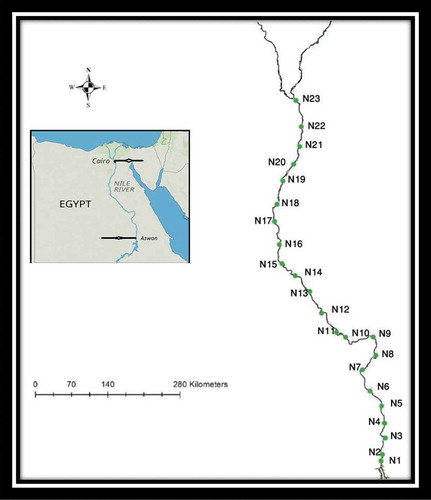
Table 1. Sampling stations description on the River Nile.
Sampling
Samples were collected for four seasons (autumn 2016, winter, spring and summer 2017). A Naturalist Rectangle Dredge (1 m * 1 m area with a net 500 µm mesh size) was used to collect the macrobenthic invertebrates. Each sample was washed in the field and preserved with 10% formalin solution. In the laboratory, each sample was sorted under stereoscopic microscope. The number of organisms of each species and the number of families at each sampling station were counted.
Biotic indices
Diversity indices and four biological (biotic) indices: Taxa richness (S), Trent Biotic Index (TBI), total BMWQ score (T-BMWQ) and average BMWQ score (A-BMWQ) were used for biological evaluation of water quality.
Diversity indices
Diversity at selected stations was calculated using MacArther, Margalef and Menhinick formulas
MacArthur’s diversity index [Citation30]
It depend on the relative abundance of each taxon in the community, and have been widely used in water pollution studies for evaluating changes in aquatic communities structure [Citation25].
Pi = relative abundance of each taxon; S = number of taxa recorded
The following two indices based on the number of specie (S) and the total number of organisms (N).
Margalef’s diversity index [Citation31]
Menhinick’s diversity index [Citation32]
Trent Biotic Index (TBI)
This index is widely useful for quick assessments and can indicate organic and nutrient pollution. Tolerance values of organisms range from 0 to 10 and defined as
Where F is the number of families, ni is the individuals number in each family, ti is the tolerance score of each family, and N is the total number of individuals in all the families [Citation33]. The tolerance scores of most families of macrobenthic invertebrates were found in Hilsenhoff [Citation33], and a few of families scores were found in Duan [Citation34]. According to the Stroud Water Research Center, TBI values from 0 to 3.75 indicate very good water quality, 3.76–5.0 good water quality, 5.1–6.5 indicate medium water quality and 6.6–10.0 indicate poor level of water quality.
Biological monitoring water quality (BMWQ score)
This is sensitive to changes in taxa composition and richness. The score values for families reflect their tolerance to organic pollution [Citation35]. The BMWQ score for families ranges between 1 and 15 [Citation35,Citation36]. The value of total biological monitoring water quality (T-BMWQ) is obtained by summing all families BMWQ scores that recorded in the sample. The average biological monitoring water quality (A-BMWQ) score is calculating by dividing T-BMWQ value by the number of families. According to Camargo [Citation35] ‘A-BMWQ values ≥12 excellent water quality, 10–12 indicate good water quality, 7–10 moderate water quality, 4–7 poor water quality and < 4 very poor water quality’.
Results and discussion
Community composition of macroinvertebrates in River Nile
According to Environmental Protection Agency- USA (EPA-USA) benthic invertebrates have been classified into three main groups based on their tolerance level (). This classification was used to assess the water quality level in River Nile.
Table 2. Aquatic biological indicators of macrobenthic invertebrates based on their tolerance level (EPA-USA).
Based on the individual percentages and its presence or absence in the collected samples, the total value and percentages of the three main groups in the Nile River was calculated. (1) Sensitive benthos individuals, (2) medium benthos tolerant individuals and (3) tolerant benthos individuals (). From the calculations the highest percentage was for tolerant individuals 65% and this group was consisted of gastropods, the major group with 9570 individuals, Annelida with 2434 individuals and Diptera/Chironomidae with 3308 individuals (). Medium benthos tolerant individuals constituted about 10% and it consisted of insect/Odonata 170 individuals, crustaceans 141 individuals and Diptera/Tipulidae with 2127 individuals. The third one, sensitive benthos individuals constituted about 25% and it consisted of group of three orders of insects, Ephemroptera, Plecoptera, Tricoptera (EPT) with 320 individuals and Mollusca/bivalves 5576 individuals ().
Figure 2. Benthic group’s percentage classified according to their tolerance in River Nile.
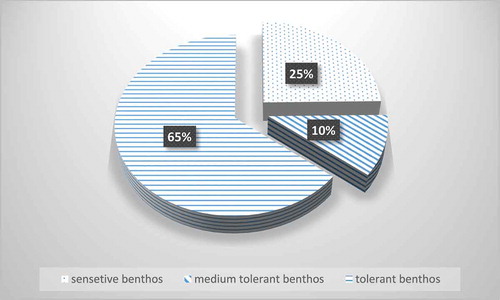
Table 3. Total individuals number and percentages of groups in the whole area of investigation.
There were differences among the different stations. Stations N1, N2, N3, N4, N5, N6, N7 have higher percentages of tolerant individuals than the other stations (). These differences express a better quality of water in stations from N8 to N23 than the others. This may be due to effluent of Kema factory for fertilizers and chemicals and sugar factories at southern stations N2, N3, N5, N7. Stations N15, N16 and N18 at El Qusea, El Maesara and Matai respectively have low percentage of tolerant benthos and have high percentage of sensitive benthos (). Thus, they may be classified as a clean water. This agrees with Keçi et al. [Citation37] who found that a sampling station in Prespa Lake basin (Albania) has higher total tolerant individuals than another one at the same lake and referred these differences between the two stations express a better quality of water in the second station than in first one. EPT have high sensitivity to pollution [Citation38]. Keçi et al. [Citation39] found that sensitive benthos shows low tolerance toward water pollutants scored and referred that to these organisms may occur in clean and well oxygenated waters.
Table 4. Total number of individuals and percentages of three main groups in each station.
Trent biotic index (TBI)
According to Trent Biotic index, densities of each taxonomic group at each site in Nile River listed in . Abundance of plecopterans, ephemeropterans, coleopterans, trichopterans, decreased or absent at most sampling stations, whereas tubificid worms and chironomid larvae increased and abundant at sampling sites. The total nitrogen (TN) ranged from 0.334 to 1.189 mg/l and total phosphate (TP) ranged from 0.044 to 0.073 mg/l in the area investigated. This increase in concentrations of N and P compounds could be the important causes for ‘potamonization’ (enhancement of potamic conditions) in macrobenthic community structure because some effluents cause a real organic pollution generating high concentration in compounds of N and P [Citation35]. The siltation of suspended solids (mainly organic matter) credit on the stream bottom would be the main cause of changes in the macrobenthic community structure where the tubificid worms and chironomids larvae were dominant. These two groups (tubificid and chironomids) of macrobenthic invertebrates have been recorded to be distinctive organisms in this sediment type [Citation40].
Table 5. Nile Pollution tolerance values for each group, the total tolerance scoring taxa and resulting Trent Biotic Index (TBI) Scores for each station.
By using Trent biotic index, TBI in the whole area was 6.27, so the water in River Nile from Aswan to Cairo was classified as medium water quality according to the Stroud Water Research Center [Citation39]. This means, some organic pollution found. shows TBI for each station (23 stations), it was found that TBI was equal or more than 6.6 in stations N2, N3, N8, N10, N12, N14 and N18, consequently, these stations were classified as poor water quality. This may be due to pollution from Kema Factory at station N2, and Sugar factories at station N3, effect of tourism and organic wastes entering the Nile from sewage drain at other stations. The lowest value of TBI (5.0) was calculated at station N13 and it was classified as good water quality. Other stations N1, N4, N5, N6, N7, N9, N11, N15, N16, N17, N19, N21, N22 and N23 were classified as medium water quality level where TBI ranged between 6.2 and 6.6 ().
Biological monitoring water quality (BMWQ)
and list BMWQ score for each family [Citation35] and the families recorded in this study which used to calculate T-BMWQ and A-BMWQ for each station respectively. Generally, species richness and species composition are the most affected biological parameters by anthropogenic pollution [Citation24], so the biological indices must be affected by changes in these two previous parameters. T-BMWQ and A-BMWQ scores appear to be more subtle measurements to measure macroinvertebrates response to pollution in freshwater than total population density and diversity indices, showing high sensitivity to any change in family composition and family richness. Camargo [Citation35] stated ‘The A-BMWQ appears to be more sensitive to the potamonization in family composition than the T-BMWQ, whereas this latter score is more sensitive to family richness and sample size’. A-BMWQ shows low values at stations N2, N3, N8, N10, N18, N19 (≤7) () therefore the water at these sites classified as poor water quality. A-BMWQ was more than 7 in all remaining stations () so, they were classified as moderate water quality according to Camargo [Citation35]. The use of A-BMWQ and T-BMWQ are recommended for assessment of freshwater quality biologically through organic pollution studies. Less efforts with more information is obtained by using A-BMWQ regarding to other scores. A similar deduction was reported by Balloch et al. [Citation41] and Armitage et al. [Citation42]. Classification of water in the studied stations by BMWQ was similar with the results of classification by TBI in this area.
Table 6. Biological monitoring water quality score (BMWQ), a score for each taxon recorded in River Nile [Citation35].
Table 7. Taxa recorded at each station in River Nile for biological data.
Table 8. Values of indices and biological parameters estimated at each sampling station.
Diversity indices
Positive and significant correlation coefficient (r = 0.7, P = 0.05) between T-BMWQ and A-BMWQ, and between these two scores and family richness (r = 0.98 and 0.56 respectively) were calculated. Positive significant correlation between Margalef’s diversity index and T-BMWQ, A-BMWQ (r = 0.87 and 0.52 respectively, P = 0.05) were detected. Margalef’s diversity index appeared to be the most sensitive diversity index in assessing structural changes in macrobenthic communities. However, the relation between the two indices (T-BMWQ and A-BMWQ) and MacArthur’s index were positive and lower (r = 0.43 and 0.42 respectively). Thus Margalef’s index is nearly similar to that of family richness and biotic indices. This might indicate that Margalef’s index is more affected by changes in the number of species than MacArthur’s index and Menhinick’s diversity index. In contrast, MacArthur’s diversity index appeared less affected by the number of species and more affected by relative abundances of species. This result has been also reported by some investigators [Citation41,Citation43–Citation45].
Conclusion
It is concluded that using macrobenthic invertebrates in biotic indices appears to be among the best indicators and have been extensively regarded in this regard.
Diversity and variety of benthic macroinvertebrates (40 species) demonstrated in the River Nile from Aswan to Cairo was not much. This may be due to most of the Nile is fast flowing and coarser sediment in some stations constitute an unstable inhospitable habitat. Studies of organic pollution on family richness in the region of the Nile below Cairo, that receives large amount of wastes from sewage drains, will be needed to discuss in the future studies.
Disclosure statement
No potential conflict of interest was reported by the author.
References
- Said R. The geological evolution of the River Nile. New York: Springer-Verlag; 1981. p. 151.
- GAFRD (General Authority of Fish Resources Development). Statistics of fish production for the year 1999.
- Xu M, Wang Z, Duan X, et al. Effects of pollution on macroinvertebrates and water quality bio-assessment. Hydrobiologia. 2014;729:247–259.
- Cao Y, Bark AW, Williams WP. Measuring the responses of macroinvertebrate communities to water pollution: a comparison of multivariate approaches, biotic and diversity indices. Hydrobiologia. 1996;341:1–19.
- Abdel Gawad SS. Concentrations of heavy metals in water, sediment and Mollusc Gastropod, Lanistes carinatus from Lake Manzala, Egypt. Egypt J Aquat Res. 2018;44(2):77–82.
- Weigel BM, Robertson DM. Identifying biotic integrity and water chemistry relations in nonwadeable rivers of Wisconsin: toward the development of nutrient criteria. Environ Manage. 2007;40:691–708.
- Bode RW, Novak MA, Abele LE. Quality assurance work plan for biological stream monitoring in New York State. Albany, NY: NYS Department of Environmental Conservation; 1996. p. 89.
- Gheteu D, Costin H. Water quality assessment using benthic macroinvertebrates in wetlands and ponds: preliminary study case of Jijia and Miletin Ponds (ROSPA0042). Recent researches in environment. Energy Plann Pollut. 2011;8:111–114.
- Giudici MN, Migliore L, Gambardella C, et al. Effect of chronic exposure to cadmium and copper on Asellus aquaticus (L.) (Crustacea, Isopoda). Hydrobiologia. 1988;157:265–269.
- Nadushan RM, Ramezani M. Bioassessment of Kordan stream (Iran) water quality using macro-zoobenthos indices. Int J Biol. 2011;3:127–134.
- Abdel-Gawad SS. Studies on benthic invertebrates of Nile River at Helwan region. Ph. D Thesis 2001, Faculty of Science, Zoology Department, Mansoura University.
- Langdon PG, Ruiz Z, Broderson KP, et al. Assessing lake eutrophication using chironomids: understanding the nature of community response in different lake types. Freshwater Biol. 2006;51:562–577.
- Abdel-Gawad SS, Mola HRA. Macrobenthic invertebrates in the main channel of Lake Nasser, Egypt. Egypt J Aquat Res. 2014;40:415–423.
- Sla´dacek V. Continental systems for the assessment of river water quality. In: James A, Evison L, editors. Biological indicators of water quality: chap.3. Chichester, England: John Wiley; 1979.
- Jiang JG, Shen YF. Development of a biotic index using the correlation of protozoan communities with chemical water quality. N Z J Mar Freshwater Res. 2003;37:777–792.
- Plafkin JL, Barbour MT, Porter KD, et al. Rapid bioassessment protocols for use in streams and rivers: benthic macroinvertebrates and fish. EPA/444/4– 89/001. 1989 Office of Water Regulations and Standards. U. S. Environmental Protection Agency,Washington.
- Iliopoulou-Georgudaki J, Kantzaris V, Katharios P, et al. Application of different bioindicators for assessing water quality: a case study in the rivers Alfeios and Pineios (Peloponnisos,Greece). Ecol Indic. 2003;2:345–360.
- Lainé M, Morin S, Tison-Rosebery JA. Multicompartment approach—diatoms, macrophytes, benthic macroinvertebrates and fish–to assess the impact of toxic industrial releases on a small French river. Plos One. 2014;9(7):1–15.
- Fishar MR, Williams WP. The development of a biotic pollution index for the River Nile in Egypt. Hydrobiologia. 2008;598:17–34.
- Fishar MR, Thorne R, Williams WP. Physico-chemical conditions and macroinvertebrate fauna in the River Nile from Aswan to Cairo. Afr J Aquat Sci. 2006;31:247–259.
- Wronski T, Dusabe MC, Apio A, et al. Biological assessment of water quality and biodiversity in Rwandan rivers draining into Lake Kivu. Aquat Ecol. 2015;49:309–320.
- Kabore I, Moog O, Alp M, et al. Using macroinvertebrates for cosystem health assessment in semi-arid streams of Burkina Faso. Hydrobiologia. 2016;766:57–74.
- Tagliaferro M, Pascual M. First spatio-temporal study of macroinvertebrates in the Santa Cruz River: a large glacial river about to be dammed without a comprehensive pre-impoundment study. Hydrobiologia. 2017;784:35–49.
- Hellawell JM. Biological indicators of freshwater pollution and environmental management. London: Elsevier Applied Science Publishers; 1986.
- Mahler RL, Barber ME. Using Benthic Macroinvertebrates to assess water quality in 15 watersheds in the Pacific Northwest, USA. Int J Sus Dev Plann. 2017;12:51–60.
- Washington HG. Diversity, biotic and similarity indices. A review with special relevance to aquatic ecosystems. Water Res. 1984;18:653–694.
- Balderas ECS, Grac C, Berti-Equille L, et al. Potential application of macroinvertebrates indices in bioassessment of Mexican streams. Ecol Indic. 2016;61:558–567.
- Abbaspour F, Mirdar Harijani J, Gharaei A, et al. Biological assessment of the Tang Sorkh River (Iran) using benthic macroinvertebrates. Iran J Fish Sci. 2017;16(3):1008–1020.
- EEAA (Egyptian Environmental Affairs Agency). Piloting the use of Egyptian systems to address environmental issues in the proposed World Bank-Assisted Egypt Pollution Abatement Project II, 2005; Safeguards Diagnostic Review.
- MacArthur RH. Geographical ecology. New York: Patterns in the Distribution of Spec &s, Harper and Row, Publishers; 1972.
- Margalef R. Information theory in ecology. General Syst. 1958;3:36–71.
- Menhinick EF. A comparison of some species-individuals diversity indices applied to samples of field insects. Ecology. 1964;45(4):859–861.
- Hilsenhoff WL. Rapid field assessment of organic pollution with a family-level biotic index. J North Am Benthol Soc. 1988;7:65–68.
- Duan XH Ecological impacts of water and sediment transportation on macroinvertebrate community in Rivers. Doctoral dissertation, Tsinghua University, Beijing 2009: 180–185. (in Chinese).
- Camargo LA. Macrobenthic surveys as a valuable tool for assessing fresh water quality in the Iberian Peninsula. Environ Monit Assess. 1993;24:71–90.
- Chesters RK. Biological monitoring working party. The 1978 National testing exercise, department of the environment, water data unit. Tech Memorandum. 1980;19:1–37.
- Keçi E, Paparisto A, Hamzaraj E, et al. Biological assessment of water quality in the National Park of Prespa Lake using macroinvertebrates as bioindicators. Int J Trop Insect Sci. 2011;6:1–8.
- Davies PJ, Wright IA, Findlay SJ, et al. Impact of urban development on aquatic macroinvertebrates in south eastern Australia: degradation of in-stream habitats and comparison with non-urban streams. Aquat Ecol. 2010;44:685–700.
- Keçi E, Paparisto A, Pepa B. Biological assessment of water quality in Ishmi River in Albania and benthic invertebrate fauna composition, during 2012. Int J Eng Sci Innovative Technol (IJESIT). 2013;2(4):485–490.
- Markmann EN. Biological effects of effluents from Danish fish farms. EIFAC Teehnical Paper. 1982;41:99–102.
- Balloch D, Dames CE, Jones FH. Biological assessment of water quality in three British Rivers, the North Esk (Scotland), the Ivel (England) and the Taf (Wales). Water Pollut Control. 1976;75:92–114.
- Armitage PD, Moss D. Wright JF and Furse MT. Macroinvertebrates over wider range of unpolluted running –water sites. Water Res. 1983;17(3):333–347.
- U.S.E.P.A. community structure and diversity indices. Corvallis, OR (USA): U.S. Environmental Protection Agency; 1972.
- Hughes BD. The influence of factors other than pollution on the value of Shannon’s diversity index for benthic macroinvertebrates in Streams. Water Res. 1978;12:359–364.
- Magurran AE. Ecological diversity and BS. Measurement. Princeton, New Jersey: Princeton University Press; 1988.