
 ?Mathematical formulae have been encoded as MathML and are displayed in this HTML version using MathJax in order to improve their display. Uncheck the box to turn MathJax off. This feature requires Javascript. Click on a formula to zoom.
ABSTRACT
A new bidentate (E)-2-((3-(benzyloxypyridinylimino) methyl)-6-methoxyphenol (L) and its complexes such as [Cu(L)2] (C1), [Cu(L)(Phen)] (C2), [Co(L)2] (C3), [Co(L)(Phen)] (C4), [Ni(L)2] (C5), [Ni(L)(Phen)] (C6), [VO(L)2] (C7) and [VO(L)(Phen)] (C8), (L = Schiff base derived from 2-amino-3-benzyloxypyridine and 3-methoxy salicylaldehyde, Phen = 1, 10-phenanthroline) were synthesized and the prepared complexes were characterized by different analytical techniques elemental analysis, magnetic moment, molar conductance, infrared spectra, 1H and 13C NMR, mass, electronic absorption and Thermogravimetric Analysis (TGA). Electron Paramagnetic Resonance (EPR) spectrum of Cu(II) and VO(IV) complexes are studied. The synthesized compounds C1–C8 were primarily screened for their in vitro anti-microbial activities against gram positive, gram negative bacteria and fungi. The remarkable antimicrobial activity results from complexes C-C8. The interaction between the newly prepared ligand and Cu(II), Co(III), Ni(II) and VO(IV) complexes with calf‐thymus DNA (CT‐DNA) was achieved by absorption, fluorescence, and viscosity measurements. The binding of metal complexes with BSA (bovine serum albumin) was reported by the multi spectroscopic methods. The results illustrated that the C1–C8 complexes can significantly interact with the DNA via intercalation mode and a static quenching is reported for BSA. As a result of this the deformity in secondary structure of BSA occurs.
Introduction
A Schiff base acts as a flexible-dentate ligand and often coordinates across the O-atom of the de–protonated phenolic group and the N- atom of imine group. The imine base is found to be a competent ligand, which permits effortless artificial linkage of diverse functional groups with N-terminal to generate a variety of multidentate metal complexes [Citation1,Citation2].
Pyridine derivatives have been of huge significant because of their participation in natural and synthetic organic chemistry. Several products that hold a pyridine subunit revealed numerous biological activities. So the pyridine containing Schiff bases are supposed to have biological efficacies possessing antimicrobial, antibacterial, antifungal, antitumor, anti-inflammatory, anticonvulsant and anti-HIV activities [Citation3–5].
However, few studies on the interaction between Schiff base complexes and DNA (or BSA) were reported. An experiment on the DNA binding properties of metal complexes is a leading subject of bioinorganic chemistry since it provides the development of metal-based drugs [Citation6,Citation7].
Metal binding with biological macromolecules control the conformations and coordination environment. Transition metal complexes interaction with DNA provides a rational route toward the drug design and tools for molecular biology. Based on the nature of ligand and oxidation states of transition metal complex bind covalently or noncovalently and cleave DNA oxidatively at biological pH, such interactions with DNA are explored in the development of newer drugs with high efficiency and efficacy. The noncovalent binding of metal complexes to DNA can occur through various modes like intercalation, groove binding, electrostatic interaction and partial intercalation for a planar ligand, cations, sterically demanding ligand and incompletely planar ligands, respectively [Citation8–10].
The discussion in this paper is limited to antimicrobial studies, DNA binding and BSA binding of copper metal complexes. Major proteins occur in the blood circulatory systems are serum albumin, which facilitates the arrangement and transportation of different small molecules to very specific targets. BSA has been utilized as a model of protein because of its water-soluble behavior, excellent binding characteristics and structural similarity to serum albumin of human. The binding studies of small molecules to serum albumins are the essential part of the measure of therapeutic efficacy of drugs. Thus, these types of experiments are useful in life science, chemistry and medicine [Citation11–14].
As the effort toward the synthesis of metal based therapeutic agents, here we report the preparation and characterization of new complexes as with a Schiff base ligand: (E)-2-((3-(benzyloxypyridinylimino) methyl)-6-methoxyphenol (L). Various spectral (FT-IR, UV-Vis, fluorescence) and TGA technique were employed to characterize the prepared complexes. The ligand L and its Cu(II), Co(III), Ni(II) and VO(IV) complexes as well as their in vitro bioactivity such as antimicrobial, interaction with BSA and calf thymus DNA (CT‐DNA) are described here.
Experimental
Materials and methods
Commercially available reagents were purchased and used as such. 1,10-phenanthroline, CuCl2·2H2O, CoCl2.6H2O, VOSO4.2H2O and NiCl2.6H2O, (Merck Private Limited, Mumbai) were procured. Precision Digital Melting point apparatus for recording Melting point (uncorrected) and Perkin Elmer 240 CHN-analyzer for elemental analysis were used. For recording 1H and 13C NMR, Varian-400 MHz spectrometer with TMS (Tetra methyl silane) as a standard was utilized. Mass spectroscopic analysis was performed using a 2010 EV LC-MS Shimadzu spectrometer. Infrared spectra of newly prepared complexes were measured by Perkin–Elmer 783 spectrophotometer in 4000–400 cm−1 range. Molar conductance of the compounds in ~10−3 M Dimethyl sulfoxide (DMSO) solution was recorded using an Elico Cm-180 conductometer. DU 730 ‘Life Science’ spectrophotometer (M/S Beckman coulter, USA) was used to get the electronic spectra. Copper (II) complexes and oxidovanadium (IV) were studied to record for their ESR spectra scanned on a JEOL X-Band at 77 K under nitrogen (IIT, Mumbai) with TCNE (tetracyanoethylene) as the g-marker. Thermogram of compounds were measured in nitrogen atmosphere (TGA Q50 instrument) keeping the maximum temperature at 800°C with the heating rate at 10°C/min. Shimadzu spectrofluorophotometer, with a Model RF-5301P associated with Xenon lamp (150-W) and 1 cm path length quartz cell at a slit width of 5.0 nm were used to record fluorescence spectra. Bovine serum albumin (BSA) was procured from Sigma-Aldrich and used as supplied. Ethidium bromide (EB) and CT-DNA were obtained from Sigma Ltd. and both were used as supplied.
Synthesis of ligand and its complexes
Synthesis of (E)-2-((3-(benzyloxypyridinylimino) methyl)-6-methoxyphenol (L)
A solution of 2-amino-3-benzyloxypyridine (0.002 mol) in ethanol was mixed with an ethanolic solution of 3-methoxy salicylaldehyde (0.002 mol) in presence of catalytic amount of acetic acid (2–3 drops). The above mixture was refluxed at 70°C for 7 h and then cooled to RT (room temperature). The formed ligand was collected on filtration, and the ligand was dried using anhydrous CaCl2 in a desiccators. is the schematic representation of synthesis of Schiff base ligand.
Figure 1. Schematic representation of synthesis of Schiff base ligand
Ligand (L): Yield 85%, mp = 118-120°C. Anal. Calcd for C20H18N2O3 (%) C, 71.84; H, 5.43; N, 8.38; O, 14.35; Found C, 71.57; H, 5.15; N, 8.13; O, 14.17. MS (m/z): 334[M+]; FTIR ʋ (cm−1); ν (OH) 3380, ν (C = N) 1609; 1 H NMR (400 MHz, CDCl3); δ = 9.40(s, HC = N), 14.17(s, Ph-OH), 6.80–8.05(m, Ar–H), 5.26(-CH2-O), 3.91(CH3,s,meta to methoxy); 13C NMR (400 MHz, CDCl3); δ = 162.119, 155.122,149.036, 148.194, 140.051, 136.113, 128.714, 127.545, 126.976, 124.707, 123.091, 121.596, 119.524, 118.909, 117.870, 115.047, 77.293, 76.982, 76.663, 50.128. UV-Vis (DMSO): λmax = 281,346 nm.
Synthesis of 1:2 ratio complexes C1, C3, C5 and C7
Mix hot ethanolic solution of ligand L (2 mmol) and an ethanolic solution of each of the metal salts (1 mmol) separately. The mixture of each was heated for 7 h at 80°C and the same was being cooled to room temperature. The obtained complex in each case was filtered and then washed with ethanol. The same was dried using CaCl2 in vacuum.
Complex C1: Yield: 73%. Anal. Calcd for [CuC40H38N4O8] (%) C, 62.69; H, 5.00; N, 7.31; O, 16.70; Found C, 62.27; H, 4.78; N, 7.05; O, 16.55. mp = 289–291°C. IR (ʋmax./cm−1); (HC = N) azomethine 1564; M-O 477; M-N 517
Complex C3: Yield: 78%. Anal. Calcd for [CoC40H36ClN4O7] (%) C, 61.66; H, 4.66; N, 7.19; O, 14.37; Found C, 61.47; H, 4.43; N, 7.07; O, 14.13. mp = 276–279°C. IR (ʋmax./cm−1); (HC = N) azomethine 1579; M-O 459; M-N 533
Complex C5: Yield: 81%. Anal. Calcd for [NiC40H38N4O8] (%) C, 63.09; H, 5.03; N, 7.36, O, 16.81; Found C, 62.93; H, 4.87; N, 7.22; O, 16.67. mp = 293–295°C. IR (ʋmax./cm−1); (HC = N) azomethine 1577; M-O 468; M-N 540
Complex C7: Yield: 83%. Anal. Calcd for [VC40H34ClN4O4] (%) C, 65.48; H, 4.67; N, 7.64; O, 15.27; Found C, 65.39; H, 4.49; N, 7.57; O, 15.15. mp = 297–299°C. IR (ʋmax./cm−1); (HC = N) azomethine 1598; M-O 493; M-N 529
Synthesis of 1:1:1 ratio complex C2, C4, C6 and C8
To a solution of L (1 mmol) in hot ethanol was added to an ethanolic solution of each of the metal salts (1 mmol) under stirring for 30 min. To this was added 1 mmol of phenanthroline monohydrate (Phen) and the resulting solution was stirred for 7 h at 70°C on water bath and then kept at room temperature. The formed precipitate was separated out, filtered and then washed with ethanol. The obtained complexes were dried using CaCl2 in vacuum.
Complex C2: Yield: 80%. Anal. Calcd for [CuC32H27ClN4O4] (%) C, 60.95; H, 4.32; N, 8.88; O, 10.15; Found C, 60.76; H, 4.27; N, 8.54; O, 10.02. mp = >300°C. IR (ʋmax./cm−1); (HC = N) azomethine 1571; M-O 462; M-N 525
Complex C4: Yield: 82%. Anal. Calcd for [CoC32H25Cl2N4O3] (%) C, 59.74; H, 3.92; N, 8.71: O, 7.46; Found C, 53.52; H, 3.77; N, 8.62; O, 7.22. mp = >300°C. IR (ʋmax./cm−1); (HC = N) azomethine 1585; M-O 474; M-N 537
Complex C6: Yield: 86%. Anal. Calcd for [NiC32H27ClN4O4] (%) C, 61.42; H, 4.35; N, 8.95; O, 10.23; Found C, 61.39; H, 4.18; N, 8.57; O, 10.09. mp = >300°C. IR (ʋmax./cm−1); (HC = N) azomethine 1581; M-O 484; M-N 545
Complex C8: Yield: 89%. Anal. Calcd for [VC32H25N4O4] (%) C, 66.21; H, 4.34; N, 9.65; O, 11.02; Found C, 66.08; H, 4.27; N, 9.57; O, 10.87. mp = >300°C. IR (ʋmax./cm−1); (HC = N) azomethine 1593; M-O 470; M-N 523
In-vitro antimicrobial screening
In-vitro antimicrobial screening effects of the ligand L and its metal complexes were subjected to check their efficacies by disc diffusion method. Gentamicin and Fluconazole drugs are used as standards in these experiments. All the measurements were made in triplicate and record the average inhibition zone. To get the required test solutions, the compounds were dissolved in DMSO. The compounds which show significant activities were selected to determine the minimum inhibitory concentration (MIC) using well-diffusion technique.
BSA interaction studies
The binding characteristic between prepared metal complexes and BSA has been studied by UV-Vis and fluorescence experiments. The working concentration of BSA was prepared by taking an appropriate amount of BSA in buffer (containing 5 mM Tris-HCl/50 mM NaCl at pH 7.2) and it was stored at 4°C for further use. In fluorescence experiment, BSA was excited at 280 nm while the emission was recorded in the range 300–400 nm using a slit width of 5 nm. In this study, concentration of the BSA was constant with varying amounts of complexes. BSA concentration was determined by applying UV-Vis spectra [Citation15]. For recording UV-Vis spectra, BSA concentration was kept constant with variable concentration of complex in the range 200–800 nm.
DNA binding studies
DNA binding was evaluated by methods of absorption, emission spectroscopy and viscosity measurements. The concentration of DNA was determined with its solution (ε260 is 6600 L mol−1 cm−1) [Citation16]. The interaction of DNA with the prepared complexes was performed in the buffer solution. The standard solution of CT-DNA was prepared in Tris-buffer and stored at 4 °C before being it used in four days.
UV-Vis absorption spectra were recorded by maintaining the metal complexes constant and varying the CT-DNA concentration. Complexes were dissolved in less than 4% DMSO because of the fairly soluble nature of the complexes in the buffer solution and after that suitably diluted with Tris-HCl buffer to the required concentration for all the experiments.
The complex solution was added to a mixture of CT-DNA and EB for recording fluorescence spectra. In this experiment, CT-DNA and EB concentrations were kept constant, whereas variable concentrations of prepared complexes were used. After 15 min, the emission spectra were recorded from 500 to 850 nm with maintaining excitation at 450 nm and set slit width of both to 5 nm.
Viscosity parameters were performed using a viscometer that was kept at 27 ± 0.1°C in a controlled thermostat. The flow time was measured in triplicate for each sample and flow time was calculated. The following equation is used to calculate the relative viscosity ղ,
where t is the flow time of DNA in the presence and absence of the complex andis the flow time of buffer solution, respectively.
Results and discussion
All the synthesized metal complexes of the Schiff base, L in this study are colored, non hygroscopic solids, stable in air and moisture without any kind of decomposition even after several months; remarkable soluble in DMSO and DMF but insoluble in water and many common organic solvents. Mass spectrum, 1H NMR, 13C NMR and FT-IR spectrum of L are depicted in . The donor sites of ligand were confirmed by FTIR spectra. The studied experimental data reveals that the stoichiometry of C1, C3, C5 and C7 to be 1:2 (M:L) and for C2, C4, C6 and C8 to be 1:1:1 (metal: ligand: phen). The concentrations of 10−3 M solutions of C1-C8 in DMF were used to record their conductance values, that are in the range 7.97–17.13 Ohm−1 cm2 mol−1 indicate that they are non-electrolytic in nature. Several attempts were unsuccessful for the growth of a single crystal suitable for X-ray crystallography. However, the results from analytical, spectroscopic and magnetic data are consistent with the proposed formula.
Figure 2. MS spectrum of L
Figure 3. 1H-NMR spectrum of L
Figure 4. 13C-NMR spectrum of L
Figure 5. FT IR spectrum of L
Infrared spectra
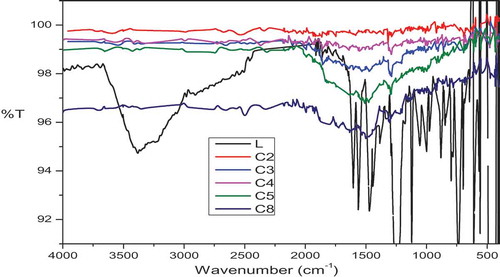
The IR spectra of a new Schiff base, L and its metal complexes C1-C8 () are tabulated in order to determine the coordination mode of the ligand. Upon complexation, a band at 1609 cm−1 of Schiff base is lowered at 1564–1598 cm−1 indicate that the participation of azomethine group in the complex formation. The phenolic -OH stretching frequency at 1267 cm−1 found in the spectrum of the Schiff base, whereas in complexes, this band is shifted to different frequency showing very strong bands around 1237–1260 cm−1 region. The presence of coordinated/lattice held water molecules are observed by broad bands around 3497–3505 cm−1 [Citation17]. The characteristic frequency for ligand corresponding to ether C-O showing a band around 1230 cm−1, which is unaltered in the spectra of complexes. It shows that the ether C-O is not involved in the coordination [Citation18]. The bands observed for the complexes between 517–545 and 459–493 cm–1 were metal sensitive and are assigned to ν(M–O) and ν(M–N) respectively [Citation19]. In addition, the oxidovanadium complexes C7 and C8 shows a band at 985 and 963 cm–1 attributed to V = O frequency [Citation20].
Table 1. FTIR spectral data of the Schiff base ligand [L] and its metal complexes
Figure 6. IR spectra of L and its metal complexes
Electronic spectra and magnetic moment studies
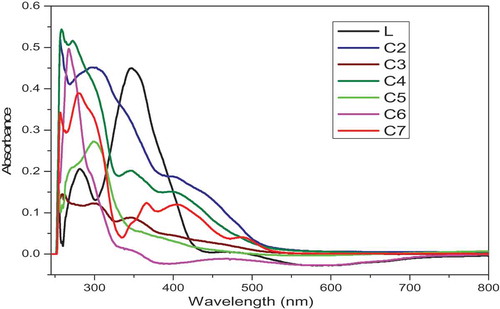
presents the UV–Vis spectra of complexes in DMSO were recorded in the range of 200–800 nm. The UV-vis spectra of L showed two bands at 281 and 346 nm. The first band can be attributed to π→π* transition within an aromatic ring, whereas the second band would be due to n→π* transition within -C = N group. The electronic spectra of Cu(II) complexes C1 and C2 are recorded at room temperature, in DMSO solution, shows broadband in the region 254–300 and 402–510 nm with an absorption maxima at 445 nm, which may be assign to 2B1 g →2A2 g (dx2−y2 →dz2), 2B1g→2B2g (dx2‐y2→dzy) and 2B1g→2Eg (dx2‐y2→ dzy, dyz) transition and it is in conformity with octahedral geometry. The magnetic moment values of all Cu(II) complexes are observed in the range of 1.77–1.95 BM, which infer the complexes are in octahedral structure [Citation21]. The electronic spectra of Co(III) complexes shows the broad band around 257–272, 301–347 and a shoulder in the region 547–585 nm. That can tentatively be assigned to 4T1g(F)→4T1g(P) and 4T1g(F)→4A2g(F), respectively, indicating an octahedral configuration around cobalt ion. The results from magnetic moment data are suggested that the cobalt(III) complexes are diamagnetic in nature with a high- spin d6 environment [Citation22]. The electronic spectra of Ni(II) complexes are measured in DMSO exhibits bands at 268–297, 350–405 and 469–583 nm assigned to the π→π* intra ligand transition band charge transfer transition 3A2g(F)→3T2g(F) from the metal to anti-bonding orbital of the ligand and 3A2g(F)→3T1g(P) transitions, respectively, in an octahedral geometry around Ni(II) ion. The Ni(II) complexes are found to have magnetic moments in the range 3.51–3.7 B.M., which are in agreement with octahedral structure [Citation23]. For oxidovanadium complexes, the less intense d-d peaks in the range 255–280, 366–405 and 489–543 nm assigned to 2b2→2e, 2b2→2b1 and 2b2→ 2a1 transitions, respectively, and it is in conformity with square pyramidal geometry around VO(IV). The room temperature μeff value for the oxidovanadium complexes were found in the range 1.73–1.75 B.M., which are certainly confirmed square-pyramidal geometry in these complexes.
Figure 7. The electronic spectra of ligand L and its metal complexes in DMSO
Thermal analysis
Thermal decomposition of complexes has been investigated using thermograms (in ).
Figure 8. Thermograms of Cu(II), Co(III), Ni(II) and VO(IV) complexes
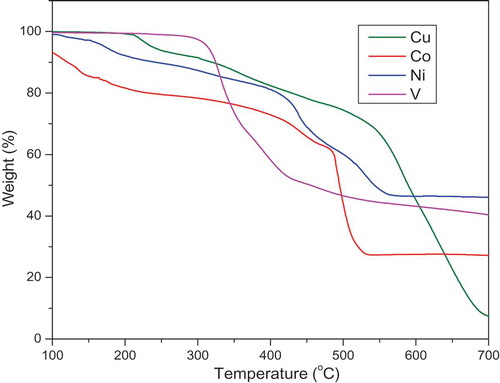
The representive TG curve of copper-complexes shows that, the thermal decomposition took place in two steps in the region 127–209°C and 336–556°C corresponding to the mass of loss of coordinated water and chloride ion with the percentage mass loss of 9.87% (calcd. 9.55%),loss of ligand moieties with the percentage mass loss of 85.79% (calcd. 85.47%) and 1, 10-phenanthroline moiety were decomposed at 635–693°C with the mass loss of 25.66% (calcd. 25.42%) respectively. In the cobalt – complexes, the first weight loss of 7.65% (calcd. 7.39%) in the 139–227°C range represents the dissociation and coordinated water as well as chlorine. The second and third steps correspond to the complete loss of the ligand molecule in the temperature range between 328–487 and 491–532°C with a mass loss of 28.74% (calcd.28.48%) and 19.32% (calcd.19.05%), respectively. Finally the most stable CoO is formed. Thermal analysis of nickel-complexes can be divided into three stages. In the first stage, weight loss is in the range 139–187°C having mass loss of 14.09% (calcd.13.95%) due to loss of coordinated water and chloride ion. In continuation to the first stage, gradual weight loss in the range 255–379°C having mass loss of 36.36% (calcd. 36.14%) shows partial decomposition of the ligand moiety around the metal ion. The degradation stage is in the range of 416 − 502°C with an estimated mass loss of 41.01% (calcd. 40.79%), which is corresponding to the NiO as a final residue. And, one 1, 10-phenanthroline moiety were decomposed at 565–681°C, with mass losses of 30.88% (calcd. 30.61%) and 29.42% (calcd. 29.26%) leaving behind the corresponding metal oxide respectively. The oxidovanadium- complexes decomposes in two stages. The first stage degradation starts at 164–255°C with an estimated weight loss of 33.84% (calcd.33.67%) due to loss of phenanthroline. Further decomposition occurs in the temperature range of 273–420°C having mass loss of 45.23% (calcd. 45.02%) reflects the association of coordinated ligand. Further decomposition occurs in the temperature range of 531–663°C corresponds to the final residue estimated as free vanadium oxide.
EPR spectra
The synthesized copper complexes are Electron Paramagnetic Resonance (EPR) active, and their EPR spectra are recorded in solvent DMSO at low temperature of 77 K. The EPR spectra are given in and parameters of the C1, C2, C7 and C8 are given in . In 3d-orbital, copper(II) has one unpaired electron with a spin S = ½. This value is equal to that of spin of free electron and the value of I = 3/2 for copper(II). The spectra show four well-resolved peaks in low field region [Citation24]. The copper complexes exhibit the g|| and g┴ value in the range 2.154–2.137 and 2.017–2.056, respectively, and g║> g⊥> 2.0023 [Citation25]. These values are indicate that the ground state of Cu(II) is predominantly dx2–y2 with d9 configuration and copper site has a characteristic of octahedral geometry. The values of the exchange coupling parameters obtained by the expression:
Table 2. EPR spectral parameters for copper and oxidovanadium complexes in DMSO at 77 K
Figure 9. ESR spectrum of C1, C2, C7 and C8
The EPR spectra of copper complexes were recorded at low-temperature and their G values are 3.479 and 3.857 for C1 and C2, respectively, which are ~4.0, suggesting the presence of exchange interactions. EPR spectra of C7 and C8 shows a hyperfine pattern of typical eight equidistant lines originate from the interaction of an unpaired electron with 51 V, I = 7/2 These characteristic properties are reveals that a monomeric VO(IV) complexes. The parameters display the orders of g||< g⊥ and A||≫ A⊥ represents that an unpaired electron is available in the (dxy)1 orbital with a square pyramidal geometry around the oxidovanadium(IV) complexes in C4 v symmetric fashion [Citation26].
On the basis of above facts, the proposed structure of metal complexes C1-C8 are depicted in .
Figure 10. Proposed structures of the prepared metal complexes
Antimicrobial activity
Newly prepared Schiff base complexes of copper, cobalt, nickel and oxidovanadium were subjected to find their antibacterial efficacies against bacterial stains (B.subtilis, S. aureus) and (S.typhi and E. coli) and antifungal activities against C.albicans and A. Niger by employing disc diffusion technique on nutrient agar medium [Citation27]. A series of petri plates was filled with sterile nutrient agar along with cultured microorganism (bacteria and fungi). The studied compounds were dissolved in DMSO and make the concentration of stock is 10−3 M. For each, three determinations were made. Each plate was incubated (37°C for 24 h) inhibition zone was recorded. Gentamicin and fluconazole were used as standard drugs for the comparison of the results. The results achieved from these studies are enlisted in and . The enhanced antibacterial efficacy was observed in the compounds containing halides or phenyl groups.
Table 3. Antimicrobial results of the Schiff base ligand and its metal complexes
Table 4. MIC [μg/ml] values for antimicrobial activity of Schiff base ligand and its corresponding metal complexes
For antimicrobial activity, the MIC values are presented in . The data of the antifungal and antibacterial activity indicated that the metal complexes are more active than ligand, L. Based on Overtone’s and chelation theory concept, one can predict the biological activity of metal complexes are more than its ligand L [Citation28].
DNA binding studies
Electronic absorption titration
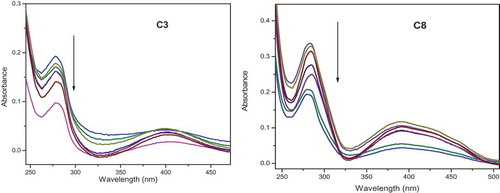
UV-Visible technique is a most useful method to determine the interaction between negatively charged DNA and positively charged metal complexes. The different binding mode to DNA gives an insight in understanding their biochemical mode of action of metal complexes. To account for the binding ability and nature of binding to CT-DNA, UV-visible and ethidium bromide displacement assay were carried out. In this study, the interaction study of C1-C8 with and without CT-DNA in Tris-buffer was performed. The spectra are depicted in . The deformation of DNA structure was obtained from the results of hypochromism, whereas the destruction of double helix structure from hyperchromism. The Equation (1) can be utilized to calculate the binding constants;
Figure 11. Electronic absorption spectra of complexes C3 and C8 (50 μM) in Tris/NaCl buffer (pH = 7.2) upon addition of CT-DNA (0–25 μM). Arrow shows the absorbance changing upon increase of DNA concentration. Inset: linear fit of [DNA]/(ɛa-ɛf) v/s [DNA] for the titration of the C3 and C8 complexes with CT-DNA
![Figure 11. Electronic absorption spectra of complexes C3 and C8 (50 μM) in Tris/NaCl buffer (pH = 7.2) upon addition of CT-DNA (0–25 μM). Arrow shows the absorbance changing upon increase of DNA concentration. Inset: linear fit of [DNA]/(ɛa-ɛf) v/s [DNA] for the titration of the C3 and C8 complexes with CT-DNA](/cms/asset/460e7781-3182-4e9f-b5b3-7c7f2cc890fe/teba_a_1758890_f0011_oc.jpg)
In the above equation, concentration of DNA base pairs denotes [DNA], εa is the extinction coefficient (Aobs/[MC]) of the complex at a given DNA concentration εb and ɛf correspond to the extinction coefficient of free and the fully bound to DNA, respectively. A plot of [DNA]/ against [DNA] to give a slope 1/(
) and an intercept 1/Kb(
). Binding constant Kb, which is a ratio of the slope to the intercept. The calculated intrinsic binding constants (Kb) of all complexes were found to be 4.26 × 10⁵, 6.33 × 10⁶, 3.89 × 10⁵, 6.57 × 10⁶, 4.52 × 10⁵, 5.93 × 10⁶, 4.79 × 10⁵ and 6.67 × 10⁶ M−1 for complexes C1-C8, respectively. These values are almost always after with classified intercalators (Ethidium bromide), whose binding constants are in the range of 106–107 M−1, suggests that the complexes have intercalative binding mode, which involves a stacking mode of interaction between these complexes and DNA base pairs. The spectral results reveals that intercalative interaction between DNA and the complex shows significant hyperchromism and the red shift is responsible for ᴨ-ᴨ* transition between them. The intensity of absorption band is decreases with the increasing DNA concentrations.
The intercalation binding between complexes and DNA is characterized by the change in absorbance (hypochromism) as well as red shift in wavelength. This represents a very strong binding between the aromatic chromospheres and the DNA base pairs. The extent of hypochromism is generally consistent with strength of the intercalative interaction [Citation29]. This result suggests that the complexes are having intercalative interaction that involves a stacking interaction between the metal complex as well as DNA base pairs. Phen has a planar aromatic moiety and also large surface area. Therefore, the complexes containing phen ligand have a very good interaction with DNA.
Competitive binding with EB
All the synthesized complexes are non-emissive in nature. Hence, ethidium bromide displacement experiments were conducted. The EB fluorophore, on the addition of nucleic acid, the fluorescence intensity was enhanced due to interaction with DNA. Apparently sensitive fluorescence probe EB can interact to DNA, which indicates that the increasing intensity of fluorescence. In buffer medium, no emission spectra were observed either for all the studied compounds or CT-DNA. The fluorescence quenching of EB bound to CT-DNA with Cu(II), Co(III), Ni(II) and VO(IV) complexes are depicted in . The fluorescence emission spectra of the complexes were recorded between 500 and 800 nm at excitation wavelength 450 nm. The quenching of the prepared complexes to EB bound CT-DNA was assessed by their corresponding quenching constant, KSV, which was deduced from the Stern-Volmer quenching equation (Equation (2)).
Figure 12. Emission spectra of EB bound to DNA in the presence of the complexes C3 and C8; λex = 450 nm, at the concentration 0–30 μM in Tris–HCl/NaCl buffer (pH 7.2). [EB] = 10 µM, [CT-DNA] = 100 µM. The arrow shows the intensity changes upon increasing concentrations of the complex. Inset: linear fit IO/I v/s [complex], Stern-Volmer quenching curves for the fluorescence titration of complexes C3 and C8 to DNA-EB bound system
![Figure 12. Emission spectra of EB bound to DNA in the presence of the complexes C3 and C8; λex = 450 nm, at the concentration 0–30 μM in Tris–HCl/NaCl buffer (pH 7.2). [EB] = 10 µM, [CT-DNA] = 100 µM. The arrow shows the intensity changes upon increasing concentrations of the complex. Inset: linear fit IO/I v/s [complex], Stern-Volmer quenching curves for the fluorescence titration of complexes C3 and C8 to DNA-EB bound system](/cms/asset/e1496495-09fa-41ae-8848-3f26c7339112/teba_a_1758890_f0012_oc.jpg)
where IO and I are intensities of fluoresecene in presence and absence of the complexes, respectively, ‘Q’ is the quencher concentration and Ksv is the Stern-Volmer constant. the KSV value for the complexes C1-C8 are 1.89 × 10⁴ M−1, 3.36 × 10⁴ M−1, 2.41 × 10⁴ M−1, 4.43 × 10⁴ M−1, 2.82 × 10⁴ M−1, 4.67 × 10⁴ M−1, 3.11 × 10⁴ M−1 and 4.98 × 10⁴ M−1 respectively. The quenching plot presents that EB bound to DNA quenching by metal complexes C1-C8 is in agreement with the linear Stern‐Volmer Equation (2). The results from this study illustrates the interaction of C1-C8 with CT-DNA is an intercalative mode [Citation30]. The higher quenching efficiency of C6 and C8 may be due to their interaction with DNA through additional planar aromatic base 1, 10- phenanthroline moiety, so releasing some unbound EB from the bound EB–DNA complex.
Viscometric measurements
The interaction between the metal complexes and DNA was further confirmed by viscometric measurements. Although spectroscopic methods provide important evidence to support the mode of binding of metal complexes to DNA, hydrodynamic measurements are considered to be the best binding interaction of DNA in solution, without a crystallographic data [Citation31,Citation32]. Upon interaction of metal complex with DNA, this results in lengthening of its helix and can also accommodate ligand with increasing in viscosity. If partial binding of ligand leads to kink or bend of DNA helix with decrease in DNA length along with decrease in viscosity, a remarkable increase in DNA viscosity indicates intercalation mode of interaction of complex with DNA. This change has been observed in . The results obtained from spectroscopic studies are in agreement with this result.
Figure 13. Effect of increasing the concentration of the complexes on the relative viscosities of CT‐DNA at 27.0 ± 0.1°C in 5 mM tris‐HCl buffer (pH = 7.2)
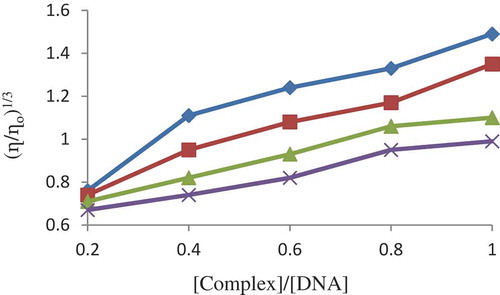
Minor groove binders do not affect the conformation of double helical structure of DNA and thus no variation in viscosity [Citation33]. In , upon addition of coordination compounds, the relative viscosity increases and hence all Cu(II), Co(III), Ni(II) and VO(IV) complexes are interact with DNA in form of intercalative mode.
BSA binding studies
Fluorescence quenching of BSA
Fluorescence technique is a widely used to understand the binding characteristics between metal complexes with BSA. In presence of variable concentrations of studied metal complexes, the emission and excitation of BSA were recorded at 300–400 nm and at 280 nm, respectively [Citation34]. These spectra are depicted in , the spectra reveal that a strong emission peak was observed at 341 and 342 nm for BSA. Fluorescence intensity is decreases with the addition of metal complex solution to BSA, which indicates a bathochromic shift of C1–C8. The observed changes indicating that the metal complexes and BSA have strong interaction to form binary complexes. The fluorescence quenching is described by Stern-Volmer relation:
Figure 14. Emission spectra of BSA (λex = 280 nm; λem = 341 nm for C3, 342 nm for C8) as a function of concentration of the complexes. Arrow indicates the effect of metal complexes C3 and C8 on the fluorescence emission of BSA. Insert: shows the Stern-Volmer plot
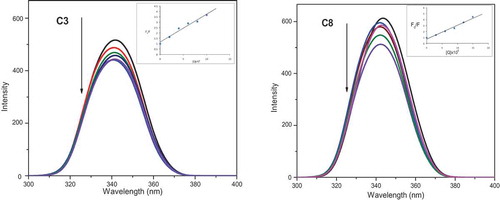
where F0 and F are the intensity of emission lines in the absence and presence of quencher, respectively. KSV is the Stern-Volmer quenching constant, and [Q] is the quencher concentration. The KSV value is obtained as a slope from the plot of F0/F versus [Q]. From the linear plot of F0/F vs [Q] were calculated to be 2.43 × 10⁵ M−1, 4.47 × 10⁵ M−1, 2.78 × 10⁵ M−1, 5.22 × 10⁵ M−1, 3.67 × 10⁵ M−1, 6.05 × 10⁵ M−1, 4.13 × 10⁵ M−1 and 5.93 × 10⁵ M−1 corresponding to the respective complexes C1–C8. presents linear curve in the Stern-Volmer plots suggested that the quenching is in agreement with the Equationequation 3(3)
(3) . The calculated KSV values for the test compounds exhibit their strong protein binding ability.
UV-visible absorption studies
Though a simple technique, UV-visible spectral measurement is useful to study the structural changes as well as different quenching [Citation35]. Dynamic quenching will be affecting the fluorophore of excited states, whereas static quenching normally affects absorption peak of the fluorophore along with formed complex of fluorophore-quencher in the ground state. The UV absorption spectrum of BSA alone and BSA-complexes are shown in . As shown in this figure, the absorption band of BSA appeared at 280 nm has been increased after the addition of complexes.
Figure 15. Absorption spectrum of BSA in the presence of complexes C3 and C8 having concentration range (0–35 µM) at room temperature. An arrow shows the absorbance changes upon increasing BSA concentration
A steady increase of the BSA absorption band with the mixing of metal complexes (C3 and C8) to a constant concentration of BSA was observed in the figure. Similar observations were noticed in the case of other complexes C1, C2, C4, C5, C6 and C7. This result shows that an interaction of BSA with the studied metal complexes. In other words, the fluorescence quenching between C1–C8 and BSA is mainly due to static quenching. As a result of the binding of BSA with metal complexes, the deformity in the structure of BSA occurred.
Conclusion
In this report, coordination chemistry of a Schiff base ligand, obtained from the reaction of Schiff base derived from 2-amino-3-benzyloxypyridine and 3-methoxy salicylaldehyde, is described. Cu(II), Co(III) and Ni(II) complexes have been synthesized using the Schiff base ligand and characterized by spectral and analytical data. With the help of aforementioned techniques, an octahedral geometry has been assigned to the complexes C1-C6 except C7 and C8 complexes which have square–pyramidal geometry. Complexes DNA binding properties investigated by UV–Vis, fluorescence spectra and viscosity measurement. The DNA binding experiment results suggest that the interaction of the complex with DNA is by an intercalation mode. Spectroscopy results also indicated that the interaction between studied C1–C8 complexes and BSA is in a static mode. All the complexes exhibit moderate antimicrobial activities comparing with the standard drug. The present work describes the major role of metal complexes (M = Cu, Co, Ni and VO) on the studies of DNA/BSA binding and antimicrobial activities.
Acknowledgments
The author Disha Sharma is thankful to the University of Mysore, Mysuru for laboratory facilities. I also like to acknowledge Institute of Excellence, University of Mysore, Mysuru for providing Instrumentation Facility.
Disclosure statement
The authors report no declarations of interest.
References
- Yan RL, Yan H, Ren ZY, et al. Cu(I)-catalyzed synthesis of imidazo[1,2-a]pyridines from aminopyridines and nitroolefins using air as the oxidant. J Org Chem. 2012;77:2024–2028.
- Tyagi P, Tyagi M, Agrawal S, et al. Synthesis, characterization of 1,2,4-triazole Schiff base derived 3d-metal complexes: induces cytotoxicity in HepG2, MCF-7 cell line, BSA binding fluorescence and DFT study. Spectrochim Acta A Mol Biomol Spectrosc. 2017;171:246–257.
- Jeewoth T, Bhowon MG, Wah HLK. Synthesis, characterization and antibacterial properties of Schiff bases and Schiff base metal complexes derived from 2,3-diamino- pyridine. Transition Met Chem. 1999;24:445–448.
- Revanasiddappa HD, Prasad KS, Kumar S, et al. Synthesis and biological activity of new Schiff bases containing 4 (3H)-quinazolinone ring system. Int J Chem Tech Res. 2010;2:1344–1349.
- Chetana PR, Sahana S, Policegoudra RS, et al. Synthesis and Chemical nuclease activities of copper (II) and Ni (II) Complexes of 4-chloro-2-(pyridine-3-yliminomethyl) phenol Schiff bases. Int J Pharm Sci Rev Res. 2015;34:220–227.
- Shivakumar L, Shivaprasad K, Revanasiddappa HD. Synthesis, spectroscopic characterization, antimicrobial, DNA binding and oxidative-induced DNA cleavage activities: new oxovanadium(IV) complexes of 2-(2- hydroxybenzylideneamino) isoindoline-1,3-dione. Spectrochim Acta Part A Mol Biomol Spectrosc. 2012;97:659–666.
- Yola ML, Ozaltın N. Electrochemical studies on the interaction of an antibacterial drugnitrofurantoin with DNA. J Electroanal Chem. 2011;653:56–60.
- Nazir H, Akben NS, Ateş MB, et al. Synthesis, crystal structure and magnetic behaviour of a mononuclear Fe(III)—Schiff base metal complex. Z Kristallogr. 2006;221:276–280.
- Das NN, Dash AC. Synthesis, characterization and electrochemistry of a binuclear copper(II) complex of Schiff base derived from 2-aminomethyl-benzimidazole and salicylaldehyde. Polyhedron. 1995;14:1221–1227.
- Ravindrana A, Singha A, Raichur AM, et al. Studies on interaction of colloidal Ag nanoparticles with Bovine Serum Albumin (BSA). Colloids Surf B. 2010;76:32–37.
- Idowu M, Lamprecht E, Nyokong T. Interaction of water-soluble thiol capped CdTe quantum dots and bovine serum albumin. J Photochem Photobiol A. 2008;198:7–12.
- Ju P, Fan H, Liu T, et al. Investigations on the interaction between cuprous oxide nanocubes and bovine serum albumin with comprehensive spectroscopic methods. Biol Trace Elem Res. 2011;144:1405–1418.
- Kandagal PB, Ashoka S, Seetharamappa J, et al. Study of the interaction of an anticancer drug with human and bovine serum albumin: spectroscopic approach. J Pharma Biomed. 2006;41:393–399.
- Guo XJ, Hao AJ, Han XW, et al. The investigation of the interaction between ribavirin and bovine serum albumin by spectroscopic methods. Mol Biol Rep. 2011;38:4185–4192.
- Quiming NS, Vergel RB, Nicolas MG, et al. Interaction of bovine serum albumin and metallothionein. J Health Sci. 2005;51:8–15.
- Schildkraut CL, Marmur J, Doty P. The formation of hybrid DNA molecules and their use in studies of DNA homologies. J Mol Biol. 1961;3:595–617.
- Zaki ZM, Mohamed GG. Spectral and thermal studies of thiobarbituric acid complexes. Spectrochim Acta Part A. 2000;56:1245–1250.
- Hong Y, Liu W, Gou G. Crystal structure of [4-chloro-2-(((2-((3-ethoxy-2-oxidobenzylidene)amino)phenyl)imino)(phenyl)methyl)phenolato-κ4N,N′,O,O′}nickel(II) - ethyl acetate (1/1), C32H29ClN2NiO5. Z Kristallogr - New Cryst Struct. 2018;233:989–991.
- Singh DP, Kumar K, Sharma C. New 14-membered octaazamacrocyclic complexes of divalent transition metal ions with their antimicrobial and spectral studies. Spectrochim Acta - Part A Mol iomol Spectrosc. 2010;75:98–105.
- Maurya RC, Chourasia J, Rajak D, et al. Oxovanadium(IV) complexes of bioinorganic and medicinal relevance: synthesis, characterization and 3D molecular modeling of some oxovanadium(IV) complexes involving O, N-donor environment of salicylaldehyde-based sulfa drug Schiff bases. Arab J Chem. 2016;9:S1084–S1100.
- Patil RM, Prabhu MM. Synthesis and characterization of Co(II), Ni(II) and Cu(II) complexes with sodium salt of p-Methoxyisonitrosoacetophenone. Int J Chem Sci. 2010;8:52–58.
- Alexopoulou KI, Zagoraiou E, Zafiropoulos TF, et al. Mononuclear anionic octahedral cobalt(III) complexes based on N-salicylidene-o-aminophenol and its derivatives: synthetic, structural and spectroscopic studies. Spectrochim Acta Part A. 2015;136:122–130.
- Prema S, Pasupathy A, Bheeter SR, et al. Synthesis and characterization of nickel (II) and copper (II) complexes of uramido benzoic acid. Int J Sci Res Publ. 2016;6:721–723.
- Baskaran S, Krishnan MM, Arumugham MN, et al. DFT analysis and DNA binding, cleavage of copper(II) complexes. J Mol Liq. 2016;221:1045–1053.
- Jadegoud Y, Ijare OB, Somashekar BS, et al. Synthesis, characterization and antimicrobial activity of homodinuclear complexes derived from 2,6- bis [3′-methyl- 2′-carboxamidyliminomethyl(6′,7′)benzindole]-4-methylphenol, an end-off compartmental ligand. J Coord Chem. 2008;61:508–527.
- Garribba E, Micera G, Panzanelli A, et al. Electronic structure of oxovanadium (IV) complexes of r -hydroxycarboxylic acids. Inorg Chem. 2003;42:3981–3987.
- Sharma D, Revanasiddappa HD. Synthesis, spectral characterization, in vitro antimicrobial and anthelmintic evaluations of Cu(II) complexes with a new Schiff base. Orbital: Electron J Chem. 2018;10:515–522.
- Dharmaraj N, Viswanathamurthi P, Natarajan K. Ruthenium(II) complexes containing bidentate Schiff bases and their antifungal activity. Transit Met Chem. 2001;26:105–109.
- Qin P, Liu R, Pan X, et al. Impact of carbon chain length on binding of perfluoroalkyl acids to bovine serum albumin determined by spectroscopic methods. J Agric Food Chem. 2010;58:5561–5567.
- Prabu R, Vijayaraj A, Suresh R, et al. Synthesis, characterization, catalytic, and biological studies of macrobicyclic binuclear nickel(II) complexes of 1,8-difunctionalized cyclam derivatives. J Coord Chem. 2013;66:206–217.
- Satyanarayana S, Dabrowiak JC, Chaires JB. Neither delta- nor lambda-tris(phenanthroline) ruthenium(II) binds to DNA by classical intercalation. Biochemistry. 1992;31:9319–9324.
- Arshad N, Channar PA, Saeed A, et al. Structure elucidation, DNA binding, DFT, molecular docking and cytotoxic activity studies on novel single crystal (E)-1-(2-fluorobenzylidene) thiosemicarbazide. J Saudi Chem Soc. 2018;22:1003–1013.
- Brodie CR, Collins JG, Wright JRA. DNA binding and biological activity of some platinum(II) intercalating compounds containing methyl-substituted 1,10- phenanthrolines. Dalton Trans. 2004;8:1145–1152.
- Sarkar S, Das B. Synthesis and characterization of mononuclear copper (II) complex of tetradentate N2S2 donor set and the study of DNA and bovine serum albumin binding. Complex Met. 2014;1:80–87.
- Sathyadevi P, Krishnamoorthy P, Alagesan M, et al. Synthesis, crystal structure, electrochemistry and studies on protein binding, antioxidant and biocidal activities of Ni(II) and Co(II) hydrazone complexes. Polyhedron. 2012;31:294–306.