
ABSTRACT
Multiple sclerosis (MS) is a chronic inflammatory, demyelinating and degenerative disease of the central nervous system. The exact pathogenesis of MS is incompletely understood. Cerebral vascular pathology is frequently verified in this disease. Perfusion studies may put light on the disease pathogenesis. In this study, we use dynamic susceptibility contrast-enhanced perfusion magnetic resonance imaging (DSC-MRI) to evaluate the cerebral perfusion in a group of MS patients. Thirty patients with relapsing–remitting multiple sclerosis (RRMS) and 20 healthy controls were investigated. The perfusion parameters were assessed for normal-appearing white matter (NAWM) and deep gray matter (DGM). Also, the serum level of the potent vasoconstrictor, endothelin-1(ET-1), was evaluated. There was reduction in cerebral perfusion in MS patients in comparison to healthy controls in the NAWM and (DGM). In addition, serum (ET-1) level was significantly elevated in the patient group and was correlated with the perfusion parameters. These findings suggest that cerebral hypoperfusion may play an important role in the pathogenesis of MS lesions. ET-1 has a role in cerebral hypoperfusion in both NAWM and DGM of RRMS patients. DSC-MRI could be an applicable objective measure to detect cerebral hemodynamic changes in MS.
Introduction
Multiple sclerosis (MS) is a chronic inflammatory, demyelinating and degenerative disease of the central nervous system [Citation1]. The exact pathogenesis of MS is incompletely understood. The classic theory in the pathogenesis of MS is a T-cell-mediated autoimmune disorder of the central nervous system. However, a number of pathophysiological observations cannot be simply explained on the basis of autoimmune mechanisms. First, the progressive (neurodegenerative) component of the disease continues despite intense immunosuppressive interventions that effectively stop inflammatory disease activity [Citation2]. Second, pathologic studies have shown that some demyelinating lesions develop without a preceding inflammatory reaction. Third, is the finding of a diffuse cerebral white matter hypoperfusion in MS patients, which is difficult to be explained by autoimmune phenomena [Citation3].
A number of studies found that cerebral blood flow (CBF) is impaired in normal-appearing white matter (NAWM) of patients with relapsing–remitting MS (RRMS), primary progressive MS and also in clinically isolated syndromes (CIS) suggestive for MS, suggesting that this is independent of the disease course of MS and can already be present in early phases of the disease, but the underlying mechanism is not known. Mitochondrial failure, axonal degeneration and vascular dysfunction have been hypothesized to underlie the perfusion magnetic resonance imaging (MRI) findings [Citation4].
An increased production of the potent vasoconstrictive agent endothelin-1 (ET-1) by reactive astrocytes in focal demyelinated lesions appears to play an important role in reducing CBF in patients with MS. Endothelin A (ETA) receptor activation on vascular smooth muscle cells by ET-1 induces a dose-dependent vasoconstriction of human cerebral arteries, which can be antagonized by the ET-1 receptor antagonist, bosentan [Citation5]. However, in an extension of their study, the authors found no increase in CBF in NAWM of the centrum semiovale of RRMS patients treated for 28 days with the ET-1 antagonist bosentan. In addition, they found that CBF in the centrum semiovale NAWM in the RRMS population (27 RRMS patients) was not different from that of healthy controls who were investigated with the same cerebral MRI protocol, software and scanner. But they did not measure the level of ET-1 in blood or CSF [Citation6].
By using dynamic susceptibility contrast-enhanced perfusion magnetic resonance imaging (DSC-MRI), we tried to evaluate the cerebral perfusion in a group of RRMS patients and correlate it with the serum level of ET-1, aiming to evaluate its role in the pathogenesis of MS.
Methods
This study is a case control comparative study conducted on 50 Egyptian female subjects. Thirty patients were diagnosed as RRMS according to revised McDonald criteria 2010 [Citation7] and aged above 18 years. The patients were collected from the neurology outpatient clinic of Al Zahraa University Hospital, Al Azhar University, Cairo, Egypt. The patients were free from relapse for at least 3 months before the study and no history of systemic corticosteroid intake in the preceding 3 months. They were on interferon as a disease modifying therapy. Patients with other types of MS, patients with hypertension, patients with dyslipidemia, diabetic patients, patients with cardiovascular disorders or other neurological disorders such as stroke, patients with sub-arachnoid hemorrhage and pregnant or lactating patients were excluded from the study. In addition, patients under medications that increase ET-1 serum levels such as insulin were excluded from the study.
The control group consists of 20 healthy volunteers. They were matched for both age and gender with patients group and with no evidence of any medical, psychiatric, or neurologic disease.
The patients and controls were subjected to the following: full history taking and complete general and neurological examination. Also, assessment of severity of MS in the patients by Expanded Disability Status Scale (EDSS) was done.
In addition, complete routine laboratory investigations were done to all subjects to exclude the comorbidities including complete blood count, fasting and post prandial blood sugar, renal function tests, liver function tests and lipid profile. Estimation of ET-1 plasma levels in peripheral blood with a commercially available enzyme-linked immune-sorbent assay (ELISA) kit (TX 78840, USA) was applied to all subjects.
Moreover, all subjects were studied using a 1.5 T MR scanner (Philips Medical Systems -Holland). The images obtained are T2-weighted transverse dual echo (TR/TE: 3400/17,119 msec), non-enhanced T2-weighted (TR/TE: 600/14 msec) and FLAIR image (TR/TE/TI: 9000/110/2500 msec) (TR/TE/TI: 9000/110/2500 msec).
DSC-MRI was performed in transverse plane by using gradient-echo planar sequence with the following parameters: TR/TE/flip angle: 1000/54/30°, field of view: 230 mm; slice thickness: 5 mm; matrix: 128; in-plane voxel size: 1.8 mm and signal bandwidth: 1470 Hz/Pixel.
Before scanning, contrast injection was done using an 18- or 20 – gauge IV catheter that was placed in the antecubital fossa. The imaging was performed during the first pass of a standard dose (0.1 mmol/kg) bolus of gadopentetate dimeglumine, and a series of 60 DSC-MRI images were acquired at one-second intervals during the first pass of contrast agent. The contrast injection was done at the 10th acquisition at a speed of 5 ml/sec by means of an MR-compatible power injector, directly followed by bolus injection of saline at the same injection rate. Post-contrast transverse T1- weighted (TR/TE: 600/14 msec) images were then obtained following DSC-MRI sequence to detect enhanced lesions.
The DSC-MRI images were sent to an off-line workstation for further post processing. The perfusion data were analyzed using software developed in-house based on the C and IDL programming languages. Regional perfusion parameters, for example, cerebral blood volume (CBV), cerebral blood flow (CBF), and mean transit time (MTT) were obtained automatically.
For the measurement of hemodynamic parameters, the regions of interest (ROI) consisting of multiple pixels were carefully placed in NAWM regions (periventricular mainly) to avoid the perfusion difference normally present between different regions of the brain, deep gray matter (thalamus and basal ganglia), lesions which are ovoid in shape, present periventricular and non-enhanced.
The images for the chosen slice during the passage of intravascular contrast were first examined for general image quality and elimination of arterial and venous structures in the selected ROI. Lastly, color-coded maps of perfusion parameters with threshold application were computed and developed by pixel-by-pixel basis for well discrimination of different tissues ().
Statistical analysis: All data have been collected, reviewed and inserted to the Statistical Package for Social Science (IBM SPSS) version 20. The data were presented as numbers and percentages for the qualitative data; mean, standard deviations and ranges for the quantitative data with parametric distribution; and median with interquartile range (IQR) for the quantitative data with non-parametric distribution. Chi-square test was used to compare between two groups with qualitative data, and Fisher exact test was used instead of the Chi-square test when the expected count in any call found less than 5. Independent t-test was used to link between two clusters with quantitative data and parametric distribution, and Mann-Whitney test was used in the judgment between two clusters with quantitative data and non-parametric distribution.
The analysis of variance (ANOVA) and Kruskal–Wallis tests have been used to compare between other clusters with quantitative data and non-parametric distribution. We used Spearman correlation coefficient to assess the significant relation between two quantitative parameters in the same group.
Results
Thirty RRMS patients participated in this study. They were all females (100%), with mean age 25.23 ± 4.99. The mean duration of illness was 3.90 ± 1.81 years. The mean number of attacks was 3.67 ± 1.65. The mean EDSS score of the patients was 1.60 ± 1.19. The control group included 20 healthy female volunteers, with mean age of 25.95 ± 4.38. shows the comparison between patient group and control group as regards ET-1 serum levels.
Table 1. Comparison between patient group and control group as regards ET-1 serum level by (ng/l).
The comparison between patients and controls as regards the DSC-MRI parameters (MTT, CBV and CBF) in normal NAWM and deep gray matter (DGM) is represented in , respectively.
Table 2. Comparison between patient group and control group as regards MTT, CBV and CBF in NAWM.
Table 3. Comparison between patient group and control group as regards MTT, CBV and CBF in deep gray matter (DGM).
The correlation between the serum levels of ET-1 and the clinical parameters of the disease in patient group is shown in and .
Figure 1. Correlation between serum levels of ET-1 and EDSS.
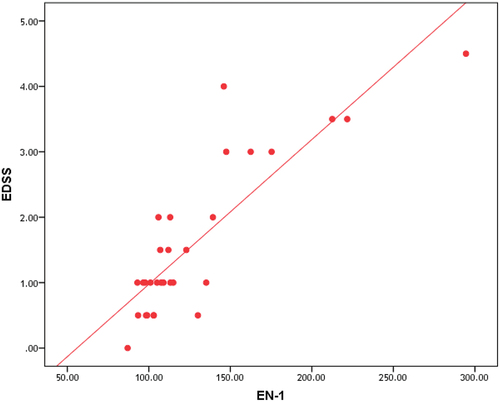
Table 4. Correlation between ET-1 and EDSS, duration of illness and number of attacks in patients group.
The correlation between the disability measured by EDSS and radiological parameters (MTT, CBF and CBV) NAWM and deep gray matter (DGM) is represented in , respectively.
Table 5. Correlation between EDSS, MTT, CBV and CBF in NAWM in patients group.
Table 6. Correlation between EDSS and MTT, CBV and CBF in DGM of patients group.
Correlation between ET-1 and MTT, CBV and CBF in NAWM and in deep gray matter of patients group is represented in , and , , respectively.
Figure 2. Correlation between serum levels of ET-1 and (CBF) in NAWM.
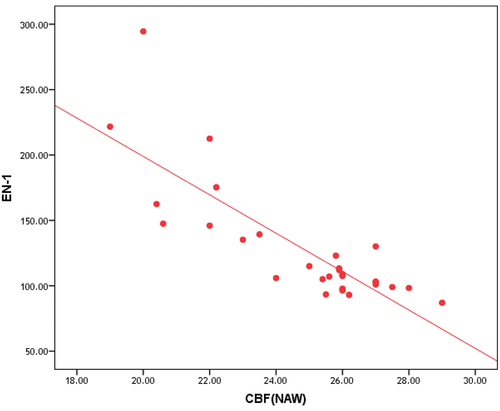
Figure 3. Correlation between serum levels of ET-1 and (CBF) in DGM.
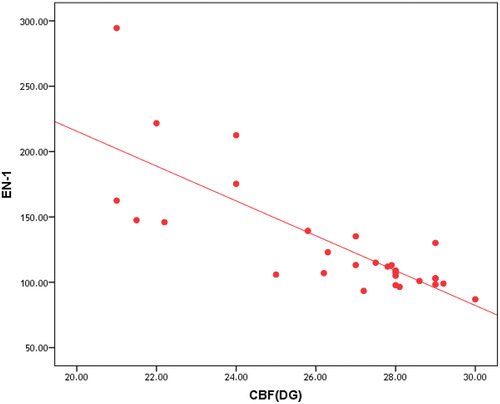
Figure 4. Cerebral blood flow (CBF) and mean transit time (MTT) color-coded maps in MS patient show decreased perfusion with decreased CBF and increased MTT (black arrows).
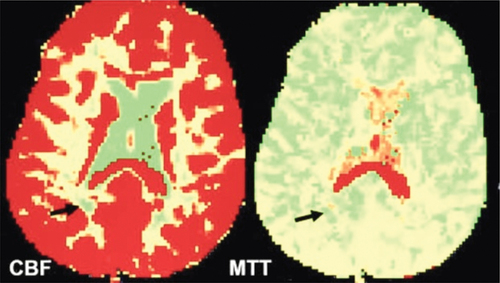
Figure 5. Cerebral blood flow (CBF) and cerebral blood volume (CBV) color-coded maps in MS patient with white matter lesion show perfusion changes in comparison to contralateral normal-appearing white matter (NAWM).
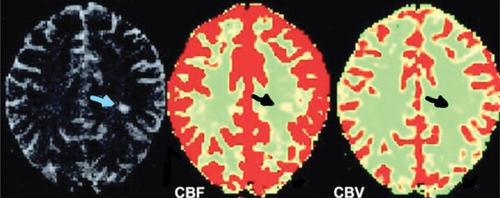
Table 7. Correlation between ET-1 and MTT, CBV and CBF in NAWM of patients group.
Table 8. Correlation between ET-1 and MTT, CBV and CBF in DGM of patients group.
Discussion
Although conventional MRI is valuable in detecting white matter plaques associated with MS, it lacks pathological specificity and sensitivity to functional and microstructural abnormalities affecting NAWM and normal appearing DGM. DSC-MRI can overcome one of the limitations of conventional MRI by characterizing cerebral microvascular hemodynamics [Citation8].
In this study, we assessed the cerebral perfusion parameters including (CBF, CBV and MTT) by using DSC-MRI in RRMS patients.
The results demonstrate that both CBF and CBV were significantly decreased, and MTT was significantly prolonged in periventricular NAWM of RR MS patients than in white matter of controls.
Our results were consistent with Varga and colleagues [Citation9] who measured the cerebral perfusion parameters in the NAWM (periventricular and frontal area) of 12 CIS patients, 12 RRMS patients and 12 healthy subjects as controls by means of DSC-MRI. They reported that there was significant reduction in CBF of the periventricular NAWM of CIS patients and RRMS patients when compared to controls.
Moreover, most cross-sectional studies assessing perfusion in NAWM demonstrated alterations in perfusion parameters with different combinations of either reduced CBF or reduced CBF and CBV and elevated MTT in MS patients compared with healthy controls [Citation10–15].
However, our results disagree with Wuerfel and colleagues [Citation16] who analyzed CBV, CBF and MTT in 20 patients with RRMS and found an increased CBF in NAWM.
Also our result disagrees with Rashid and colleagues [Citation17] who study perfusion parameters using arterial spin labeling in 60 MS patients (21 RRMS, 14 SPMS, 12 PPMS and 13 benign MS) compared to 34 healthy controls and found an increased CBF in cerebral white matter of patients with RRMS and SPMS, as compared with controls.
Their results might be explained by that the authors did not distinguish NAWM from active focal white matter lesions. As Rashid and colleagues [Citation17] study global white matter perfusion without differentiation between NAWM and lesion, gadolinium-enhancing areas show increased CBF due to inflammation and release of vasodilator cytokines. So CBF of the total white matter may be overestimated when active lesions were not expected from perfusion measurements [Citation5].
Also the authors may select sites that had increased perfusion prior to lesion development. As such, the higher values of CBF and CBF in NAWM could reveal inflammation that remains unnoticeable by conventional post-contrast MRI but is coexistent to focal BBB breakdown. As Wuerfel and colleagues [Citation16] reported increased regional perfusion several weeks prior to contrast enhancement of MS lesion.
Bester and colleagues [Citation18] study DSC-MRI in NAWM of RRMS patients comparing a high with a low-inflammatory cohort. Their work provided evidence that a NAWM of the high inflammatory cohort is accompanied by higher CBV and CBF than NAWM of low inflammatory cohort. They supposed that the elevated perfusion values in the NAWM in the high inflammatory cohort may be indicative of angiogenesis occurring additionally to inflammation-induced vasodilatation[Citation18].
In our study, we found that values of CBF and CBV was significantly decreased and MTT was significantly prolonged in normal appearing DGM of RRMS patients than in DGM of control subjects.
These findings are in agreement with D’haeseleer and colleagues [Citation5], Papadaki and colleagues [Citation19] and Varga and colleagues [Citation9] who reported decrease in perfusion parameters of DGM of RRMS patients and suggested that a continuum of reduction of tissue perfusion starting in white matter and disseminated to gray matter through the disease evolution.
Inglese and colleagues [Citation11] suggested that the reduction in perfusion parameters in normal appearing DGM could be due to the following: first, small inactive DGM lesions, not identified on conventional MRI, could resulted in perfusion reduction. Second, axonal transection in active lesions in the white matter could result in anterograde and retrograde degeneration of axons entering the thalamus. Lastly, loss of neurons that is caused by hypoperfusion, iron deposition, demyelination, or Wallerian degeneration might add to decrease in CBF.
Despite convincing and reproducible perfusion alterations in MS, their relation to clinical measures of disability and disease severity is not yet strongly established. This study shows significant negative correlation between the disease disability measured by EDSS and perfusion parameters (CBF and CBV) and significantly positive correlation between EDSS score and MTT in both NAWM and DGM of patients group.
Our result is in consistent with that of Adhya and colleagues [Citation12] who reported that EDSS has significantly negative correlation with the perfusion parameters in the periventricular NAWM. Moreover, our result is compatible with Doche and colleagues [Citation20] in a study of 23 subjects with RRMS. They found a significant negative association between hypoperfusion of bilateral median thalami and time to complete the 9-Hole peg test and reported a tendency to negative correlation between parameters of perfusion in thalami and EDSS.
Also our result agrees with that of Inglese and colleagues [Citation11] who reported that there was a trend toward a negative effect of hypoperfusion on disability in normal-appearing DGM. However, the correlation between them was not significant.
However, our result disagrees with that of Steen and colleagues [Citation14] who measured the CBF using pseudo-continuous arterial spin labeling in 25 MS patients with different degrees of disability (16 with RRMS and 9 with progressive MS) compared to 10 healthy controls and reported that the reduction in CBF in NAWM did not show correlation with disability assessed by the EDSS. The difference of the results could be explained by that the author selected different types of MS patients with different disease activity and different EDSS values not correlated with CBF. Moreover, measures of disability sometimes have decreased sensitivity to predict disease severity. For example, the EDSS generally reveals motor disability caused by spinal cord lesions and could show variability among clinicians.
More doubts and suspicions are reported around the explanation of the perfusion reduction in NAWM and DGM, a finding that could be related to a primary vascular event or due to neuronal loss and reduced metabolic functions [Citation21]. Cerebral vascular dysfunction in MS has been demonstrated before, but it may not be enough to explain the changes in brain perfusion.
In this study, we assessed ET-1 serum levels in peripheral blood and found a significant increase in ET-1 serum level in RRMS patients in comparison to control subjects. Our result agrees with that of Haufschild and colleagues [Citation22] who study ET-1 serum level in 20 MS patients (10 male and 10 females) using radioimmunoassay technology to determine ET-1 plasma levels in comparison to 20 controls and reported that serum level of ET-1 was markedly and significantly increased in MS patients than healthy controls [Citation22].
Our result is also is in line with Monti and colleagues [Citation23] who assessed ET-1 serum level in 64 MS patients (39 RRMS and 25 SPMS) in comparison to 37 healthy controls and found that serum level of ET-1 was significantly higher in MS patients than control group.
In addition, enhanced blood levels of the potent vasoconstrictive peptide ET-1 were found in peripheral venous blood and cerebrospinal fluid of patients with MS [Citation22,Citation24]. This has been associated with reduced extra-ocular blood flow velocities [Citation25].
The increase in plasma ET-1 levels in peripheral circulation and in jugular venous blood and the elevation of jugular to peripheral blood ratio that was found in patients with MS in comparison to controls reveals that the ET-1 is secreted from the brain to the circulation [Citation26]. However, these results disagree with Jankowska-Lech and colleagues [Citation27] who study ET-1 serum level in 39 MS patients (including RRMS, PPMS, SPMS and progressive relapsing MS). Their study included all types of MS (RRMS represent 51% of patients), and the author found that ET-1 serum level was decreased in MS patients in comparison to control subjects. The authors explained that the decrease in ET-1 serum level in MS patients could be due to low disease activity as 50% of their MS patients were either PPMS, SPMS or progressive relapsing MS or to influence of immunosuppressant therapy, which decrease the activity of T lymphocytes and the production of T cell-dependent mediators involved in the pathophysiologic process as ET-1. Also the authors supposed that reduction in serum ET-1 level was due to endothelium-dependent vascular dysregulation syndrome, which is present in autoimmune diseases as MS [Citation27].
In this study, we found that ET-1 serum level has highly significant positive correlation with MTT in NAWM and DGM and highly significant negative correlation with CBV and CBF in NAWM and DGM in patients group.
Our result is partially in line with D’Haeseleer and colleagues [Citation26] who reported that CBF was reduced by approximately 20% in MS patients, as compared with control subjects. This CBF was significantly increased after treatment with bosentan (ET-1 receptor antagonist), in NAWM of centrum semiovale, frontoparietal cerebral cortex, thalamus, and cerebellar hemispheres and reaches levels comparable to controls.
However, our result disagrees with Monti and colleagues [Citation23] who study the relationship between brain hypoperfusion and serum level of ET-1 via analysis of cerebral circulation time (CCT) of the whole brain, achieved by digital subtracted angiography, in 64 patients (39 RRMS and 25 SPMS) and 37 healthy subjects and found that there was no correlation between serum level ET-1 and CCT in RRMS patients. However, in SPMS serum, ET-1 level was positively correlated with CCT values. The authors supposed that the explanation may be found in the evidence that the activity of the ET-1 plasma level is increased when the BBB is severely altered in SPMS.
The changes in cerebral perfusion in MS patients compared to controls reveal suspicion about the pathogenesis. Decrease in energy requirements and of blood supply caused by astrocytic and mitochondrial dysfunction and degeneration of axons might not completely elucidate the diffuse reduction in cerebral perfusion [Citation4].
Possible mechanisms involved in the reduction of perfusion parameters include primary vascular pathology in the context of perivascular inflammation of MS lesions, overproduction of vasoconstrictor molecule, such as ET-1, deficiency in B2-adrenergic receptors comprising CBF by astrocytes and impaired vasodilatation through inhibition of endothelium-derived relaxing factors, such as nitric oxide (NO) [Citation23].
It might be argued that ET-1 through inducing vasoconstriction response may cause hypoperfusion and therefore tissue hypoxic/ischemic stress. However, ET-1 has a crucial role in protecting the astrocytes against hypoxic/ischemic stress so that these cells can either repair their neighboring injured neurons or contribute in developing a protective boundary of the damaged cells of the brain. In fact, astrocytes regulate glutamate uptake, preventing excitotoxicity, neuronal injury, control the levels of important extracellular ions as K+ and H+ and promote antioxidant protection in the brain [Citation28].Therefore, Monti and colleagues [Citation23] suggest that over secretion of ET-1 could be a protective reaction to the early vascular-induced events in MS, possibly contributing to the remission stage in RRMS patients. Later, due to their persistent high levels, the detrimental effects of these vasoactive molecules could prevail and contribute to functional/ structural abnormalities of the brain microvasculature. When it begins to interfere with basic laws of fluid dynamics, hemorheological compromise will result in cerebral capillary resistance, abnormal flow patterns and changes in shear stress and shear rate in vessel walls [Citation29].
The current study suggests that vascular hemodynamic alteration plays an important role in the pathophysiology of MS lesions. This may have significant clinical effects on the pathogenesis of the disease and the development of new therapies. DSC-MRI might be an applicable objective measure of cerebral hemodynamic changes of both NAWM and DGM which have clinical relevance in MS patients and provide additional information of microvascular abnormalities that may be associated with lesion development, lesion extent and lesion reactivity in MS and also provide an objective measure of disease progression and treatment efficacy. ET-1 (a strong vasoconstrictor peptide) has a role in cerebral hypoperfusion in both NAWM and normal-appearing DGM of RRMS patients. Also, the strong relation between disability measure and ET-1 serum levels in MS patients further suggests a role of ET-1 in the pathogenesis and progression of MS.
The limitations of the study are the small number of patients, only RRMS and the patients were on immunomodulatory therapy (INF-beta), which might affect the serum levels of ET-1 and also, using EDSS score for measuring disability, which depends on gait disability and might be variable among examiners.
In conclusion, cerebral hypoperfusion may play an important role in the pathogenesis and development of MS lesions. ET-1 has a role in the pathogenesis of MS through lowering of CBF among other mechanisms. DSC-MRI could be an applicable objective measure to detect cerebral hemodynamic changes in MS.
List of abbreviations
| MS | = | multiple sclerosis |
| CBF | = | cerebral blood flow |
| CBV | = | cerebral blood volume |
| MTT | = | mean transit time |
| NAWM | = | normal appearing white matter |
| DGM | = | deep gray matter |
| CIS | = | clinically isolated syndrome |
| RRMS | = | relapsing-remitting MS |
| SPMS | = | secondary progressive MS |
| ET-1 | = | endothelin-1 |
| DSC-MRI | = | dynamic susceptibility contrast enhanced perfusion magnetic resonance imaging |
| EDSS | = | Expanded Disability Status Scale |
| ROI | = | the regions of interest |
| CCT | = | cerebral circulation time |
| NO | = | nitric oxide. |
Availability of data and materials
The datasets used during the current study are available from the corresponding author on reasonable request.
Disclosure statement
No potential conflict of interest was reported by the author(s).
Additional information
Funding
References
- Uzuner N, Uzuner T. Cerebrovascular reactivity in multiple sclerosis. J Neurol Transl Neurosci. 2014;2(2):1051.
- De Keyser J, Steen C, Mostert J, et al. Hypoperfusion of the cerebral white matter in multiple sclerosis: possible mechanisms and pathophysiological significance. J Cereb Blood Flow Metab. 2008;28(10):1645–1651.
- Monti L, Morbidelli L, Rossi A. Impaired cerebral perfusion in multiple sclerosis: relevance of endothelial factors. Biomark Insights. 2018;13:1–10.
- Lapointe E, Li DKB, Traboulsee AL, et al. What have we learned from perfusion MRI in multiple sclerosis? AJNR Am J Neuroradiol. 2018;39(6):994–1000.
- D’haeseleer M, Hostenbach S, Peeters I, et al. Cerebral hypoperfusion: a new pathophysiologic concept in multiple sclerosis? J Cereb Blood Flow Metab. 2015;35(9):1406–1410.
- Hostenbach S, Raeymaekers H, Van Schuerbeek P, et al. The Role of Cerebral Hypoperfusion in Multiple Sclerosis (ROCHIMS) trial in multiple sclerosis: insights from negative results. Front Neurol. 2020;11:674.
- Polman C, Reingold S, Banwell B, et al. Diagnostic criteria for multiple sclerosis: 2010 revisions to the McDonald criteria. Ann Neurol. 2011;69(2):292–302.
- Ge Y, Law M, Johnson G, et al. Dynamic susceptibility contrast perfusion MR imaging of multiple sclerosis lesions: characterizing hemodynamic impairment and inflammatory activity. AJNR Am J Neuroradiol. 2005 Jun-Jul;26(6):1539–1547.
- Varga AW, Johnson G, Babb JS, et al. White matter hemodynamic abnormalities precede sub-cortical gray matter changes in multiple sclerosis. J Neurol Sci. 2009 Jul 15;282(1–2):28–33.
- Law M, Saindaine AM, Ge Y, et al. Microvascular abnormality in relapsing-remitting multiple sclerosis: perfusion MR imaging findings in normal-appearing white matter. Radiology. 2004;231(3):645–652.
- Inglese M, Adhya S, Johnson G, et al. Perfusion magnetic resonance imaging correlates of neuropsychological impairment in multiple sclerosis. J Cereb Blood Flow Metab. 2008;28(1):164–171.
- Adhya S, Johnson G, Herbert J, et al. Pattern of hemodynamic impairment in multiple sclerosis: dynamic susceptibility contrast perfusion MR imaging at 3.0 T. Neuroimage. 2006;33(4):1029–1035.
- Debernard L, Melzer TR, Van Stockum S, et al. Reduced grey matter perfusion without volume loss in early relapsing-remitting multiple sclerosis. J Neurol Neurosurg Psychiatry. 2014; 85: 544–551.
- Steen C, D’haeseleer M, Hoogduin JM, et al. Cerebral white matter blood flow and energy metabolism in multiple sclerosis. Mult Scler. 2013;19(10):1282–1289.
- Narayana PA, Zhou Y, Hasan KM, et al. Hypoperfusion and T1-hypointense lesions in white matter in multiple sclerosis. Mult Scler. 2014;20(3):365–373.
- Wuerfel J, Bellmann-Strobl J, Brunecker P, et al. Changes in cerebral perfusion precede plaque formation in multiple sclerosis: a longitudinal perfusion MRI study. Brain. 2004;127(Pt 1):111–119.
- Rashid W, Parkes LM, Ingle GT, et al. Abnormalities of cerebral perfusion in multiple sclerosis. J Neurol Neurosurg Psychiatry. 2004;75(9):1288–1293.
- Bester M, Forkert ND, Stellmann JP, et al. Increased perfusion in normal appearing white matter in high inflammatory multiple sclerosis patients. PLoS One. 2015;10(3):e0119356.
- Papadaki EZ, Mastorodemos VC, Amanakis EZ, et al. White matter and deep gray matter hemodynamic changes in multiple sclerosis patients with clinically isolated syndrome. Magn Reson Med. 2012;68(6):1932–1942.
- Doche E, Lecocq A, Maarouf A, et al. Hypoperfusion of the thalamus is associated with disability in relapsing remitting multiple sclerosis. J Neuroradiol. 2017;44(2):158–164.
- Hyland M, Rudick RA. Challenges to clinical trials in multiple sclerosis: outcome measures in the era of disease-modifying drugs. Curr Opin Neurol. 2011;24(3):255–261.
- Haufschild T, Shaw SG, Kesselring J, et al. Increased endothelin-1 plasma levels in patients with multiple sclerosis. J Neuroophthalmol. 2001 Mar;21(1):37–38.
- Monti L, Morbidelli L, Bazzani L, et al. Influence of circulating endothelin-1 and asymmetric dimethylarginine on whole brain circulation time in multiple sclerosis. Biomark Insights. 2017;12:1177271917712514.
- Speciale L, Sarasella M, Ruzzante S, et al. Endothelin and nitric oxide levels in cerebrospinal fluid of patients with multiple sclerosis. J Neurovirol. 2000;6 Suppl 2(Suppl 2):S62–S66.
- Pache M, Kaiser HJ, Akhalbedashvili N, et al. Extraocular blood flow and endothelin-1 plasma levels in patients with multiple sclerosis. Eur Neurol. 2003;49:164–168.
- D’Haeseleer M, Beelen R, Fierens Y, et al. Cerebral hypoperfusion in multiple sclerosis is reversible and mediated by endothelin-1. Proc Natl Acad Sci USA. 2013;110(14):5654–5658.
- Jankowska-Lech I, Terelak-Borys B, Grabska-Liberek I, et al. Decreased endothelin-1 plasma levels in multiple sclerosis patients: a possible factor of vascular dysregulation? Med Sci Monit. 2015 Apr 13;21:1066–1071.
- Pekny M, Pekna M, Messing A, et al. Astrocytes: a central element in neurological diseases. Acta Neuropathol. 2016 Mar;131(3):323–345.
- Faraco G, Moraga A, Moore J, et al. Circulating endothelin-1 alters critical mechanisms regulating cerebral microcirculation. Hypertension. 2013 Oct;62(4):759–766.