
 ?Mathematical formulae have been encoded as MathML and are displayed in this HTML version using MathJax in order to improve their display. Uncheck the box to turn MathJax off. This feature requires Javascript. Click on a formula to zoom.
ABSTRACT
Due to the emergence of drug-resistant strains of influenza A virus (IAV) in recent times, the need to search and discover more potent anti-IAV inhibitors is of great interest, especially with the devastating COVID-19 pandemic. The present research applied 2D-QSAR, 3D-QSAR, molecular docking, and ADMET predictions on some novel analogs of 2-((1 H-indol-3-yl)thio)-N-phenyl-acetamide as IAV inhibitors. The 2D-QSAR modeling results revealed GFA-MLR (=0.8861, q2 = 0.7864) and GFA-ANN (
=0.8980, q2 = 0.8884) models with the most relevant descriptors for predicting the anti-IAV responses of the compounds, which have passed the benchmarks for accepting QSAR models. The 3D-QSAR modeling results suggested CoMFA_SE (
=0.925, q2 = 0.59) and CoMSIA_EAD (
=0.929, q2 = 0.767) models for good and reliable activity predictions. The molecular docking of the compounds with the active site of neuraminidase (NA) receptor theoretically confirms their resilient potency. The compounds mostly formed H-bond and hydrophobic interactions with key residues, such as ARG118, ASP151, GLU119, TRP179, ARG293 and PRO431 that triggered the catalytic reaction for the NA inhibition. However, compounds 16 and 21 were identified as lead compounds in the in-silico search for more potent candidates. The outcome of this study set a course for the in-silico design and search of potential candidates for influenza therapy.
Introduction
Influenza (A) virus (IAV) infection remains one of the major causes of mortality and morbidity due to respiratory diseases in recent times even with the devastating Covid-19 pandemic [Citation1]. The World Health Organization (WHO) reported about 2–5 million cases of severe illness caused by the ravaging seasonal influenza virus epidemic which resulted in over 500,000 deaths globally [Citation2]. These flu epidemics cause severe respiratory infections in children, adults, the elderly, and individuals with underlying health conditions [Citation3] [Citation4]. Influenza virus neuraminidase (NA) is an enzyme that catalyzes the obliteration of terminal sialic acid residues (sialidase) which aids in liberating new virions formed from the infected cells and circulating to infect the neighboring cells [Citation5]. As such, the NA inhibition can defend the host from being infected and prevent its proliferation [Citation1]. Due to the highly preserved active site structure of neuraminidase [Citation6], it has become an attractive molecular target for the exploration and development of novel anti-influenza inhibitors. Presently, Zanamivir (Relenza™), oseltamivir (Tamiflu™), laninamivir octanoate (Inavir™), and peramivir (Rapivab™) are the four (4) approved neuraminidase inhibitors for influenza treatment [Citation7]. The IAV disease is usually linked to severe symptoms because of the intense genetic diversity characterized by chromosomal mutation between avian and human viruses. Presently, the only two major classes of antiviral medicines against the influenza A virus are inhibitors of M2-ion channel (rimantadine and amantadine) and neuraminidase (zanamivir and oseltamivir) targets that fight against its spreading around the globe. However, most influenza A virus strains have become resistant to these drugs in recent times. There is a lot of concern for the advent of drug resistance effects resulting from the high variability of the influenza virus or respiratory syncytial virus (RSV) [Citation5]. This is because a patient infected with either virus can manifest similar symptoms at an early stage. The discovery of some novel compounds of 2-((1 H-indol-3-yl)thio) acetamide as dual inhibitors against IAV and RSV is a huge milestone for the rapid therapy of these respiratory co-infections. Moreover, the trial and error approach applied in the development of new drugs has been seen to be very tedious, costly, and time-consuming [Citation8].
The application of some computational modeling concepts such as two-dimensional quantitative structure-activity relationship (2D-QSAR), three-dimensional quantitative structure-activity relationship (3D-QSAR), molecular docking, and ADMET (absorption, distribution, metabolism, excretion, and toxicity) predictions can save time and reduce the cost of synthesizing the new potent drugs [Citation9]. The QSAR analysis is usually employed to make activity predictions of the compounds using some numerical information derived from their molecular structures (descriptors). The molecular docking simulation is also an important molecular modeling strategy that provides information about the residual interaction types between the target ligands and the active site of a protein as a receptor [Citation10]. In this study, 2D-QSAR, 3D-QSAR, molecular docking, and ADMET predictions were applied to some novel compounds of 2-((1 H-indol-3-yl)thio)acetamide to discover probable lead compounds for influenza disease therapy. The 2D-QSAR models were initially constructed as a multilinear regression model (MLR) based on genetic function approximation (GFA) for feature selection of the descriptors whose validation statistics were verified using artificial neural network (ANN) regression calculations. The 3D-QSAR models were constructed based on the comparative molecular field analysis (CoMFA) and comparative similarity indices analysis (CoMSIA) for the activity prediction of the compounds. The compounds were also virtually screened via molecular docking with the NA receptor to have more insight into the residual interactions of the most stable ligand-protein complexes formed. Finally, the drug-likeness and pharmacokinetic prediction of the best lead compounds were identified and evaluated in the study.
Methodology
Data set collection and biological activities (pEC50)
The data set comprising 32 compounds from a series of 2-((1 H-indol-3-yl)thio)-N-phenyl-acetamide derivatives as novel influenza A virus (IAV) inhibitors were selected from the earlier published literature [Citation3]. The anti-IAV responses of the compounds were evaluated as half-maximal effective concentrations (EC50) in a micromolar (μM) unit. The concentrations were further transformed to a logarithmic scale (pEC50 = – log EC50 × 10−6) to reduce data skewness for the QSAR studies [Citation11]. shows the list of substitution patterns in the various structures of the compounds in the data set along with their respective EC50 and pEC50 values.
Table 1. Chemical structures of the 2-((1 H-indol-3-yl)thio)-N-phenyl-acetamide derivatives along with their anti-IAV values.
QSAR Studies
2D-QSAR study
Molecular descriptor computations
The 2D structures of the 32 chemical compounds in the dataset were carefully drawn using ChemDraw software. The structures were converted to 3D with the successive preliminary energy minimization at the molecular mechanics force field (MMFF) level using Spartan 14 software [Citation10]. The minimized compound structures were completely optimized at the density functional theory (DFT) level with B3LYP/631 G** basis set in a vacuum to have a more realistic structural conformation when their respective equilibrium geometries were attained [Citation12]. The pharmaceutical data exploration laboratory software (PaDEL Descriptor) was used to compute over 2000 molecular descriptors for all the optimized structures [Citation13]. These molecular descriptors are computed based on the steric potentials, electronic, potential hydrogen bonds of path length, relative ionization, and hydrophobicity properties of structures [Citation14]. As such, 1D, 2D, and some 3D java class descriptors were computed by retaining the 3D coordinates of the optimized structures.
Data pretreatment and division
The computed descriptors were pretreated by removing non-informative descriptors such as constant and highly inter-correlated descriptors [Citation15]. The constant descriptors with a default variance cutoff of 0.001 and inter-correlated descriptors with a coefficient cutoff of 0.8 were applied to remove the non-informative descriptors [Citation16,Citation17]. Using the Kennard-Stone division algorithm, the pretreated descriptors were divided into a model development set (23 compounds as the training set) and 9 compounds as the test set for the evaluation of the prediction performance of the model.
2D-QSAR model building and statistical validation
The 2D-QSAR model was initially built using the Material Studio software based on the genetic function approximation (GFA) algorithm for feature selection of the best subset descriptors in the training set [Citation12]. The Friedman Lack-of-Fit (LOF) as the fitness function of the GFA model during the evolution process was measured, while the scaled LOF smoothness parameter was set as the default of 0.5 [Citation18]. However, the LOF measured with material studio slightly differs from the original Friedman formula as shown in Equationequation 1(1)
(1) .
where C is the number of the model terms other than the constants, d is the scaled smoothing parameter, p is the total number of descriptors as model terms excluding constants, N is the training set compounds, is the safety factor with a score of 0.99 which ensures that the denominator must be equal to zero. The scaled smoothing parameter is related to the scaled LOF smoothness factor (
which was set at default 0.5 for a well-defined LOF measure as shown in Equationequation 2
(2)
(2) .
In addition, the population sample was set to 10,000, the maximum generation was set to 1000, and the number of top equations was set to 1 for an effective model convergence [Citation19]. The descriptor matrix of the built model was initially subjected to the Y-Randomization test as a measure to attest to the quality of the model before being exported to Molegro Data Modeler (MDM) for the development of the multi-linear regression (MLR) and the non-linear regression model version based on artificial neural network (ANN) analysis [Citation18,Citation20]. The predictive ability of the GFA-MLR and GFA-ANN models generated was examined using the following internal validation parameters as follows:
The Pearson correlation coefficient (r): is a measure of the correlation of two variables x and y. It is mathematically defined as:
where and
are the standard deviations for the variable x + and y. However, Pearson correlation coefficient squared (r2) is often used to describe relationships between two variables whose range of values is between 0 and 1.
Adjusted r2: is a modification of the Pearson correlation coefficient that fine-tunes the number of descriptors used in the multi-linear regression model, which will always be less than or equal to the Pearson correlation coefficient as defined below:
Where N corresponds to the number of compounds in the training set as data points and p is the number of descriptors in the built model.
Spearman’s rank correlation coefficient (ρ): is a well-ordered correlation coefficient that utilizes the data points hierarchy as a substitute for the raw data points, and it is defined as:
where the raw data points are changed to ranks. di is the difference between the ranks of corresponding values of x and y and N is the number of data points.
Cross validated correlation coefficient often represented as (q2): is a measure of the predictive power of the regression model, and it is defined as:
where the predictive sum of squares (PRESS) is defined as:
where , and
refer to the experimental and predicted activities. The closer the score of q2 is to 1.0, the better the model’s predictive power.
Root mean square error (RMSE): is a good measure for evaluating the prediction performance of the model generated which is proportional to the observed mean score as defined below.
The reliability and the predictive performance of the models were also assessed with relevant external validation metrics as proposed by some prominent QSAR scientists, such as Alexendra Tropsha, Paola Gramatica, and Kunal Roy [Citation21]. Some of the external validation metrics include the predicted coefficient of determination for the test set , regression coefficients for the test set (
, delta modified square of correlation coefficient (
), coefficient of determination of Y-randomization
among others [Citation22].
Model Applicability Domain (AD)
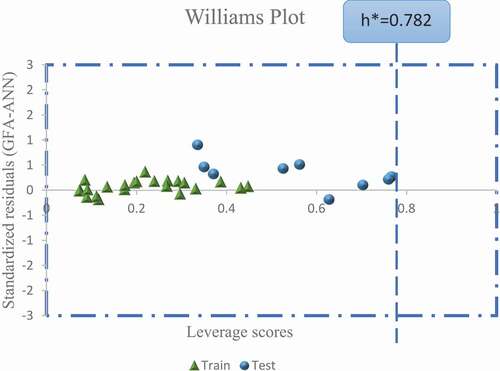
The model applicability domain is the theoretical chemical space of the compounds defined by the descriptors and the modeled activity in which the acceptable QSAR model can make reliable predictions [Citation11]. Thus, the technique helps in detecting the structural and response outliers in the training and test set, respectively. Furthermore, the leverage approach was utilized to assess the chemical space of a QSAR model, and the plot of standardized residuals against leverage values (h), also known as the Williams plot, was used to virtually screen the compounds [Citation10]. As such, compounds with leverage scores less than the threshold (h < h*) and standardized residual scores within ±3.0σ (standard deviation unit) are set to be within the model’s applicability domain. The warning leverage (h*) is calculated using:
where D is the number of descriptors in the model and N is the number of compounds used as the training set.
3D-QSAR Study
Molecular alignment
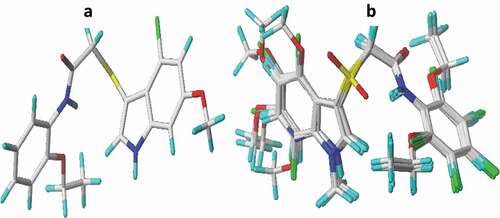
The 3D-QSAR modeling studies of 32 compounds were performed utilizing Sybyl-X 2.1.1 program (Tripos Inc., St. Louis, USA), on windows 10.0, 64 bits Dell computer. The molecular alignment of a database is one of the most crucial steps for building a reliable and predictive 3D-QSAR model. Hence, the distill rigid alignment was used to align the compounds of the studied dataset to the most potent compound (compound no. 21) as the template ()).
Figure 1. Optimized structures (a) structure of compound 21, (b) alignment and superposition of the dataset compounds (capped sticks model).
Development of 3D QSAR models
The 3D-QSAR modeling studies have been recognized as an important concept in designing more potent inhibitors, which relates their 3D structural attributes with bioactivity [Citation23]. The 3D-QSAR models were developed using CoMFA and CoMSIA methods. For the CoMFA method, steric (S) and electrostatic (E) fields around the compounds are correlated with bioactivity, while in the case of the CoMSIA method, hydrophobic (H) and hydrogen bond acceptor/donor fields are correlated with bioactivity [Citation24]. In the CoMFA model development, the aligned compounds were imported into a 3D cubic lattice with a grid spacing of 2 Å. The Tripos force field utilized a carbon sp3 probe atom with a radius of 1.52 Å and +1 positive charge to compute steric field energies using Lennard Jones 6–12 potential and electrostatic field energies from Coulombic potential with distance as a function of the dielectric at each lattice point. The column filtering was set at a default parameter of 2.0 Kcal/mol to reduce noise and fast potential calculation. In CoMSIA model development, steric (S), electrostatic (E), hydrophobic (H), hydrogen bond acceptor (A), and donor (D) field descriptors are computed using the carbon sp3 atom with a positive charge (+1) and radius of 1 Å at default attenuation factor of 0.3 to build different CoMSIA models.
Statistical validation of the 3D-QSAR models
The 3D-QSAR models were built by correlating the latent components from the set of available CoMFA and CoMSIA descriptors as the independent variables with the anti-IAV response effects of the compounds in the model building set (training set) through partial least squares (PLS) regression analysis [Citation25]. The competency of the 3D-QSAR models built was analyzed based on the prominent statistical validation parameters for an acceptable QSAR model.
Molecular docking studies
A molecular docking investigation was carried out on the studied dataset using the molecular operating environment (MOE) V2015. 10 software. The H1N1 2009 pandemic influenza neuraminidase complexed with zanamivir (PDB: 4B7Q) was used as the protein receptor for the study, and the co-crystalized ligand (zanamivir) in the receptor was used as the reference drug [Citation26].
Energy minimization and the docking protocol
The downloaded protein was imported into the MOE workspace, then further subjected to energy minimization by fixing all hydrogen atoms, lone pairs, partial charges, and conformational searching until an RMS distance of 0.1 Å and RMSD gradient of 0.01 kcal/mol were attained using Amber12: ET force field. The database of the 32 optimized compounds in the (.mdb) file was imported for the docking protocol [Citation27]. To increase the docking accuracy, the co-crystalized ligand was initially re-docked with its protein to analyze the ligand–pocket interactions or active site, and the RMSD scores were calculated between the docked poses and the co-crystalized ligand. Then, a docking simulation of all ligands was carried out within the active sites of the receptor. The MOE program was adjusted to the triangle matcher method based on the London dG scoring function for placement selection and induced fit based on GBVI/WSA dG scoring function for refinement [Citation28]. The best poses obtained were studied with the further visualization of the most stable complexes formed using Discovery studio.
Drug likeness evaluation and ADMET predictions
The evaluation of drug-likeness and pharmacokinetic parameters of potential drug candidates is crucial at the preliminary stage of the drug discovery which assists in rolling out any unfavorable effects of the candidates [Citation29]. The pharmacokinetic parameters are built on desirable adsorption, distribution, metabolism, excretion, and toxicity (ADMET) of the query drug when administered [Citation10]. An accurate and resourceful ADMETlab 2.0 web server (https://admetmesh.scbdd.com/) was exploited to predict several physicochemical and toxicity parameters in the study [Citation30,Citation31]. In addition, the drug-likeness of the compounds was appraised in terms of Lipinski, Ghose, Veber, Egan, and Muegge rules using the SwissADME online web server at http://www.swissadme.ch/index.php.
Results and discussion
2D-QSAR studies
The 2D-QSAR modeling studies were carried out successfully on 2-((1 H-indol-3-yl)thio)-N-phenyl-acetamide derivatives as novel influenza A virus (IAV) inhibitors. The built 2D-QSAR models in this study were used to make predictions of the anti-IAV responses (pEC50) for the compounds with the influence of some robust statistically significant molecular descriptors [Citation10]. As mentioned earlier, the GFA model building protocol of Material Studio was used for the feature selection of the best descriptors matrix. Subsequently, 2D-QSAR models were successfully built based on the MLR and ANN modeling techniques with the five (5) best descriptors whose model internal and external validation metrics were shown in .
Table 2. Internal validation of the 2D-QSAR models.
Table 3. External validation parameters of the 2D-QSAR models.
The model descriptors are coded as ATSC7i, SpMin1_Bhm, AVP-0, L2m, and E1e, which portray some essential topological features of the compounds in numerical values as computed in Table S1. The proposed GFA-MLR model equation was given below:
Furthermore, the reliability of the GFA-MLR model was evaluated with the validation metrics such as LOF value of 0.1235, r2 (training set) of 0.8861, adjusted r2 of 0.8525, cross-validation (q2) of 0.7864, RMSE of 0.1350, of 0.7230, and
of 0.6872 which have all passed the model criteria of accepting QSAR model. The Y-Randomization test was ascertained via random scrambling of the response activity while keeping the model descriptors constant to create random models [Citation17]. The 50 random models were generated with low R2 and Q2 scores which attested that the original model is robust and not constructed by chance [Citation15]. The coefficient of determination for the Y-randomization test (
was computed as 0.7818 (≥0.5) which confirmed the reliability of the model generated as shown in Table S2. Hence, the validation criteria of the model fully agreed with the acceptable threshold parameters [Citation32]. The description name, variance inflation factor (VIF), and mean effect of the descriptors were presented in Table S3. The Pearson correlation of less than 0.5 signifies that there is no inter-correlation among each descriptor pair, while the VIF scores were calculated using EquationEq. 10
(10)
(10) , where R2 is the Pearson correlation coefficient for each descriptor pair.
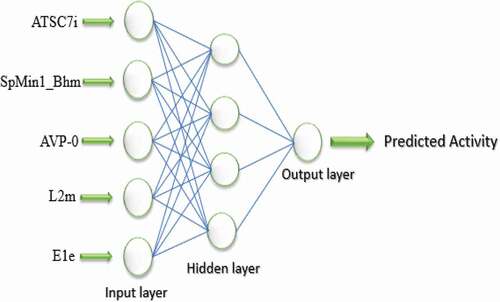
The VIF scores of the five (5) subset descriptors fall within the threshold limit (VIF< 10) suggesting void multicollinearity, which implies that the descriptors are orthogonal to one another [Citation33]. Similarly, the same five (5) subset descriptors selected from the GFA-MLR techniquewere utilized as inputs for the ANN model with a single hidden layer. The predicted anti-IAV activity (pEC50) of the compounds constitutes a single output layer, which is computed with the aid of a sigmoid transfer function. The model was built at a parameter set up (max epochs = 1000, momentum = 0.2, learning rate = 0.5, output layer learning rate = 0.44) using back-propagation algorithm [Citation34]. After numerous trials, a hidden layer with four neurons was selected due to its lowest RMSE value as shown in . Thus, a GFA-ANN with 5-4-1 neural architecture () was obtained with improved statistical validation parameters, such as r2 (training set) of 0.9163, cross-validation (q2) of 0.8739, RMSE of 0.1420, of 0.7368, and
of 0.6257 as shown in accordingly.
Figure 2. RMSE values of training set against the number of epochs and number of neurons in the hidden layer (1 to 5).
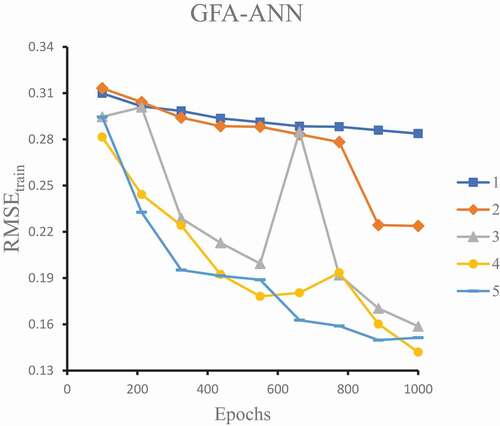
Figure 3. Schematic representation of the 5-4-1 neural architecture for the GFA-ANN model.
The relative contribution of each descriptor toward an increase or decrease in the anti-IAV responses is measured based on their mean effect scores (ME) defined as:
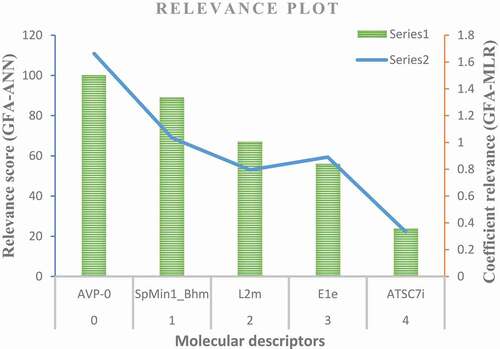
where βi represents the coefficient of the descriptor i and Di represent each descriptor score for a molecule and n represents the number of training set molecules [Citation35]. It was observed that SpMin1_Bhm and AVP-0 descriptors are the major contributors to the increase in the anti-IAV activity with positive mean effect scores of +0.7301 and +0.2361, respectively. In addition, the coefficient relevance and relevance scores were further computed to evaluate the influence of each descriptor used in building both GFA-MLR and GFA-ANN models, respectively, as shown in the relevance plot (). The coefficient relevance scores were computed from the GFA-MLR model using the available five (5) descriptors. Each coefficient relevance of a descriptor was computed through the multiplication of its model coefficient value and the standard deviation divided by the standard deviation of the target variable. Similarly, the relevance scores were computed from the GFA-ANN model, and each relevance score is computed by adapting all paths from the input layer neurons through the hidden neurons layers to the output neurons [Citation20]. The product of all absolute values of the connection weights is added to the relevance score, which is normalized within the range of 0 and 100. Hence, the degree of contribution of the descriptors based on the coefficient relevance and relevance scores follow the same trend; AVP-0 > SpMin1_Bhm > E1e > L2m > ATSC7i. This confirms the greatest effect of AVP-0 and SpMin1_Bhm on the prediction of the anti-IAV activity.
Figure 4. Relevance plot of the feature selected descriptors in the GFA-MLR and GFA-ANN models.
AVP-0 is a topological descriptor that gives information on the molecular connectivity indices computed using the Chi operator [Citation36]. It is an average valence path, a zero-order descriptor that usually depends on the number of the lone pair, π electrons, presence of heteroatoms, degree of flexibility, and branching in the compounds [Citation37]. SpMin1_Bhm represents an Eigen value-based descriptor known as the smallest absolute eigenvalue of Burden modified matrix with lag 1 weighted by the relative atomic mass, while L2m is the 2nd component size directional Weighted Holistic Invariant Molecular (WHIM) descriptor also weighted by the relative atomic mass [Citation37]. These two descriptors mainly describe the molecular structure in terms of size, shape, and symmetry as functions of some invariant reference frame.
E1e descriptor is the first component accessible directional WHIM index weighted by the relative Sanderson electronegativity computed from the principal component of the molecular coordinate of the structure [Citation37]. Hence, this proposed that the electronic distribution of atoms in the molecule had a significant effect on the anti-influenza activity of the compounds. ATSC7i is the centered Broto-Moreau autocorrelation – lag 7 weighted by first ionization potential which accounts for the electronic effects and degree of unsaturation in the molecular system [Citation36,Citation37].
Model error predictions (residuals) consist of three (3) important components such as random (variance), systematic (bias), and measurement (noise) error, but models are more affected by systematic errors [Citation38]. Therefore, a model with high systematic error should be reconstructed again to reduce the high level of bias. This is because bias redirects the data into an artificial course that could lead to the wrong interpretation [Citation19]. The ability of the GFA-MLR and GFA-ANN models in predicting the experimental activity of the compounds without any computational errors was assessed using the standardized residual versus anti-IAV response activity (pEC50) plots as shown in Figures. S1 and S2 where all standardized residual values fall within the definite threshold of ±2.0. Hence, this implies that the model is free of systematic error and can give a good prediction.
Model applicability domain of the 2D-QSAR model
The applicability domain of the 2D-QSAR model in chemical space where the model can make a reliable prediction based on the five (5) defined model descriptors stated earlier. In this study, the leverage approach was applied to examine the chemical space of the GFA-ANN model. The standardized residuals computed were plotted against the leverage values for all molecules (Williams plot) to identify the response and structural outliers as presented in . Interestingly, all molecules in the dataset were confined within the standardized residual threshold limit of ±2.5 and leverage (h*) of 0.782, respectively. Therefore, the model predicted no response or a structural outlier.
Figure 5. Scatter plot of the leverage scores against standardized residuals of the GFA-ANN model (Williams plot).
Statistical validation results for the 3D-QSAR models
Before building the 3D-QSAR models, the optimized structures were automatically placed into a training set (24 compounds) and test set (8 compounds) based on the structural diversity method using Sybyl-X 2.1.1 program. Subsequently, the CoMFA model was built with both electrostatic and steric field contributions as the independent variables of the training set and was further exposed to cross-validation of PLS regression analysis. The statistical validation results of the CoMFA_ES model are r2 (0.59 with 4 latent components), non-cross validated r2 value (0.925), and SEE (0.1538). However, the statistical validation results from the various probable CoMFA models are summarized in .
Table 4. Statistical validation results of probable CoMFA models.
For the CoMSIA modeling study, the statistical validation results of all 30 probable models with different field combinations based on the five (5) different field descriptors were shown in Table S4. Furthermore, the CoMSIA-EAD model computed a higher q2 score of 0.767 with 3 components, a higher r2 value of 0.929, and a relatively low SEE of 0.1526. However, the best models among the possible CoMSIA models with their robust statistical validation and contribution fractions are summarized in . In addition, the validation metrics of all possible CoMFA and CoMSIA models were found within the benchmark scores for an acceptable QSAR model that was proposed by Alexander Golbraikh and Alexander Tropsha (q2 > 0.5 and r2 > 0.6). This implies that the validation metrics of the models generated are statistically reliable, which indicates their predictive potential and robustness [Citation38].
Table 5. Statistical validation results of the best 3D-QSAR models.
The graphs of predicted against experimental anti-IAV response effects (pEC50) for the training and test set compounds of the models revealed a satisfactory linear correlation, as presented in Figures. S3 and S4, respectively.
Contour map analysis of the CoMFA and CoMSIA models
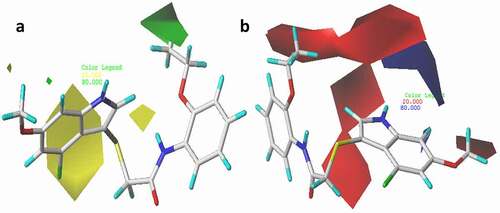
The utmost advantage of applying CoMFA and CoMSIA approaches is to be able to visualize the fields of the compounds influencing the variation of specific target properties in terms of contour maps. Compound 21 with the highest pEC50 was selected as a template to examine the most prominent field contributions for the studied dataset. The steric and electrostatic contour maps of the CoMFA_ES model for compound 21 were shown in ). The CoMFA contour maps provide valuable information on the regions around the compounds that can decrease or increase bioactivities. For steric contour maps, the green contour depicts that the desirable addition of bulky groups in the regions would increase the activity, while the yellow contours portrayed that the steric or bulky groups are undesirable in the region for increasing activity [Citation39]. In the electrostatic field contour maps, the red regions depict regions where electron-withdrawing groups enhance the activity, while the blue regions depict regions where electron-donating groups increase the activity. The green contour was predominantly distributed around the 2-EtO substituent on the benzene of compound 21, proposing the further introduction of bulky groups in the region would enhance the activity. Meanwhile, the yellow contours around the indole moiety of the same compound discourage further attachment of bulky fragments in the region, which would decrease the activity of the compound. The red contour near the hydrogen of the 2-EtO group of the compound suggests that attaching electronegative groups at the position may increase the anti-IAV activity of the compound.
Figure 6. 3D fields of the CoMFA model for the most active compound (21), (a) green area depict desirable steric bulk while yellow area disfavor steric bulk, (b) blue region favors positive charge and red region favors negative charge.
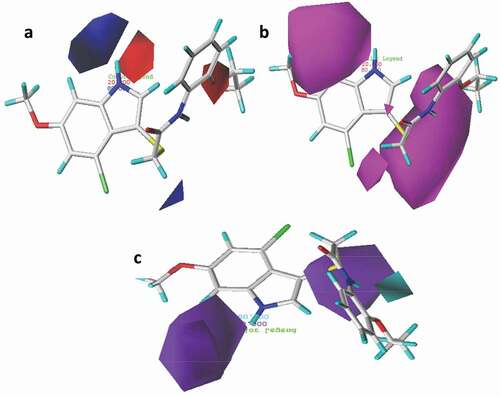
The 3D contour maps for the best CoMSIA_EAD model were shown in ), where the electrostatic contour map in the model is more or less similar to that of the CoMFA model. As such, the discussion will make more emphasis on the hydrogen-bond fields. For the hydrogen bond acceptor contour map ()), the magenta contours reveal the favorable acceptor regions and the red contours indicate unfavorable regions. Hence, the magenta contour was observed near position 6 of the benzene ring and sulfur atom at position 2 in the indole moiety of the same compound. The HBD contour map is presented in ), where the cyan contour depicts the HBD favorable region and the purple contour reveals unfavorable HBD regions for the HBD contour map. The purple contour was observed near the 2-EtO and -HN moiety of the same compound.
Figure 7. 3D fields contribution of the CoMSIA_EAD model for the most active compound (compound 21), (a) electrostatic contour map where blue region favor positive charge and red region favor negative charge, (b) magenta contour represent the region for desirable hydrogen bond acceptor while red area represents undesirable acceptor, (c) cyan contours represent the area for desirable hydrogen bond donor while purple area represents the undesirable donor.
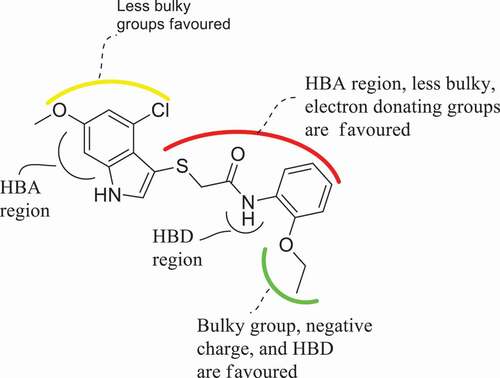
Based on the CoMFA and CoMSIA contour maps, the general strategy for improving the anti-IAV activity of the compound is summarized in . The outcome of this analysis theoretically reaffirmed the importance of the 2-ethoxyl substitution on aniline and halo substituent on the indole ring of the template compound for a higher IAV activity as similarly reported by Zhang et al., (2019) [Citation3]. Hence, the addition of more electronegative and steric groups in the highlighted regions is crucial in designing more hypothetical compounds with improved anti-IAV inhibitory effects.
Figure 8. General description of the 3D QSAR analysis.
Molecular docking results
The 2-((1 H-indol-3-yl)thio) acetamide derivatives (32 compounds) of the dataset were docked with the H1N1 neuraminidase receptor (PDB: 4B7Q) using MOE software as depicted earlier. Before the docking started, the co-crystalized zanamivir was extracted from the receptor, and then docked into the binding pocket to confirm the reliability of the docking algorithm used by the MOE program as well as to note the amino acid residues surrounding the ligand. The results revealed the docking scores of the best poses of the compounds ranging from −7.1303 to −5.8682 kcal/mol which confirmed their good potency when compared with the ribavirin (compound 32) as shown in . This observation is in agreement with the experimental findings of Zhang et al., (2019) on the potent inhibitory effect of the compounds.
Table 6. Molecular docking scores of the 2-((1 H-indol-3-yl)thio) acetamide derivatives as anti-IAV agents.
The compounds 16 and 21 were found to have higher binding scores of −7.1303 and −7.0431 kcal/mol, respectively, in comparison with others in the dataset. As such, these selected compounds are the most preferable candidates to be considered as lead molecules due to their higher anti-IAV (pEC50) and binding scores. elucidate the binding modes of compounds 16 and 21 with the active amino acid residues of the NA protein, respectively. The residual interactions of compound 16 revealed three (3) conventional H-bonds, four (4) carbon-H bonds, eight (8) electrostatic, and three (3) hydrophobic interaction types with different amino acid residues in the active site of the targeted receptor as summarized in . For the conventional H-bond interaction, the residues of ARG118, ARG293, and ARG368 behave as H-bond donors to the carbonyl oxygen (C = O) of the compound 16 as H-bond acceptors to form the conventional hydrogen bond interaction at different bond distances of 2.8159, 2.1645, and 2.1796 Å, respectively. Also, the hydrogen atoms of the methoxy (6-OCH3) group of the same compound behave as H-bond donors to the oxygen atoms of the ASP151, TRP179, GLU119, and ASP151 as the acceptors to form the carbon-H bond interactions at different bond distances. The 16-complex formed three different π-cation electrostatic interaction types with ARG152, ARG152, and ARG368 at interaction distances of 3.9068, 4.7185, and 3.0610 Å, respectively, while five different π-anion electrostatic interactions were conversely formed with ASP151 (4.1748 Å), ASP151 (4.3502 Å), GLU228 (4.6985 Å), GLU278 (3.4884 Å), and GLU278 (3.0477 Å) at different interaction distances accordingly. For the hydrophobic interaction, the 2-EtO group of the compound interacts with the alkyl group of ILE149 to form one (1) alkyl-alkyl hydrophobic interaction type at a distance of 4.3738 Å, while the remaining 2-hydrophobic interactions formed were as a result of the π-alkyl interaction type with ARG225 and PRO431 residues at 5.4696 Å and 4.4297 Å interaction distances, respectively.
Figure 9. 3D docking view of compound 16 with the H1N1 neuraminidase (PDB: 4B7Q): (a) the best pose of compound 16, (b) 3D hydrogen bond surfaces around the ligand, (c) 2D residual interaction of compound 21-complex.
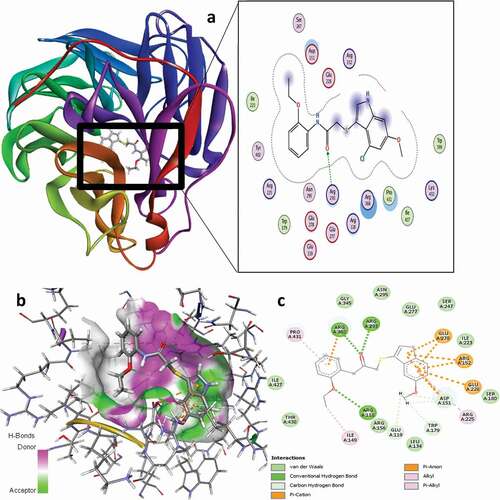
Figure 10. 3D docking view of compound 21 with the H1N1 neuraminidase (PDB: 4B7Q): (a) the best pose of compound 21, (b) 3D hydrogen bond surfaces around the ligand 21, (c) 2D residual interaction of compound 21-complex.
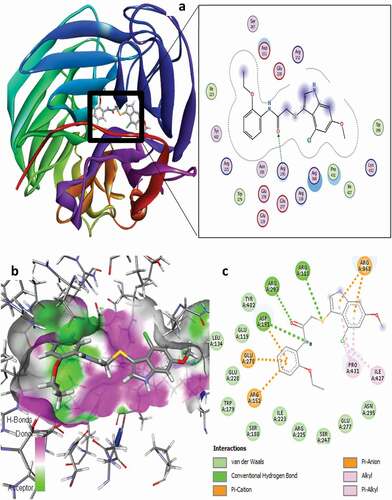
Table 7. Binding interaction of the H1N1 neuraminidase receptor with compound 16.
The residual interactions of compound 21 revealed three (3) conventional H-bonds, five (5) electrostatic, and six (6) hydrophobic interaction types with different amino acid residues at the active site of the targeted receptor as summarized in . For the conventional H-bond interaction, the residues of ARG118 and ARG293 behave as H-bond donors to the oxygen of carbonyl (C = O) and sulfur atom of compound 21 as H-bond acceptors to form the conventional hydrogen bond interactions at different bond distances of 3.0445 and 2.4928 Å, respectively, while the -NH group of the acetamide moiety in the compound behaves as the H-bond donor to the oxygen atom of ASP151 amino acid residue. The 21-complex formed three different π-cation electrostatic interaction types with ARG152 (4.5505 Å) and ARG368 (3.4231 Å & 3.4482 Å), while two different π-anion electrostatic interactions were formed with ASP151 (4.1664 Å) and GLU278 (3.4884 Å) at different interaction distances accordingly. For the hydrophobic interaction, the two alkyl-alkyl hydrophobic interaction types were formed with ILE427 and PRO431 at interaction distances of 4.3738 and 4.3713 Å, respectively, while the remaining 3-hydrophobic interactions formed were as a result of the Pi-alkyl interaction type with PRO431 residues at 3.9583 Å and 5.3386 Å interaction distances, respectively.
Table 8. Binding residual interaction of the H1N1 neuraminidase receptor with compound 21.
Score: the final docking score, rmsd_refine: the root mean square deviation between the pose before and after refinement, E_conf: the energy of the conformer. E_refine: core from the refinement stage, calculated to be the sum of the van der Waals electrostatics and solvation energies, under the Generalized Born solvation model (GB/VI), E_score1: Score from rescoring stages 1, E_place: Score from the placement stage, E_score2: Score from rescoring stages 2
Evaluation of drug-likeness and ADMET parameters
The physicochemical parameters of the compounds are usually evaluated and linked to some filter variants for drug-likeness appraisals based on certain rules such as Lipinski’s rule, Pfizer’s rule, GSK’s rule, and Golden triangle rule. Hence, physicochemical radar chart of the lead compounds 16 and 21 was generated from the ADMETlab 2.0 web server as shown in .
Figure 11. Physicochemical radar chart of the lead compounds.
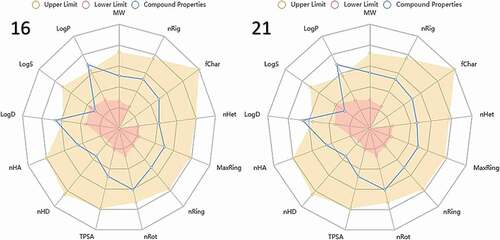
Most of the physicochemical properties for the selected compounds are within the upper limit (brown) except for Log P and Log D whose values are slightly above the optimal limit as presented in the radar charts. The selected lead compounds have also passed the Lipinski rule of five, as shown in . The Lipinski’s criteria for drug-likeness include molecular weight (MW ≤ 500 g/mol), n-octanol/water distribution coefficient (Log P ≤ 5), number of hydrogen bond acceptors (nHA ≤ 10), and number of hydrogen bond donors (nHD ≤ 5) [Citation40,Citation41]. It could be observed that the lead compounds have slightly higher Log P scores in comparison with the optimal limit (0 < Log P < 3). This suggests that the compounds have low aqueous solubility and good oral bioavailability [Citation42,Citation43]. The Log P also gives information on the cellular membrane permeability and hydrophobic binding to macromolecules, such as the target receptors, plasma proteins, metabolizing enzymes, or transporters [Citation44]. However, zanamivir and oseltamivir have lower Log P scores of 1.013 and −1.317 which tend to experience difficulty in penetrating the lipid bilayer of the cell membrane.
Table 9. Lipinski’s rule parameters of compounds 16 and 27.
The quantitative estimate of drug-likeness (QED), synthetic accessibility (SA) scores, and other drug-likeness rules of the selected compounds are also evaluated in ). The QED scores of the compounds are less than 0.67 signifying unattractive measures as drug-like compounds, but they are predicted to be easily synthesized due to their low SA scores of less than 6. The lead compounds were observed to satisfy other drug-likeness rules as shown in .
Table 10. Drug-likeness evaluation of compounds 16 and 21 based on Ghose, Veber, Egan, Muegge, QED and SA scores.
Some of the relevant computed ADMET parameters include human intestinal absorption (HIA), human colon adenocarcinoma cell lines (Caco-2) permeability, Madin−Darby Canine Kidney cells (MDCK) permeability, plasma glycoprotein (Pgp) inhibitor, plasma glycoprotein (Pgp) substrate, plasma protein binding (PPB), volume distribution (VD), blood–brain barrier (BBB) penetration, human cytochromes (CYP), clearance (CL), half-life (T1/2), AMES toxicity, carcinogenicity (Carc), eye irritation (EI), respiratory toxicity (RT) as shown in . The Caco-2 cell permeability has been an imperative index for an eligible drug candidate, which is linked with human intestinal absorption [Citation41]. The lead compounds were considered to have proper Caco-2 cell permeability because their values are higher than the optimal score of −5.15 log cm/s. The MDCK permeability is employed as an in-vitro model for permeability screening, and its apparent coefficient is used to evaluate the efficiency of chemicals in the body, and also to estimate the effect of the blood–brain barrier. The lead compounds were predicted to have low MDCK permeability due to lower computed coefficients when compared with the optimal score of 2.0 × 10⁻⁵ cm/s. The output results of the lead molecules revealed an excellent probability of being Pgp non-inhibitor and Pgp non-substrate whose range of values is within 0 and 1. PPB is one of the most important mechanisms of drug uptake and distribution resulting from the drug-protein bindings in the plasma, which strongly affects the pharmacodynamic behavior of the drug [Citation45]. The lead compounds were also predicted to have a high value of PPB (>90%) depicting a broad therapeutic index. The volume distribution (VD) is used to correlate the administered drug dose with the actual concentration in the system, which describes the in-vivo distribution [Citation45]. As such, the lead compounds are predicted to have proper VD values, which are within the range of 0.04–20 L/kg. The BBB permeated output of the lead molecules was classified as BBB+ category whose predicted values are > −1. For the metabolism, the predicted outputs revealed the probabilities of being either lead inhibitors or substrates of CYPs (1A2, 3A4, 2C9, 2C19, and 2D6) isoenzymes ranging from 0 to 1. The clearance of a drug (CL) is also an important pharmacokinetic measure that describes how the drug is excreted from the body. The clearance penetration results of the lead compounds 16 and 21 with probability values of 8.746 and 7.328 mg/min/kg, respectively, are predicted to have low clearance levels. Hence, none of the compounds showed any serious toxicity profile threats with respect to AMES mutagenicity, eye irritation and respiratory toxicity.
Table 11. ADMET properties of the lead molecules in the dataset.
Conclusion
In conclusion, the study utilized some molecular modeling concepts, such as 2D-QSAR, 3D-QSAR, molecular docking, and ADMET predictions on 32 analogs of 2-((1 H-indol-3-yl)thio) acetamide as IAV inhibitors to theoretically visualize the various lead compounds. The 2D-QSAR (GFA-MLR and GFA-ANN) models with the feature selected descriptors such as AVP-0, SpMin1_Bhm, E1e, L2m, and ATSC7i were found to have reliable anti-IAV activity predictions. The 3D-QSAR models further revealed the prominence of steric, electrostatics, H-bond acceptors and donor regions for improving anti-IAV activity of the compounds based on CoMFA and CoMSIA methods. The statistical validation of both 2D-QSAR and 3D-QSAR were all within the global benchmarks for accepting QSAR models, which supports the predictive competence of the models. The molecular docking results showed a good consistency with our 2D-QSAR and 3D-QSAR studies, and two lead compounds (16 and 21) were identified as the possible candidates for future in-silico design and search of more potent anti-IAV compounds with improved activities. Moreover, the drug-likeness and ADMET predictions of the lead compounds revealed non-violation of Lipinski’s rule, good pharmacokinetic and toxicity profiles. Thus, the outcome of this theoretical study identified the possible lead compounds for future in-silico exploration of improved anti-influenza agents.
Authors’ contribution
MA conceptualized the methodology, analyzed the results, and drafted the manuscript. AU supervised the entire work and gave technical advice. PAM also gives technical advice in the drafting preparation. GAS also gave technical advice in formal analysis and investigation. MTI contributed to the conceptualization, data curation, and original draft preparation.
Disclosure statement
No potential conflict of interest was reported by the author(s).
References
- Avila G, Cruz-Licea V, Rojas-Espinosa K, et al. Influenza A H1N1 virus 2009 synthetic hemagglutinin and neuraminidase peptides for antibody detection. Arch Med Res. 2020;51(5):436–443.
- Korsten K, Adriaenssens N, Coenen S, et al. World Health Organization influenza-like illness underestimates the burden of respiratory syncytial virus infection in community-dwelling older adults. J Infect Dis. 2021.
- Zhang G-N, Li Q, Zhao J, et al. Design and synthesis of 2-((1H-indol-3-yl) thio)-N-phenyl-acetamides as novel dual inhibitors of respiratory syncytial virus and influenza virus A. Eur J Med Chem. 2020;186:111861.
- Aleebrahim-Dehkordi E, Molavi B, Mokhtari M, et al. T helper type (Th1/Th2) responses to SARS-CoV-2 and influenza A (H1N1) virus: from cytokines produced to immune responses. Transpl Immunol. 2022;70:101495.
- Abed Y, Bouhy X, L’Huillier AG, et al. The E119D neuraminidase mutation identified in a multidrug-resistant influenza A(H1N1)pdm09 isolate severely alters viral fitness in vitro and in animal models. Antiviral Res. 2016;132:6–12.
- Adams SE, Lee N, Lugovtsev VY, et al. Effect of influenza H1N1 neuraminidase V116A and I117V mutations on NA activity and sensitivity to NA inhibitors. Antiviral Res. 2019;169:104539.
- Hayden FG, Asher J, Cowling BJ, et al. Reducing influenza virus transmission: the potential value of antiviral treatment. Clin Infect Dis. 2022;74(3):532–540.
- Abdullahi M, Das N, Adeniji SE, et al. In-silico design and ADMET predictions of some new imidazo [1, 2-a] pyridine-3-carboxamides (IPAs) as anti-tubercular agents. J Clin Tuberculosis Other Mycobacterial Dis. 2021;25:100276.
- Al-Attraqchi OHA, Venugopala KN. 2D- and 3D-QSAR modeling of imidazole-based glutaminyl cyclase inhibitors. Curr Comput Aided Drug Des. 2020;16(6):682–697.
- Ibrahim MT, Uzairu A, Shallangwa GA, et al. Structure-based design and activity modeling of novel epidermal growth factor receptor kinase inhibitors; an in silico approach. Sci Afr. 2020;9:e00503.
- Abdullahi M, Shallangwa GA, Uzairu A. In silico QSAR and molecular docking simulation of some novel aryl sulfonamide derivatives as inhibitors of H5N1 influenza A virus subtype. Beni-Suef Univ J Basic Appl Sci. 2020;9(1):1–12.
- Abdullahi M, Adeniji SE, Arthur DE, et al. Quantitative structure-activity relationship (QSAR) modelling study of some novel carboxamide series as new anti-tubercular agents. Bull National Res Centre. 2020;44(1):1–13.
- Yap CW. PaDEL‐descriptor: an open source software to calculate molecular descriptors and fingerprints. J Comput Chem. 2011;32(7):1466–1474.
- Ahamad S, Islam A, Ahmad F, et al. 2/3D-QSAR, molecular docking and MD simulation studies of FtsZ protein targeting benzimidazoles derivatives. Comput Biol Chem. 2019;78:398–413.
- Roy K, Kar S, Das RN. Statistical methods in QSAR/QSPR. A primer on QSAR/QSPR modeling. Springer; 2015. p. 37–59.
- Apablaza G, Montoya L, Morales-Verdejo C, et al. 2D-QSAR and 3D-QSAR/CoMSIA studies on a series of (R)-2-((2-(1H-Indol-2-yl)ethyl)amino)-1-phenylethan-1-ol with human beta(3)-adrenergic activity. Molecules. 2017;22(3).
- Roy K, Das RN, Ambure P, et al. Be aware of error measures. Further studies on validation of predictive QSAR models. Chemometr Intell Lab Syst. 2016;152:18–33.
- Bouakkadia A, Kertiou N, Amiri R, et al. Use of GA-ANN and GA-SVM for a QSPR study on the aqueous solubility of pesticides. J Serb Chem Soc. 2021;86(7–8):673–684.
- Umar BA, Uzairu A, Shallangwa GA, et al. QSAR modeling for the prediction of pGI50 activity of compounds on LOX IMVI cell line and ligand-based design of potent compounds using in silico virtual screening. Network Model Anal Health Inf Bioinf. 2019;8(1):1–10.
- El Aissouq A, Toufik H, Lamchouri F, et al., editors. QSAR study of isonicotinamide derivatives as Alzheimer's disease inhibitors using PLS-R and ANN methods. 2019 International Conference on Intelligent Systems and Advanced Computing Sciences (ISACS); 2019: IEEE.
- Gramatica P. Principles of QSAR modeling: comments and suggestions from personal experience. Int J of Quantitative Struct-Pro Relat (IJQSPR). 2020;5(3):61–97.
- Vucicevic J, Nikolic K, Mitchell JBO. Rational drug design of antineoplastic agents using 3D-QSAR, cheminformatic, and virtual screening Approaches. Curr Med Chem. 2019;26(21):3874–3889.
- Vishwakarma K, Bhatt H. Molecular modelling of quinoline derivatives as telomerase inhibitors through 3D-QSAR, molecular dynamics simulation, and molecular docking techniques. J Mol Model. 2021;27(2):30.
- Goudzal A, El Aissouq A, El Hamdani H, et al. 3D-QSAR modeling and molecular docking studies on a series of 2, 4, 5-trisubstituted imidazole derivatives as CK2 inhibitors. J Biomol Struct Dyn. 2022;1–15.
- Aouidate A, Ghaleb A, Ghamali M, et al. Computer aided drug design based on 3D-QSAR and molecular docking studies of 5-(1H-indol-5-yl)-1,3,4-thiadiazol-2-amine derivatives as PIM2 inhibitors: a proposal to chemists. Silico Pharmacol. 2018;6(1):5.
- Vavricka CJ, Li Q, Wu Y, et al. Structural and functional analysis of laninamivir and its octanoate prodrug reveals group specific mechanisms for influenza NA inhibition. PLoS Pathog. 2011;7(10):e1002249.
- Ahmed MF, Santali EY, El-Haggar R. Novel piperazine–chalcone hybrids and related pyrazoline analogues targeting VEGFR-2 kinase; design, synthesis, molecular docking studies, and anticancer evaluation. J Enzyme Inhib Med Chem. 2021;36(1):307–318.
- Shakour N, Hadizadeh F, Kesharwani P, et al. 3D-QSAR studies of 1,2,4-oxadiazole derivatives as sortase A inhibitors. Biomed Res Int. 2021;2021:6380336.
- Aziz M, Ejaz SA, Tamam N, et al. Identification of potent inhibitors of NEK7 protein using a comprehensive computational approach. Sci Rep. 2022;12(1):1–17.
- Kar S, Roy K, Leszczynski J. In silico tools and software to predict ADMET of new drug candidates. In: Silico methods for predicting drug. Toxicity: Springer; 2022. p. 85–115.
- Babalola S, Igie N, Odeyemi I. Structure-based discovery of multitarget directed anti-inflammatory p-nitrophenyl hydrazones; molecular docking, drug-likeness, in-silico pharmacokinetics, and toxicity studies. 2022.
- Tropsha A. Best practices for QSAR model development, validation, and exploitation. Mol Inform. 2010;29(6‐7):476–488.
- Thompson CG, Kim RS, Aloe AM, et al. Extracting the variance inflation factor and other multicollinearity diagnostics from typical regression results. Basic and Appl Social Psychol. 2017;39(2):81–90.
- Satpathy R, Guru RK, Behera R. Computational QSAR analysis of some physiochemical and topological descriptors of Curcumin derivatives by using different statistical methods. J Chem Pharm Res. 2010;2(6):344–350.
- Wang T, Tang L, Luan F, et al. Prediction of the toxicity of binary mixtures by QSAR approach using the hypothetical descriptors. Int J Mol Sci. 2018;19(11):3423.
- Begum S, Jaswanthi P, Lakshmi BV, et al. QSAR studies on indole-azole Analogues using DTC tools; imidazole ring is more favorable for aromatase inhibition. J Indian Chem Soc. 2021;98(1):100016.
- Consonni V, Todeschini R. Molecular descriptors for chemoinformatics: volume I: alphabetical listing/volume II: appendices. References: John Wiley & Sons; 2009.
- Shirvani P, Fassihi A. In silico design of novel FAK inhibitors using integrated molecular docking, 3D-QSAR and molecular dynamics simulation studies. J Biomol Struct Dyn. 2021;1–19.
- Gu X, Wang Y, Wang M, et al. Computational investigation of imidazopyridine analogs as protein kinase B (Akt1) allosteric inhibitors by using 3D-QSAR, molecular docking and molecular dynamics simulations. J Biomol Struct Dyn. 2021;39(1):63–78.
- Chauhan K, Singh P, Kumar V, et al. Investigation of Ugi-4CC derived 1H-tetrazol-5-yl-(aryl) methyl piperazinyl-6-fluoro-4-oxo-1,4-dihydroquinoline-3-carboxylic acid: synthesis, biology and 3D-QSAR analysis. Eur J Med Chem. 2014;78:442–454.
- Ahmed A, Saeed A, Ejaz SA, et al. Novel adamantyl clubbed iminothiazolidinones as promising elastase inhibitors: design, synthesis, molecular docking, ADMET and DFT studies. RSC Adv. 2022;12(19):11974–11991.
- Arámburo-Gálvez JG, Arvizu-Flores AA, Cárdenas-Torres FI, et al. Prediction of ACE-I inhibitory peptides derived from chickpea (Cicer arietinum L.): in silico assessments using simulated enzymatic hydrolysis, molecular docking and ADMET evaluation. Foods. 2022;11(11):1576.
- Adianingsih OR, Khasanah U, Anandhy KD, et al. In silico ADME-T and molecular docking study of phytoconstituents from Tithonia diversifolia (Hemsl.) A. Gray on various targets of diabetic nephropathy. J Pharm & Pharmacogn Res. 2022;10(4):571–594.
- Dowdy SF, Setten RL, Cui X-S, et al. Delivery of RNA therapeutics: the great endosomal escape! Nucleic Acid Ther. 2022.
- Xiong G, Wu Z, Yi J, et al. ADMETlab 2.0: an integrated online platform for accurate and comprehensive predictions of ADMET properties. Nucleic Acids Res. 2021;49(W1):W5–W14.