
ABSTRACT
Hepatocellular carcinoma (HCC) is the fourth cause of cancer mortality worldwide. Metformin is an antidiabetic drug that showed a prophylactic effect in the early stages of some cancers. This study aimed to reevaluate the anticarcinogenic effect of metformin in a cancer model not associated with diabetes. Also, to evaluate the effect of pharmacological antidiabetic dose of metformin (used in cancer studies) at the early stages of HCC versus the sub-pharmacological dose. HCC was induced by a single i.p injection of diethylnitrosamine followed by 16 biweekly i.p injections of carbon-tetrachloride. Metformin was i.p injected (25 or 250 mg/kg) post HCC induction for four weeks. The low dose of metformin suppressed HCC by reducing liver biomarkers levels, and the number and size of hepatic nodules. Also, metformin (25 mg/kg) downstaged HCC via activating Bax and suppressing Bcl-2, VEGF, and PCNA. Mice treated with metformin (250 mg/kg) exhibited lactic acidosis, death, and insignificant differences in nodules’ number and size and immunohistochemical markers compared to the HCC group. This study concluded that the pharmacological dose of metformin cannot be used at advanced stages of HCC, while the sub-pharmacological dose of metformin showed a promising anticarcinogenic effect in chemically-induced HCC model not associated with diabetes. .
Introduction
Liver carcinoma (HCC) is the most common type of cancer worldwide. It is the fourth leading cause of cancer-related deaths [Citation1], causing 830,200 deaths globally in 2020 [Citation2]. Despite the advances in diagnosis, HCC prognosis remains poor, and the disease is usually diagnosed in advanced stages [Citation3]. Thus, surgical treatment becomes difficult to apply [Citation4], making chemotherapy the first treatment option for advanced HCC [Citation5]. However, the toxicity of chemotherapy, adverse side effects to multiple organ systems, and drug resistance, plus its high cost remain the main barriers to their successful clinical application [Citation6]. This encouraged researchers to discover and develop natural and herbal-based medications for cancer treatment with fewer side effects and high efficacy in comparison to chemical drugs [Citation7,Citation8].
Metformin, a biguanide extracted from the herb Galega officinalis [Citation9], is one of the most prescribed antidiabetic oral drugs [Citation10] due to its efficacy, minimum side effects and inexpensive cost [Citation11]. Metformin improves insulin sensitivity and reduces hepatic gluconeogenesis by increasing peripheral glucose uptake by the muscles and lowering fasting and post-prandial plasma glucose concentrations [Citation11]. Metformin was also reported to enhance the antiproliferative effects of cisplatin, tamoxifen and paclitaxel in lung, breast and prostate cancers [Citation12,Citation13]. In the last decade, many studies indicated that metformin helps in reducing the mortality caused by different types of cancers in humans [Citation14], as well as experimental animals [Citation15–17]. Metformin-mediated cancer suppression occurs through a variety of mechanisms, including cancer cell growth inhibition, increased apoptosis, induced cell cycle arrest and metastasis inhibition [Citation18].
Although the various studies reported an anticarcinogenic effect of metformin, most of these studies reported the effect of metformin on cancer associated with diabetes, or studied the early stages of cancer [Citation19,Citation20]. Also, metformin doses used in these studies were pharmacological doses used as anti-diabetic. So, the present work was performed to evaluate the anticarcinogenic effect of metformin against advanced stages of hepatocellular carcinoma not associated with diabetes and to evaluate the pharmacological antidiabetic dose of metformin versus subpharmacological dose for possible use in oncology.
Materials and methods
Chemicals
Diethylnitrosamine (DEN) was purchased from Sigma-Aldrich (0.95 g/ml; Sigma N0258-1 G; St. Louis, MO, USA). Carbon tetrachloride was obtained from Research Lab (Serial# 02076; Batch# 02076170415). Metformin hydrochloride (Glucophage® 1000 mg, equivalent to 780 mg of metformin) was bought from Minapharm (10th of Ramadan, Egypt). Kits for determining serum alanine aminotransferase (ALT; catalog # 41280), aspartate aminotransferase (AST; catalog # 41264), and albumin (ALB; catalog # 1001291) were purchased from SPINREACT, S.A./S.A.U. (Ctra. Santa. Coloma, Spain). Alkaline phosphatase (ALP; catalog # 214002) kit was from SPECTRUM Diagnostics (Cairo, Egypt). Bilirubin (Bil; catalog # 235672), and lactate dehydrogenase (LDH; catalog # 197000) kits were from ABCAM (United Kingdom). Mouse alpha- fetoprotein (AFP) ELISA kit was from CUSABIO (Catalog # CSP- E08282m; San Diego, CA, USA).
Animals
Seventy healthy male albino mice (Mus musculus) of CD1 strain, eight-week-old, weighing 18–23 g, were obtained from the Biological Unit of Theodore Bilharz Institute (Giza, Egypt). Animals were acclimatized to laboratory conditions for 1 week before the start of the experiments. Animals were kept under good ventilation with a 12-h cycle of light and dark and a temperature of 23–25°C. The animals were given free access to water and standard rodent food pellets. All animal experiments comply with the National Institutes of Health guide for the care and use of laboratory animals (NIH Publications No. 8023, revised 1985), and the experimental protocol was approved by Zoology Department (9/11/2018), Faculty of Science, Ain Shams University.
Experimental design and induction of HCC
As shown in , the animals were randomized into two major groups, as follows: Group I (n = 10): normal untreated mice that received the vehicle (negative control group); Group II (n = 60): HCC control group. HCC was induced chemically with DEN/CCl4 model [Citation21]. The initiator in this protocol is a single intraperitoneal injection (i.p.) of diethylnitrosamine (DEN) (100 mg/kg) freshly diluted in sterile 0.9% sodium chloride saline. Two weeks later, the animals received repeated biweekly i.p. injections of CCl4 (0.5 ml/kg b.wt. dissolved in sterile corn oil) for 16 weeks to promote the carcinogenic effect of DEN. At the end of the 18th week of the experiment the survived mice in HCC control group was 31, then this group was subdivided into three groups as follows:
Figure 1. A representative graph of the experimental design.
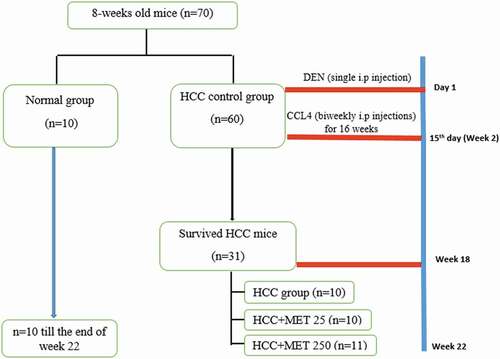
HCC group (N = 10)
HCC+MET 25 (N = 10): HCC mice were treated with metformin (i.p.,25 mg/kg) daily for 4 weeks
HCC+MET250 (N = 11): HCC mice were treated with metformin (i.p., 250 mg/kg) daily for 4 weeks.
The dose 250 mg/kg was selected for this study because it was tested frequently for its anticarcinogenic effect [Citation12,Citation22], as it is considered the conventional dose of metformin in mice [Citation23], which corresponds to 1500 mg/day for an adult human
Although the dose 25 mg/kg metformin is less than the minimum effective dose of metformin (which is 500 mg/ day for an adult human weighing 70 kg); however, we selected this dose because it showed effective antidiabetic effect in many studies [Citation24–26]. This dose was also tested for its anti-tumor effect in few studies such as the study of Song et al. [2012, Citation27]. Moreover, this dose is 1/10 of the dose that caused 100% mortality in HCC- mice.
Sample collection
Twenty-two weeks after the beginning of the experiment, the animals were weighed, and then euthanized by diethyl ether inhalation. Blood samples were taken from each animal after a fasting period of 12–14 h from the orbital vein. The samples were allowed to clot at room temperature, and then centrifuged for 15 min to obtain sera. After that, the animals were sacrificed by cervical dislocation. The animals were then necropsized and the livers were excised, washed in saline, and blotted dry. The livers were then examined for gross lesions, weighed and the size, color and texture were recorded. The visible nodules on the liver surface were counted. Liver pieces were fixed in 10% neutral buffered formalin solution and embedded in paraffin for histological and immunohistochemical investigations.
Biochemical assays
Serum alanine aminotransferase (ALT), aspartate aminotransferase (AST), alkaline phosphatase (ALP), total bilirubin, albumin and lactate dehydrogenase were assayed according to manufacturer’s instructions using commercially available colorimetric kits. Serum alpha-fetoprotein (AFP), tumor marker specific for HCC, was measured with ELISA technique.
Histopathological study
Liver pieces (including visible nodules) were fixed in 10% neutral buffered formalin for 24 hr. After that, the samples were washed in running tap water overnight. Samples then were dehydrated in ascending series of alcohol, cleared in terpineol, and then embedded in paraffin wax. Transverse sections, 5 µm thick, were cut on a rotary microtome, stained with hematoxylin and eosin [Citation28], and were examined using Leitz microscope. Hepatocytic proliferative nodules were classified according to established criteria of the ‘International Classification of Rodent Tumors’ [Citation29].
Some HCC slides were stained with silver impregnation to reveal the reticulin fiber network and detect the neoplastic lesion growth pattern. The silver nitrate staining solution was prepared according to the method of Crocker & Par [Citation30] by resolving gelatin in 1% aqueous formic acid at a concentration of 2%. This solution was then mixed, 1: 2 volumes, with 50% aqueous silver nitrate solution, to give the final working solution. This was poured over the tissue sections (5 µm thick) and left for 30 to 60 min at 20°C. The silver colloid was then washed off with deionized water. The sections were dehydrated to xylene and mounted in synthetic medium [Citation31].
Immunohistochemical study
Immunohistochemical detection of proliferating cell nuclear antigen (PCNA), Bax, Bcl-2 and vascular endothelial growth factor (VEGF) were performed using avidin–biotin–peroxidase technique. The following antibodies were used: BAX (catalog # YPA2175, Changqing Biospes, China), BCL2 (catalog # AF613, Affinity Biosciences, USA), PCNA (catalog # GB1101, Service bio Technology, China), and VEGF (catalog # bs-1957 R, Bioss AntiBoDies, USA). Positive immunoreactions appeared as brown coloration.
Statistical analysis
Numerical data are reported as mean values and standard deviation. GraphPad Prism (version 5.0, GraphPad software, San Diego, CA, USA) was used to perform all statistical analyses. Data were analyzed statistically using One-way analysis of variance (ANOVA) followed by post hoc multiple comparisons (Tukey’s test) for comparative analysis between the groups. P < 0.05 was considered statistically significant.
Results
Survival rate
The normal control group showed no deaths (survival rate: 100%) during the 22 weeks of the experiment. On the other hand, the survival rate of HCC group reached 52% till the 18th week (31 mice survived out of 60). The surviving animals of this group were hypoactive with yellowish fur and abdominal edema. At the beginning of week 19, HCC surviving animals were divided into HCC control (n = 10), HCC treated with metformin (25 mg/kg; n = 10), and HCC treated with metformin (250 mg/kg; n = 11). HCC control animals showed no mortality from week 19 to 22 (n = 10).
In HCC group treated with metformin 25 mg/kg, 1 mouse died at the 3rd week of treatment (survival rate: 90%; n = 9). However, the surviving animals of this group showed none of the clinical symptoms of the mice of HCC control group.
On the other hand, treating HCC mice with the higher dose of metformin 250 mg/kg aggravated symptoms of metformin-induced lactic acidosis, manifested as general fatigue, shortness of breath, and weakness, in addition to poor appetite and diarrhea. This was followed by stupor, coma, and death. These symptoms were severe and rapid (appeared 1 to 3 hours after the first metformin injection). However, only two mice survived from this group; but when they started showing signs of death on the 9th day of metformin treatment, they were humanely sacrificed, and their blood and liver samples were taken to investigate the reason of their death. Thus, the mortality rate in this group was considered 100%.
Gross morphology
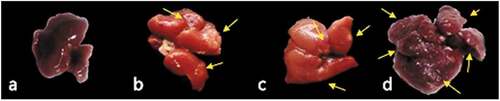
The normal control group showed no nodules on gross examination, and the livers had normal appearance, size and color as shown in and . On the other hand, livers of HCC mice had pale color () and significantly increased relative weight (). These changes were accompanied by the appearance of many nodules of different sizes on the surface of the livers of all the mice of this group ( and ). In the HCC group treated with metformin (25 mg/kg), the relative weight of the liver was not significantly decreased, however, the incidence and number of the nodules were significantly decreased (; ). On the other hand, the group treated with the high dose of metformin (250 mg/kg) showed no significant difference in the relative weight of the liver or the number of nodules compared to HCC control group (; ).
Table 1. Effect of metformin on liver relative weight and nodular count in HCC-bearing mice.
The normal control group showed no nodules on gross examination, and the livers had normal appearance, size and color as shown in and . On the other hand, livers of HCC mice had pale color () and significantly showed increased relative weight (hepatomegaly) (). The clearly noticed hepatomegaly was attributed to the appearance of many nodules of different sizes on the surface of the livers of all the mice of this group ( and ). These nodules were categorized into three sizes (>5 mm, 2–5 mm, and <2 mm). The liver of the control HCC mice exhibited significant increase in the numbers of various sizes of nodules, indicating the incidence of the advanced stage of HCC, in comparison with normal mice (P < 0.001). On the contrary, the treatment of HCC mice with metformin (25 mg/kg) showed significant down-staging of HCC incidence (), represented by significant reduction in the counts of all the sizes of nodules (78.90% in >5 mm, 65.40% in 2–5 mm, and 64.80% in <2 mm), in comparison with nodular counts in the liver of control HCC mice (P < 0.001). Similarly, the same down-staging of HCC and nodular count in the liver of HCC mice was observed upon treatment with metformin (250 mg/kg) (). The >5 mm nodules count was significantly reduced by 92.60% and <2 mm nodules count was reduced by 78.50%, whereas the 2–5 mm nodules count was insignificantly reduced by 23.40%.
Figure 2. Effect of metformin on Kaplan-Meier survival curve in HCC-bearing mice.
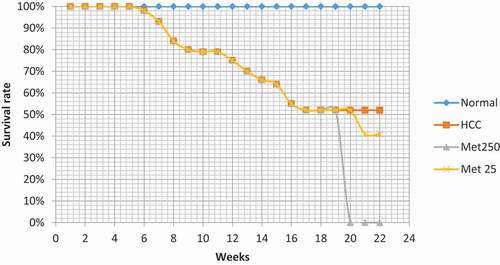
Figure 3. Liver gross morphology in HCC-bearing mice. (a) Normal, (b) HCC control, (c) HCC treated with metformin 25 mg/kg and (d) HCC treated with metformin 250 mg/kg.
Biochemical results
The data in illustrate the effect of metformin treatment on biochemical parameters in HCC-bearing mice. HCC control mice showed highly significant increase (P < 0.001) in the liver tumor marker AFP and in the serum liver enzymes AST, ALT, ALP, along with total bilirubin, lactate dehydrogenase concentrations. The results of the same group also showed significant decrease (P < 0.001) in serum albumin concentration when compared with normal control group.
Table 2. Effect of Metformin on serum enzymatic hepatic parameters in HCC-bearing mice.
Table 3. Effect of metformin on serum non-enzymatic hepatic parameters in HCC-bearing mice.
When treating HCC mice with metformin (25 mg/kg), the biochemical results were significantly improved compared with those of the HCC control group. Metformin decreased the elevated levels of liver enzymes and bilirubin, and significantly increased the decreased albumin compared with HCC untreated group. This dose of metformin showed no significant changes in the level of liver tumor marker AFP and lactate dehydrogenase activity between the HCC+Met25 group and HCC control group.
The higher dose of metformin (250 mg/kg) showed significant reduction in ALP activity. However, it showed no significant changes in the activities of ALT and AST and the levels of AFP between the HCC+Met250 group and HCC control group. However, this dose significantly elevated albumin level and reduced T.BIL level in the HCC+Met250 group in comparison with control HCC group (P < 0.001). Not surprisingly, the significant elevation in the lactate dehydrogenase activity in the HCC+Met250 group in comparison with control HCC group (P < 0.01). This might be the cause of the sudden death of the mice of this group before the completion of the treatment regime. As metformin-induced lactic acidosis was suspected to cause such mortality, the levels of lactate dehydrogenase were tested in the serum of the mice that survived for one week after administrating metformin.
Histological results
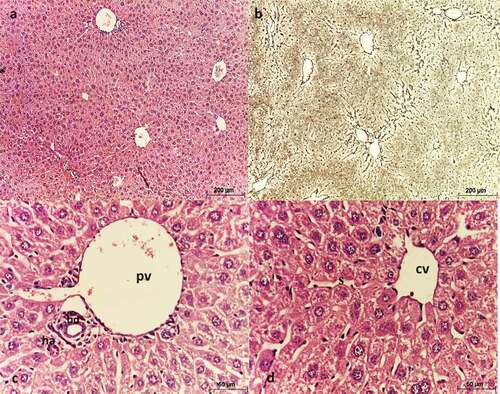
Liver sections of negative control mice showed normal lobular architecture (). These lobules were formed of 1 or 2 cell-thick hepatic strands, separated by hepatic sinusoids, and supported by a net of reticulin fibers (). At the periphery of each lobule, a portal triad is present (). Hepatocytes appeared polygonal in shape with eosinophilic cytoplasm and rounded nuclei with 1 or 2 nucleoli ().
Figure 4. Photomicrograph of sections of liver of negative control mice showing normal architecture. (a, c, & d) stained with Hx & E, (b) stained with silver nitrate. (a) shows each lobule has a central vein (CV) located in the center, (b) shows reticulin fibers distribution, (c) shows portal triad consisting of a branch of the portal vein (PV), a small branch of hepatic artery (ha) and a bile ductule (bd), (d) shows strands of hepatocytes separated by sinusoids around a central vein (cv).
On the contrary, liver sections of HCC control group showed signs of malignancy. The sections showed altered architecture with collapsed lobules forming tumor nodules (). The hepatic plates were not definable with the absence of portal triads. Instead, immature blood vessels (unpaired arteries) and strong fibrosis were present (&c). Hepatic tumor cells were pleomorphic, with eosinophilic cytoplasm and rounded nuclei with prominent nucleoli, along with fatty change and ballooning, which are characteristics of HCC ().
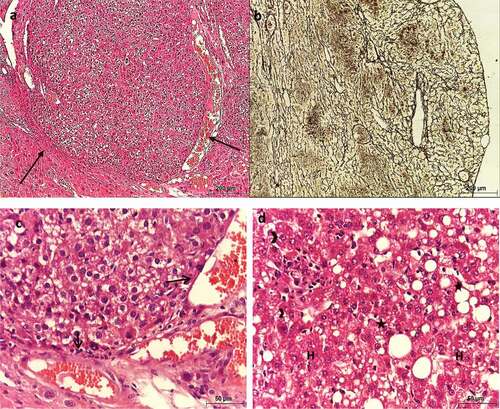
Figure 5. Photomicrograph of sections of liver of HCC control mice showing altered architecture of hepatic tissue. (a, c, & d) stained with Hx & E, (b) stained with silver nitrate. (a) shows the presence of nodules (arrows), (b) shows hepatic fibrosis and altered architecture, (c) shows the presence of unpaired arteries (arrows), and (d) shows pleomorphic hepatocytes (H), with strong eosinophilic cytoplasm and rounded nuclei with prominent nucleoli (arrowheads), along with macrovesicular steatosis (asterisks).
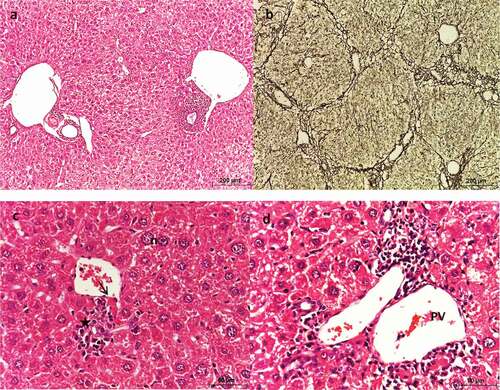
Metformin (25 mg/kg)-treated HCC liver sections showed slightly altered lobular architecture, mild fibrosis, and absence of HCC nodules (&b). Most hepatocytes restored their normal shape and size. They appeared polygonal with centrally located nuclei of different sizes (). However, mild inflammatory cell infiltration and apoptotic cells were noticed almost around all the blood vessels ().
Figure 6. Photomicrograph of sections of liver of HCC mice treated with MET (25 mg/kg) showing slightly altered architecture. (a, c & d) stained with Hx & E. (b) stained with silver nitrate. (a) shows slightly altered architecture, (b) shows mild fibrosis, (c) shows polygonal hepatocytes with centrally located nuclei (n) with different sizes, apoptotic cell (arrow), and inflammatory cells were noticed near the central vein (asterisks), and (d) shows the histological structure of the portal area.
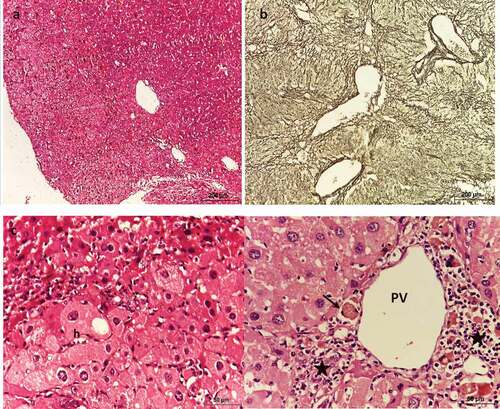
Metformin (250 mg/kg)-treated HCC liver sections showed significantly altered architecture due to the presence of nodules, as well as strong fibrosis (&b). The hepatic plates were not definite. The hepatocytes were pleomorphic with eosinophilic cytoplasm and large nuclei (). Nodular cells showed hypertrophy and vacuolation, but their nuclei lacked signs of malignancy ().
Figure 7. Photomicrograph of sections of liver of HCC mice treated with MET (250 mg/kg) showing altered architecture. (a & c) stained with Hx & E, (b) stained with silver nitrate. (a) shows hepatic lobules with numerous dilated portal veins and sinusoids. (b) shows fibrosis, (c) shows large and vacuolated hepatocytes (h) with large nuclei, and (d) shows dilated portal vein (PV), apoptotic cells (arrow) and periportal inflammation (asterisks).
Immunohistochemical results
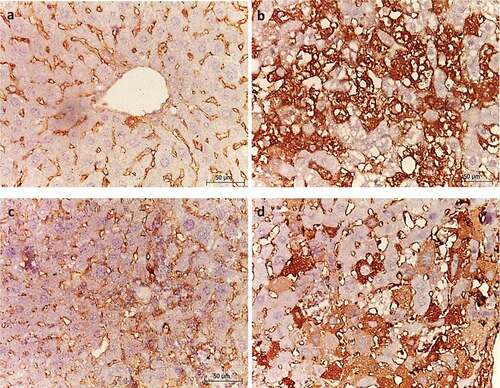
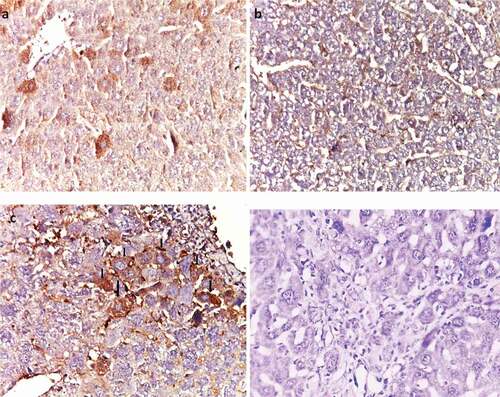
In the normal liver, VEGF was observed in the extracellular matrix of portal tracts and sinusoids (). The liver of HCC control group showed strong VEGF immunoreactivity in comparison with the normal group (). On the contrary, metformin (25 mg/kg)-treated group showed weak VEGF immunoreactivity compared with HCC control group (), and was comparable to that of normal group. However, metformin (250 mg/kg)-treated group showed moderate VEGF immunoreactivity compared to HCC control group ().
Figure 8. Effect of metformin on VEGF immunoreactivity. (a) Normal, (b) HCC control, (c) HCC- MET (25 mg/kg), (d) HCC- MET (250 mg/kg).
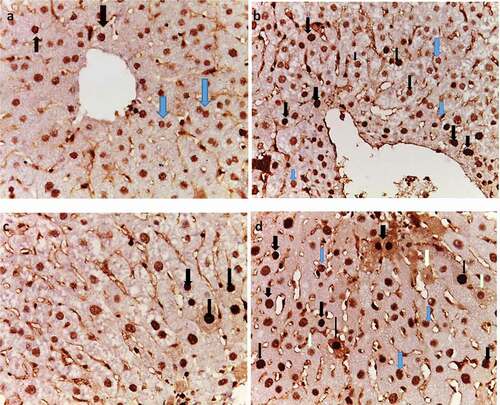
PCNA was expressed in the nuclei of normal hepatocytes showing stages of cell cycle as different shades of brown color (). Light brown nuclear staining represents G1-phase, while dark to very dark brown nuclear staining represents S-phase of cell cycle, which indicates proliferation. In HCC liver sections, PCNA was overexpressed compared with normal liver, especially S-phase (). Metformin (25 mg/kg)-treated group showed decreased immunoreactivity of PCNA in comparison with HCC control group (). However, metformin (250 mg/kg)-treated group showed moderate PCNA immunoreactivity in comparison to HCC control group ().
Figure 9. Effect of metformin on PCNA immunoreactivity. (a) Normal, (b) HCC control, (c) HCC- MET (25 mg/kg), and (d) HCC- MET (250 mg/kg). (Blue arrows resemble G1 and black arrows resemble S-phase).
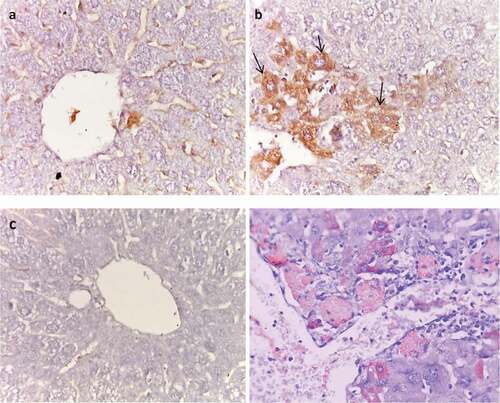
In normal liver sections, cytoplasm of the hepatocytes showed weak to moderate Bax immunostaining (). In contrast, HCC liver sections showed negative Bax expression (). In metformin (25 mg/kg)-treated liver tissues, BAX was moderately expressed (). However, in HCC-metformin (250 mg/kg) treated liver tissues, Bax was negative ().
Figure 10. Effect of metformin on Bax immunoreactivity. (a) Normal, (b) HCC control, (c) HCC- MET (25 mg/kg); (arrows), and (d) HCC- MET (250 mg/kg).
In normal liver sections, cytoplasm of hepatocytes showed no immunostaining of Bcl-2 (). On the contrary, HCC control liver sections showed strong expression of BCl-2 (). In metformin (25 mg/kg)-treated liver tissues, BCL-2 was negative (). However, in metformin (250 mg/kg)-treated liver tissues, BCL-2 showed moderate expression ().
Figure 11. Effect of metformin on BCl2 immunoreactivity. (a) Normal, (b) HCC control (arrows), (c) HCC- MET (25 mg/kg), and (d) HCC- MET (250 mg/kg).
Discussion
Hepatocellular carcinoma (HCC) is the most common type of liver cancer and the fourth cause of cancer mortality worldwide [Citation19]. In the present study, HCC was induced by a single injection of diethylnitrosamine followed by biweekly carbon-tetrachloride injections for 16 weeks. HCC establishment was manifested by significant increase in gross nodules, elevation of AFP level, serum liver biomarkers AST, ALT, ALP, along with total bilirubin, and significant decrease in serum albumin and survival rate. This was confirmed histologically, as liver sections showed signs of malignancy.
In this study, the survival rate of HCC group was decreased in comparison with normal group. This is in agreement with the results of Luo et al. [Citation32], and Fathy et al. [Citation33], who reported a continuously decreased survival rate along the experiments.
Survived mice of HCC group showed increase in their liver weight, which could be attributed to the formation of nodules, fibrosis and steatosis. These results are similar to those of Fathy et al. [Citation33] and Tripathy et al. [Citation34], who stated that there was significant increase in the liver weight of HCC animals. Tripathy et al. [Citation34] also reported that the increase in liver weight was a result of increased amount of fat deposited in the liver, with the incidence of several nodules.
In the current study, ALT, AST and ALP were significantly increased in the serum of HCC mice compared with those of normal group. Previous studies also reported high concentrations of liver enzymes in experimentally-induced HCC [Citation35–37]. These enzymes are normally found in the cytoplasm of liver cells in high levels. However, the elevation of the enzymes is due to the rupture of cell membrane and the leakage of enzymes into the serum as a result of liver cell damage and carcinogenesis [Citation37].
HCC control mice showed elevated bilirubin levels in the current study. This is in accordance to the results of Thomas et al. [Citation36] and Taïbi et al. [Citation38]. The increase in bilirubin levels is considered a marker for the liver cell damage [Citation36]. Taïbi et al. [Citation38] said that bilirubin increased significantly in HCC mice, since DEN would cause cholangitis and biliary cirrhosis causing disruption in the biliary excretion distribution that is linked to elevated bilirubin levels. The increase in bilirubin was high enough to make the fur of HCC mice pale yellow.
In the present study, HCC mice exhibited significant decrease in serum albumin levels. Previous studies also reported decreased levels of albumin in HCC mice [Citation35,Citation39,Citation40]. Low albumin is thought to be caused by liver disease or malignancy, since it is produced by the liver and consists about 50% of all plasma proteins [Citation39]. Zheng et al. [Citation41] stated that abdominal swelling (edema) is observed in HCC mice, which is common in patients with low albumin concentrations [Citation42]. Low albumin levels were manifested as abdominal edema in the present HCC mice, as a result of the presence of nonfunctional parts of the liver, which affect protein syntheses.
HCC tumor marker, AFP, was significantly increased in the mice of HCC group in this study. This is in agreement with Zakhary et al. [Citation43] and Sarkar et al. [Citation37], who stated that AFP was significantly increased in HCC mice. Several reports indicated that AFP plays a major role in the regulation of tumor growth and cell differentiation possibly through the AFP receptors [Citation37]. This increase in AFP was manifested by increased nodular incidence and malignancy in histological sections of the present work.
In the current study, HCC mice showed architectural features of oncogenicity. The tissue sections exhibited altered architecture with collapsed hepatic lobules due to the formation tumor nodules and fibrosis. The hepatic plates were not definable, lacking portal triads along with the presence of unpaired arteries (neoangiogenesis) and strong fibrosis. This is in agreement with Abouzed et al. [Citation40] and Taha et al. [Citation44]. These pathological changes of HCC mice livers occurred as a result of using the carcinogens DEN and CCL4, as they cause numerous injuries, regeneration, fibrosis and cirrhosis to the hepatic cell [Citation44].
Despite the advances in diagnosis, most HCC cases are diagnosed at advanced stages making chemotherapy the main treatment option [Citation45]. Many chemotherapeutic drugs had benefits to cancer patients, but they are very destructive with numerous side effects, toxicity to both cancerous and normal cells, intolerability and high cost remain major obstacles for successful treatment [Citation6,Citation46]. Therefore, many research focus on discovering drugs with fewer side effects, high efficacy and better patient compliance in compare with chemotherapeutic drugs for cancer treatment [Citation47].
Metformin, a biguanide, is considered to be the first line therapy for type 2-diabetes [Citation17]. Metformin also exhibits strong antiproliferative effects against several types of cancer cell lines. Many studies demonstrated the anticarcinogenic effect of metformin in diabetes associated models and patients at early stages [Citation48–50].
In this study, HCC animals were treated with two different doses of metformin, to evaluate the anticarcinogenic effect of metformin against advanced hepatocellular carcinoma in normal non-diabetic mice, and to evaluate the pharmacological and subpharmacological anti-diabetic doses of metformin for possible use in oncology. Therefore, after HCC induction, metformin was given intraperitoneally, from week 19 to week 22, when all animals were scarified including HCC controls.
In the present study, treatment of HCC mice with the subpharmacological dose of metformin (25 mg/kg) significantly decreased the mortality rate, improved clinical symptoms, the liver biomarkers ALT, AST, ALP, along with bilirubin, and significantly increased albumin levels. Metformin 25 mg/kg also decreased the HCC tumor marker AFP. This decrease in AFP levels was manifested by the significant decrease in the number of nodules and lowering the histological grade of HCC.
This dose was not previously used in experimental cancer studies except by Song et al. [Citation27], who tested it on fibrosarcoma in mice and found that 25 mg/kg of metformin markedly reduced tumor growth. However, song and colleges had not measured the survival rate or any of the biochemical or tumor marker AFP, or histological studies.
On the contrary, in the present study, treatment of HCC mice with the pharmacological metformin (250 mg/kg) showed almost no improvement in the liver biomarkers ALT, AST, ALP along with bilirubin. This dose of metformin did not also improve the HCC tumor marker AFP, and this was manifested by no significant difference in the number of nodules compared to the HCC control group. In the current study, the histological results of metformin 250 mg/kg- treated mice liver sections were significantly altered for the presence of nodules and fibrosis along with hepatocytic vacuolation.
The negative effect of this dose of metformin could be attributed to metformin-induced lactic acidosis which is aggravated by the presence of hepatic insufficiency due to HCC. Although, metformin works mainly in the liver to inhibit gluconeogenesis from lactate and enhance insulin sensitivity, it increases lactate levels by inhibiting lactate clearance in the liver, and enhance anaerobic metabolism resulting lactate accumulation [Citation51–53]. Levels of LDH increase in response to tissue injury, necrosis, hypoxia, hemolysis, and myocardial infarction. Its upregulation facilitates the efficiency of anaerobic glycolysis in tumor cells and reduces their dependency on oxygen [Citation54]. Therefore, metformin is prevented in patients with hepatic or renal insufficiency [Citation55].
The current results of metformin 250 mg/kg are in disagreement with those of DePeralta et al. [Citation56], Das et al. [Citation57], and Mobasher et al [Citation58]., who stated that metformin 250 mg/kg restored all the normal levels of the liver biomarkers in HCC animals. DePeralta et al. [Citation56] said that metformin 250 mg/kg when administered early, after 8 weeks of DEN administration, ameliorated the levels of bilirubin and albumin, and decreased the severity of inflammation and fibrosis in liver tissues. Das et al. [Citation57] reported that the treatment with metformin 250 mg/kg after 12 weeks of early HCC induction by a single dose of DEN, decreased the incidence and size of hepatic nodules and reduced all the features of HCC. Mobasher et al. [Citation58] mentioned that metformin (150 mg/kg) when administered after 7 weeks of DEN, decreased the liver biomarkers ALT, AST, ALP, Bil, and increased Alb levels and also maintained the overall architecture of liver without major histological injury. It should be noted that these studies investigated the effect of metformin in early stages of HCC.
In conclusion, metformin low dose (25 mg/kg) exhibited anticarcinogenic effects against advanced hepatocellular carcinoma demonstrated via the activation of proapoptotic Bax and suppressing antiapoptotic Bcl-2, neoangiogenic VEGF, and PCNA. On the contrary, metformin pharmacological dose (250 mg/kg) caused 100% mortality of HCC animals in advanced stages due to metformin-induced lactic acidosis associated with hepatic insufficiency as a result of advanced hepatocellular carcinoma.
Disclosure statement
No potential conflict of interest was reported by the author(s).
Additional information
Funding
References
- Llovet JM, Kelley RK, Villanueva A, et al. Hepatocellular carcinoma. Nat Rev Dis Primers. 2021;7(1):6.
- Ferlay J, Colombet M, Soerjomataram I, et al. Cancer statistics for the year 2020: an overview. Int J Cancer. 2021 Aug 15; 149(4):778–789.
- Zhang HH, Zhang Y, Cheng YN, et al. Metformin incombination with curcumin inhibits the growth, metastasis, and angiogenesis of hepatocellular carcinoma in vitro and in vivo. Mol Carcinog. 2018 Jan;57(1):44–56.
- Kumari R, Sahu MK, Tripathy A, et al. Hepatocellular carcinoma treatment: hurdles, advances and prospects. Hepatic Oncol. 2018 Sep 28;5(2): HEP08.
- Ikeda M, Morizane C, Ueno M, et al. Chemotherapy for hepatocellular carcinoma: current status and future perspectives. Jpn J Clin Oncol. 2018 Feb 1; 48(2):103–114.
- Ma Z, Xu L, Liu D, et al. Utilizing melatonin to alleviate side effects of chemotherapy: a potentially good partner for treating cancer with ageing. Oxid Med Cell Longev. 2020 May 21;2020:1–20.
- Majolo F, Delwing LK, Marmitt DJ, et al. Medicinal plants and bioactive natural compounds for cancer treatment: important advances for drug discovery. Phytochem Lett. 2019 Jun 1; 31:196–207.
- Kim A, Ha J, Kim J, et al. Natural products for pancreatic cancer treatment: from traditional medicine to modern drug discovery. Nutrients. 2021 Oct 26;13(11):3801. PMID: 34836055; PMCID: PMC8625071.
- Eroglu E, Uzun O. Is metformin a treatment opportunity for colorectal cancer?2020
- Saraei P, Asadi I, Kakar MA, et al. The beneficial effects of metformin on cancer prevention and therapy: a comprehensive review of recent advances. Cancer Manag Res. 2019;11:3295.
- Chen YC, Li H, Wang J. Mechanisms of metformin inhibiting cancer invasion and migration. Am J Transl Res. 2020;12(9):4885.
- Memmott RM, Mercado JR, Maier CR, et al. Metformin prevents tobacco carcinogen–induced lung tumorigenesis. Cancer Prev Res. 2010 Sep 1; 3(9):1066–1076.
- Pateliya B, Burade V, Goswami S. Combining naringenin and metformin with doxorubicin enhances anticancer activity against triple-negative breast cancer in vitro and in vivo. Eur J Pharmacol. 2021 Jan 15;891:173725. Epub 2020 Nov 3. PMID: 33157041.
- Yang J, Zhou Y, Xie S, et al. Metformin induces Ferroptosis by inhibiting UFMylation of SLC7A11 in breast cancer. J Exp Clin Cancer Res. 2021 Jun 23;40(1):206. PMID: 34162423; PMCID: PMC8223374.
- Henderson D, Frieson D, Zuber J, et al. Metformin has positive therapeutic effects in colon cancer and lung cancer. Am J Med Sci. 2017 Sep 1; 354(3):246–251.
- De A, Kuppusamy G. Metformin in breast cancer: preclinical and clinical evidence. Curr Probl Cancer. 2020 Feb 1; 44(1):100488.
- Ugwueze CV, Ogamba OJ, Young EE, et al. Metformin: a possible option in cancer chemotherapy. Anal Cell Pathol (Amst). 2020 Apr 27;2020:7180923. PMID: 32399389; PMCID: PMC7201450.
- Fatehi Hassanabad A, MacQueen KT. Molecular mechanisms underlining the role of metformin as a therapeutic agent in lung cancer. Cell Oncol. 2021 Feb;44(1):1–8.
- Jo W, Yu ES, Chang M, et al. Metformin inhibits early stage diethylnitrosamine-induced hepatocarcinogenesis in rats. Mol Med Rep. 2016 Jan 1;13(1):146–152.
- Ferretti AC, Hidalgo F, Tonucci FM, et al. Metformin and glucose starvation decrease the migratory ability of hepatocellular carcinoma cells: targeting AMPK activation to control migration. Sci Rep. 2019 Feb 26;9(1):1–4.
- Uehara T, Ainslie GR, Kutanzi K, et al. Molecular mechanisms of fibrosis-associated promotion of liver carcinogenesis. Toxicol Sci. 2013 Mar 1; 132(1):53–63.
- Tsai HH, Lai HY, Chen YC, et al. Metformin promotes apoptosis in hepatocellular carcinoma through the CEBPD-induced autophagy pathway. Oncotarget. 2017 Feb 21; 8(8):13832.
- Shin JW, Seol IC, Son CG. Interpretation of animal dose and human equivalent dose for drug development. J Korean Med. 2010;31(3):1–7.
- Garabadu D, Krishnamurthy S. Diazepam potentiates the antidiabetic, antistress and anxiolytic activities of metformin in type-2 diabetes mellitus with cooccurring stress in experimental animals. Biomed Res Int. 2014 Jun 4;2014:1–15.
- Chukwunonso Obi B, Chinwuba Okoye T, Okpashi VE, et al. Comparative study of the antioxidant effects of metformin, glibenclamide, and repaglinide in alloxan-induced diabetic rats. J Diabetes Res. 2016;2016:1–5.
- Shivavedi N, Kumar M, Tej GN, et al. Metformin and ascorbic acid combination therapy ameliorates type 2 diabetes mellitus and comorbid depression in rats. Brain Res. 2017 Nov 1;1674:1–9
- Song CW, Lee H, Dings RP, et al. Metformin kills and radiosensitizes cancer cells and preferentially kills cancer stem cells. Sci Rep. 2012 Apr 12;2(1):1–9.
- Gamble, M. The Hematoxylin and Eosin Theory and practice of histological techniques 6th. Bancroft JD, Gamble M, editors. Churchill Livingstone, Oxford: Elsevier health sciences. 2008;121–134.
- Mohr U, editor. International classification of rodent tumors: the mouse. Berlin: Springer; 2001.
- Crocker J, Nar P, Song CW, et al. Nucleolar organizer regions in lymphomas. J Pathol. 1987;151(2):111–118.
- Nonomura A, Mizukami Y, Matsubara F, et al. Identification of nucleolar organizer regions in non‐neoplastic and neoplastic hepatocytes by the silver‐staining technique. Liver. 1990;10(4):229–238.
- Luo M, Yang F, Huang SX, et al. Two-stage model of chemically induced hepatocellular carcinoma in mouse. Oncol Res. 2013;20(11):517–528.
- Fathy AH, Bashandy MA, Bashandy SA, et al. Sequential analysis and staging of a diethylnitrosamine-induced hepatocellular carcinoma in male Wistar albino rat model. Can J Physiol Pharmacol. 2017;95(12):1462–1472.
- Tripathy A, Thakurela S, Sahu MK, et al. Fatty changes associated with N-Nitrosodiethylamine (DEN) induced hepatocellular carcinoma: a role of sonic hedgehog signaling pathway. Genes Cancer. 2020;11(1–2):66–82.
- Hussein SA, Abdel-Aal SA, Mady HA. Spirullina inhibit the development of diethylnitrosamine induced premalignant phenotype in rat chemical hepatocarcinogenesis model. BENHA VET MED J. 2018 Dec 1; 35(2):650–661.
- Thomas SV, Paul J, Shrungeswara AH, et al. Annona muricata fruit extract protects against diethylnitrosamine-induced hepatocellular cancer in rats. Asian Pac J Trop Med. 2019 Jun 1;12(6):272.
- Sarkar S, Bhattacharjee P, Ghosh T, et al. Pharmaceutical efficacy of harmalol in inhibiting hepatocellular carcinoma. Future J Pharm Sci. 2020 Dec;6(1):1–8.
- Taïbi N, Al-Balas QA, Bekari N, et al. Molecular docking and dynamic studies of a potential therapeutic target inhibiting glyoxalase system: metabolic action of the 3, 3’-[3-(5-chloro-2-hydroxyphenyl)-3-oxopropane-1, 1-diyl]-Bis-4-hydroxycoumarin leads overexpression of the intracellular level of methylglyoxal and induction of a pro-apoptotic phenomenon in a hepatocellular carcinoma model. Chem Biol Interact. 2021 Aug 25; 345:109511
- Zhang W, Zhangyuan G, Wang F, et al. High preoperative serum globulin in hepatocellular carcinoma is a risk factor for poor survival. J Cancer. 2019;10(15):3494.
- Abouzed TK, Althobaiti F, Abdelkhlek NA, et al. Antitumor and antioxidant activity of S-methyl methionine sulfonium chloride against liver cancer induced in Wistar Albino rats by diethyl nitrosamine and carbon tertrachloride. Int J Environ Res Public Health. 2021 Jan;18(18):9726.
- Zheng X, Zhou Y, Yi X, et al. IL-21 receptor signaling is essential for control of hepatocellular carcinoma growth and immunological memory for tumor challenge. Oncoimmunology. 2018 Dec 2;7(12):e1500673.
- Wen J, Chen X, Wei S, et al. Research progress and treatment status of liver cirrhosis with hypoproteinemia. Evid Based Complement Alternat Med. 2022 Feb 24;2022:1–8.
- Zakhary NI, El Gemeie EE, Youssef AK, et al. Flavonoids content of 70% methanolic extract of Erucaria pinnata (Viv.) and its effect as anticancer and antiangiognic: in vitro, in vivo and docking study.
- Taha H, Elfar N, Haffez H, et al. Raptinal silver nanoparticles: new therapeutic advances in hepatocellular carcinoma mouse model. Naunyn-Schmiedeberg’s Arch Pharmacol. 2021 Feb;394(2):279–289.
- Zhang HH, Zhang Y, Cheng YN, et al. Metformin incombination with curcumin inhibits the growth, metastasis, and angiogenesis of hepatocellular carcinoma in vitro and in vivo. Mol Carcinog. 2018 Jan;57(1):44–56.
- Al-Salih HA, Al-Sharafi NM, Al-Qabi SS, et al. The Pathological Features of cyclophosphamide induced multi-organs toxicity in male wister rats. Sys Rev Pharm. 2020 Jun 1;11(6):45–49.
- Babaei G, Aliarab A, Abroon S, et al. Application of sesquiterpene lactone: a new promising way for cancer therapy based on anticancer activity. Biomed Pharmacother. 2018 Oct;106:239–246 Epub 2018 Jun 28. PMID: 29966966
- Lee MS, Hsu CC, Wahlqvist ML, et al. Type 2 diabetes increases and metformin reduces total, colorectal, liver and pancreatic cancer incidences in Taiwanese: a representative population prospective cohort study of 800,000 individuals. BMC Cancer. 2011 Dec;11(1):1.
- Bhalla K, Hwang BJ, Dewi RE, et al. Metformin prevents liver tumorigenesis by inhibiting pathways driving hepatic lipogenesis. Cancer Prev Res. 2012;5(4):544–552.
- Park JW, Lee JH, Park YH, et al. Sex-dependent difference in the effect of metformin on colorectal cancer-specific mortality of diabetic colorectal cancer patients. World J Gastroenterol. 2017 Jul 28;23(28):5196.
- Brackett CC. Clarifying metformin’s role and risks in liver dysfunction. J Am Pharm Assoc. 2010 May 1;50(3):407–410.
- Nguyen HL, Concepcion L. Metformin intoxication requiring dialysis. Hemodialysis Int. 2011 Oct;15:S68–71.
- Salvatore T, Pafundi PC, Marfella R, et al. Metformin lactic acidosis: should we still be afraid? Diabetes Res Clin Pract. 2019 Nov 1;157:107879
- Miao P, Sheng S, Sun X, et al. Lactate dehydrogenase A in cancer: a promising target for diagnosis and therapy. IUBMB Life. 2013 Nov;65(11):904–910.
- DeFronzo R, Fleming GA, Chen K, et al. Metformin-associated lactic acidosis: current perspectives on causes and risk. Metabolism. 2016 Feb 1;65(2):20–29.
- DePeralta DK, Wei L, Ghoshal S, et al. Metformin prevents hepatocellular carcinoma development by suppressing hepatic progenitor cell activation in a rat model of cirrhosis. Cancer. 2016 Apr 15;122(8):1216–1227.
- Das BK, Choukimath SM, Gadad PC. Asarone and metformin delays experimentally induced hepatocellular carcinoma in diabetic milieu. Life Sci. 2019 Aug 1;230:10–18.
- Mobasher MA, El-Tantawi HG, El-Said KS. Metformin ameliorates oxidative stress induced by diabetes mellitus and hepatocellular carcinoma in rats. Rep Biochem Mol Biol. 2020 Apr;9(1):115.