
ABSTRACT
Dyslipidemia, diabetes, and the upregulation of receptors for oxidized low-density lipoprotein all contribute to hepatic and aortic endothelial dysfunction. The current research examined how camel milk could possibly decrease induced Streptozotocin-high fat diet-aggravated dyslipidemia-mediated damage in male pig hepatic and aortic tissues. Twenty-five pigs were separated into five groups of five pigs each, with five non-atherosclerotic pigs in the control group and twenty atherosclerotic pigs in the experimental groups. Groups 1 and 2 received distilled water as the standard control and atherosclerotic control groups, respectively, while Groups 3 and 4 received camel milk at 250 mL/day and 500 mL/day, respectively, and Group 5 received Metformin at 500 mg/day. The experiment lasted ten weeks. After 10 weeks, all of the pigs were euthanized. The lipid profile and liver enzyme levels were determined from the analysis of blood serum and the histology of the liver and aortic. When pigs administered, camel milk were compared to atherosclerotic control pigs, there was a significant decrease (p 0.05) in cholesterol, triglyceride, low density lipoprotein (LDL), and very low-density lipoprotein (VLDL) levels, while a significant increase in high density lipoprotein levels was observed in pigs that received camel milk. Also, pigs in groups that received camel milk had their liver enzyme parameters (ALP, AST, ALT, GGT, LDH, and CK-MB) significantly lowered when compared with atherosclerotic control pigs. Similarly, treatment with camel milk ameliorates aortic tissues from degradation and reduces histological liver steatosis, and it also decreases the expression of LOX-1 mRNA in the aorta of atherosclerotic pigs.
Introduction
Atherosclerosis is a lipid-infiltrating artery disease characterized by plaque formation. Atherosclerosis is linked to several risk factors, including age-related changes in the arterial wall gene expression [Citation1,Citation2]. Many risk factors have also been proposed, including dyslipidemia, hypertension, and diabetes, with dyslipidemia thought to play a vital role in the pathogenesis of atherosclerosis [Citation3,Citation4]. Diabetic patients are more likely to develop the three major macrovascular diseases: cardiovascular, cerebrovascular, and peripheral vascular disease [Citation5]. Diabetic patients are two to six times more likely than nondiabetic individuals to develop atherosclerosis, and in diabetic adults, coronary heart disease is the most common cause of death [Citation6]. Nonalcoholic fatty liver disease (NAFLD) is common in type 2 diabetes, and it is expected because insulin resistance and obesity/overweight occur together [Citation7]. In glucose and lipid homeostasis, the liver plays a critical role. It also regulates genes involved in glycogenesis, gluconeogenesis, glycolysis, and lipogenesis [Citation8]. Low-density lipoprotein (LDL) cholesterol is a well-known coronary artery disease risk factor: when exposed to oxidative stress, LDL particles oxidize to form a lipoprotein species that is particularly atherogenic [Citation9]. The induction of endothelial cell activation/-dysfunction, macrophage-induced formation of foam cells, and smooth muscle cell migration and proliferation are all mechanisms by which oxidized-LDL contributes to atherosclerotic plaque initiation and progression [Citation10]. Receptors for scavengers LOX-1 are molecules that mediate Ox-LDL’s effects [Citation3]. Animal models have indicated that LOX-1 plays an important role in atherogenic processes, with LOX-1-overexpressing mice developing atherosclerosis quicker and with significant inflammation [Citation9,Citation11]. Camel milk (CM) is a special type of milk because it contains a lot of antioxidants, including the powerful antioxidant lactoferrin, as well as a number of antioxidant trace elements and vitamins [Citation12,Citation13]. Vitamin C, as well as calcium, potassium, magnesium, zinc, copper, and iron, are abundant in CM [Citation14] as shown in . CM is preferable to cow’s milk in terms of quality because of its decreased lactose and cholesterol content, as well as the absence of lactose intolerance-inducing compounds, β-lactoglobulin and casein [Citation13]. Furthermore, CM contains a variety of bioactive proteins, including lactoperoxidase enzyme and nanoantibodies, which help to explain its remarkable antiviral/antibacterial and immune-modulatory properties [Citation15,Citation16]. Camel milk is now widely acknowledged to have health benefits, with potential applications in conditions like diabetes, inflammation, hypertension, cancer, and infection [Citation17,Citation18]. There is a lack of data in a study on the anti-atherosclerotic potentials of camel milk in pigs. The research examined how camel milk affected lipid profiles, liver enzyme parameters, and aorta and liver histology in streptozotocin and high-fat induced atherosclerotic pigs.
Table 1. Compositional differences between camel, cow, and human milk.
Methods
Collection of camel’s milk samples
Milk samples were collected from healthy milking camels with no visible clinical signs at a camel farm in Jibiyya Local Government area of Katsina State, Nigeria. Hand milking was used to collect the milk from the camel, as is customary among the farmers. Throughout the study, milk samples were collected three times in sterile screw bottles and stored in cool boxes before being transported to the lab for bacteriological milk quality testing. Camel milk samples were then stored at 4°C in the refrigerator.
Experimental animals
After the veterinary screening, twenty male pigs (boars) were sedated with Telazol (10 mg/kg) and injected with buffer Streptozotocin (50 mg/kg in 0.1 mol/l Na-citrate, pH 4.5) via ear vein every day for three days. The pig’s blood was taken for testing. The glucose concentrations in the blood collected from the pigs’ veins were then measured using an AccuChek Active ®Glucometer (Roche). Diabetes was confirmed in pigs who had a sustained rise in blood glucose levels up to 200 mg/dl [Citation21]. To offset insulin release from B-cells, streptozotocin-injected pigs were given 25 g glucose orally twice daily at feeding time for two days. Prior to starting the camel milk treatment, the pigs were put on a high-fat diet containing 1.5% cholesterol and 15% Lard for 20 weeks, as described by Gerrity, et al. [Citation22].
Experimental design
Five groups of pigs (n = 5) were formed, the NC group (nondiabetic) and D-HFD group (diabetic control) were given distilled water (500 mL/day). The treatment groups, D-HFD + 250 CM and D-HFD + 250 CM, received camel milk at 250 and 500 mL/day, respectively, for ten weeks. The CM doses used in this study were adopted as indicated in previous work [Citation23,Citation24]. The D-HFD + MET group served as the standard drug group, receiving 500 mg/day of metformin for ten weeks.
Biochemical analysis
After the sacrifice, blood was collected via cardiac puncture into plain sterilized centrifuged bottles and left to clot. Blood samples were centrifuged at 3000 rpm in the Department of Human Anatomy, Ahmadu Bello University Zaria (Made in England/ Serial No: 846,307). The clear serum was aspirated by automatic pipette and received in dry sterile samples tubes, processed directly to determine cardiac and hepatic marker enzymes. The serum from each pig (five per group) was collected and used to estimate the liver enzymes alanine like, aspartate aminotransferase (AST), and aminotransferase (ALT) activities were estimated using modified Reitman and Frankel [Citation25] methods, alkaline phosphatase (ALP) activities were estimated using modified methods of Wright et al. [Citation26]. Lactate dehydrogenase (LDH), creatine phosphokinase- MB (CPK- MB) were analyzed according to the method of Tabatabai et al. [Citation27], while gamma glutamyl transferase (GGT) evaluated with the methods of Scouller et al [Citation28]; Lipid profile biomarkers (Cholesterol, Triglyceride, VLDL, LDL, and HDL), and they were assayed using commercial kit Agappe Laboratories Limited test kits (United Kingdom) according to the manufacturer’s instructions.
Histopathological analysis
Hematoxylin and eosin staining
The tissues were de-waxed in two changes of xylene for three (3) minutes each, hydrated by passing them through descending grades of alcohol (100%, 95%, 90%, and 70%) for three minutes each, and stained in Harris hematoxylin for ten minutes before being washed in tap water to remove excess stain. The slides were then flooded with acid alcohol for a few seconds for differentiation and then washed in tap water again. The slides were then blued in Scott’s tap water for five minutes and the counter stained with Eosin for three minutes. The sections were rinsed in tap water before being dehydrated in progressively higher grades of alcohol and cleared in xylene. The sections were then cover-slipped using a mountant [Citation29].
Gordon and sweet staining
The process of silver impregnation displays reticular fibers. The reticular fibers are clearly defined strands in a normal liver, but they reveal a discontinuous pattern in a necrotic and cirrhotic liver. The tissues were oxidized for 3 minutes in potassium permanganate, rinsed in distilled water, and then de-colored for 2 minutes in 2% oxalic acid. After washing and sensitizing the tissues with 4% iron alum for 10 minutes, they were rinsed with distilled water and impregnated with an ammoniacal silver solution for 11 seconds. The tissues were then rinsed in distilled water, fixed with 2% aqueous sodium thiosulfate (hypo) for 2 minutes, washed in distilled water, and counterstained with neutral red for 2 minutes. The tissue was then dehydrated, cleared, and mounted [Citation30].
Masson’s trichrome staining
Masson’s trichrome staining was done with a ready-to-use kit (Trichrome Stain Kit). In a nutshell, the tissue slices were sliced into 5 m thick pieces and put on typical microscopy slides. After deparaffinisation and rehydration, the slides were submerged in Bouin’s solution for 15 minutes at 56°C. The slides were then rinsed with tap water for 5 minutes. The slices were then stained with Weigert’s hematoxylin for 5 minutes before being washed in tap water for 5 minutes and rinsed in distilled water. The slides were then stained for 5 minutes with Biebrich scarlet-acid fuchsin, washed in distilled water, incubated in phosphotungstic-phosphomolybdic acid for 5 minutes, colored with aniline blue for 5 minutes, and fixed in 1% acetic acid for 2 minutes. Finally, the slides were rinsed in distilled water, dehydrated, and mounted. Finally, the slides were dehydrated and mounted after being rinsed in distilled water [Citation31]. The tissues were then viewed under a light microscope, and photomicrographs were taken with a digital microscope camera (AmScope MD 900) at a magnification of ×250.
Histological quantification
The attached camera to the microscope was used to record five sections per pig and five random fields for each section (totaling 25 fields). Using Kleiner et al.’s [Citation32] scoring system, the two important features examined in the H&E liver were steatosis and inflammation, whereas in the aorta they were tunica intima ulceration and medial cystic necrosis. The severity of the liver steatosis, aortic ulceration, and medial cystic necrosis was graded based on the percentage of the overall area affected, while inflammation was measured by counting the number of inflammatory foci per field at 100 X magnification. The hepatic reticular fiber loss and aortic collagen disrupted-positive areas in the liver and aorta sections were measured for histochemistry. As previously reported by Ruifrok and Johnston [Citation33], color deconvolution was used to quantitatively analyze the photomicrographs using Image J software.
Real-time PCR relative quantification assay
The expression levels of the LOX-1 gene in the aorta of the different experimental groups were compared using a relative quantification assay of LOX-1 mRNA performed by real-time PCR (Gene Bank ID: NM_213805.1). According to the manufacturer’s instructions, the RiboPure Extraction kit was used to extract total RNA from pig aorta tissues. A high-capacity cDNA reverse transcription kit with an RNAase inhibitor was used to make complementary DNA (cDNA) (Applied Biosystems, USA). TaqMan labeled primers and probes were used for the target genes in gene expression assays. Forward primer sequence (5’ to 3’) used for LOX-1 was TCGGAGTGAACGGATTTGGC and reverse primer sequence TGACAAGCTTCCCGTTCTCC. As an endogenous control, GAPDH as the housekeeping gene (Gene Bank ID: NM_213805.1) was used, the forward primer sequence (5’ to 3’) used for GAPDH was AGTCTTTCCACTCTGCGGTG and reverse primer sequence GGTCACCAGTAATCCCAGGC. All primers and probes were obtained from Applied Biosystems in the United States. The target mRNA was quantified by comparing the total RNA added to each reaction and normalizing it with endogenous control as an active reference. The following cycling conditions were used for PCR reactions: 1 cycle at 50°C for 2 minutes, 1 cycle at 95°C for 10 minutes, 40 cycles at 95°C for 15 seconds and 60°C for 1 minute. Relative real-time PCR was used for relative quantification. The real-time PCR technique estimates gene expression levels simultaneously during real-time PCR amplification and at the end of the experiment.
Analyzing the threshold cycles (CTs) results
2ˆ – delta delta CT) method for a quantitative real-time polymerase chain reaction, was used for the quantitative real-time polymerase chain reaction (qPCR) data analysis. This method was convenient to calculate relative gene expression levels between different samples in that it directly uses the threshold cycles (CTs) generated by the Real-time PCR system for calculation. Data were analyzed by creating an excel sheet for the relative quantification (RQ) gene expression from the gene of interest and housekeeping threshold cycles values.
∆CT = CT (Target Gene) – CT (Reference Gene)
∆∆CT = ∆CT (Sample) – ∆CT (Control)
2-∆∆CT = Fold difference of gene expression.
Statistical analyses
Data were expressed as mean ± standard error of the mean (SEM). One way analysis of variance (ANOVA) test was used to analyzed the significance of differences between mean values, and different groups were assessed using GraphPad prism (Version 9.2). Values with (P < 0.05) were accepted as significant comparing control and treated samples. Tukey multiple comparison post hoc test was used, and at each chart *P < 0.033; ** P < 0.002; *** P < 0.0001 indicates a significant difference when compared to Normal control; #P < 0.03; ##P < 0.002; ###p < 0.0001, indicates a significant difference when compared to D-HFD Control group.
Results
Liver enzymes activities
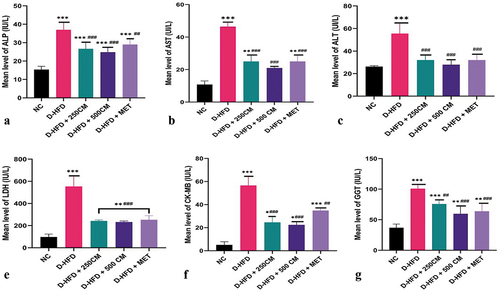
The serum liver enzymes (AST, ALT and ALP) were significantly increased in D-HFD (p < 0.05) compared to the treatment groups. For AST and ALP, a significant reduction (p < 0.05) was observed in all the treatment groups compared to the D-HFD group. The D-HFD + 500 CM group has the maximum potency of reducing the serum liver enzymes as it shows no significant difference (p > 0.05) compared with the NC groups. For the ALT, it was observed that there is no significant difference between D-HFD + 250 CM, D-HFD + 500 CM and D-HFD + MET groups when compared with the NC group. The serum cardiac enzymes (LDH, CK-MB and GGT) were significantly increased in D-HFD (p < 0.05) compared to the treatment groups. For LDH and GGT, a significant reduction (p < 0.05) was observed in all the treatment groups compared with the D-HFD groups. For the CK-MB, it was observed that there was a significant difference in CK-MB level of pigs in D-HFD groups compared with pigs in D-HFD + 250 CM, D-HFD + 500 CM and D-HFD + MET groups ().
Figure 1. Bar charts of liver enzymes parameters (a) ALP, (b) AST, (c) ALT, (d) LDH, (e) CK-MB and (f) GGT. *P < 0.033; ** P < 0.002; *** P < 0.0001 indicates a significant difference when compared to Normal control; #P < 0.03; ## P < 0.002; ### P < 0.0001, indicates a significant difference when compared to D-HFD Control group. n = 5, NC = non-diabetic, D-HFD = diabetic control, CM = camel milk, MET = metformin.
Serum lipid profile
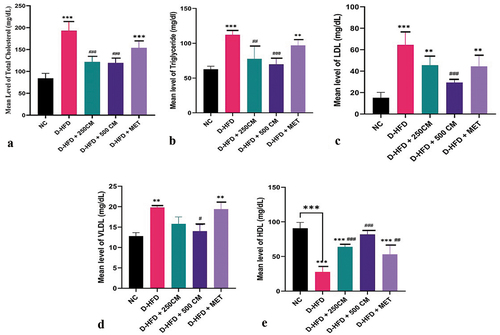
There is a significant reduction (p < 0.05) in the lipid profile parameters (Cholesterol, Triglyceride, LDL and VLDL) in the D-HFD + 500 CM group when compared with pigs in the D-HFD group. While (Cholesterol, LDL and VLDL) showed there was no significant difference between D-HFD + 250 CM and D-HFD. For Cholesterol, triglycerides, LDL, and VLDL, there is no significant difference (p > 0.05) in the mean value between the D-HFD + MET group and the D-HFD group (D-HFD versus D-HFD + MET, p > 0 05). In (HDL), there was a significant difference between D-HFD + MET and D-HFD.
Figure 2. Bar charts of lipid profile (a) TC, (b)TGs, (c)LDL, (d) VLDL and (e) HDL *P < 0.033; ** P < 0.002; *** P < 0.0001 indicates a significant difference when compared to normal control; #P < 0.03; ## P < 0.002; ### P < 0.0001, indicates a significant difference when compared to D-HFD Control group. n = 5, NC = non-diabetic, D-HFD = diabetic control, CM = camel milk, MET = metformin.
LOX-1 gene expression
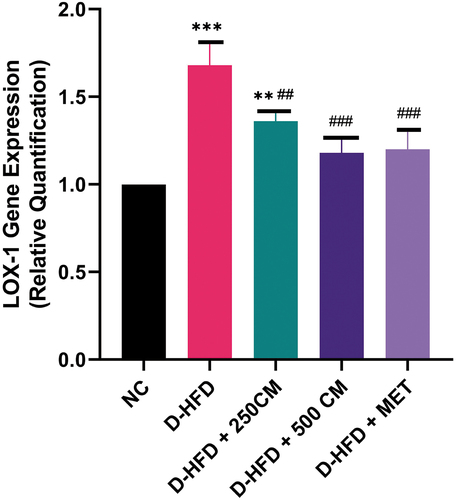
Pigs in the D-HFD groups had significantly higher levels of LOX-1 expression than pigs in the NC groups and pigs in the D-HFD + 250 CM, D-HFD + 500 CM, and D-HFD + MET groups. There is no significant difference (p > 0.05) in the mean value of Lox-1 gene expression between the D-HFD + 500 CM, D-HFD + MET group and the NC group (NC versus D-HFD + 500 CM and D-HFD + MET, p > 0 05) ().
Figure 3. Bar charts of oxidized low-density receptor 1 (LOX-1) mRNA gene expression *P < 0.033; ** P < 0.002; *** P < 0.0001 indicates a significant difference when compared to Normal control; #P < 0.03; ## P < 0.002; ### P < 0.0001, indicates a significant difference when compared to D-HFD Control group. n = 5, NC = non-diabetic, D-HFD = diabetic control, CM = camel milk, MET = metformin.
Histological studies of liver
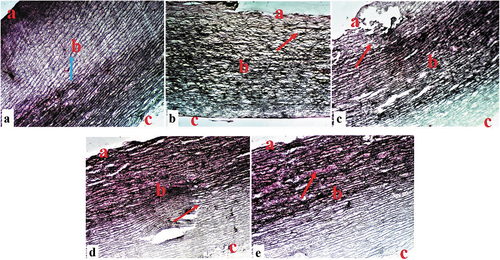
Photomicrograph section of liver tissue from the control group NC showed normal hepatocytes, hepatic portal vein present, hepatic artery, bile duct, and lymphatic space visible conspicuously between the hepatocyte and the hepatic portal artery (), a histological segment of D-HFD pigs with fat hepatocellular vacuoles of varying sizes, ballooning degeneration, and necrosis (). A photomicrograph of pigs in the D-HFD + 250 CM group demonstrated regular progressive repair of hepatocytes, minor inflammation, ballooning degeneration, and hepatocyte necrosis (). Sections from the D-HFD + 500 CM group showed standard portal triad, remarkable hepatocyte restoration, and mild ballooning degeneration of some hepatocytes (). In contrast, D-HFD + MET showed gradual hepatocyte restoration and mild inflammation, ballooning degeneration, and hepatocyte necrosis (). For Gordon and Sweet Silver Stain, the liver of the NC sections showed normal distribution of reticular fibers in the parenchyma reticular fiber (). The hepatic distribution of diabetic/atherosclerotic pigs revealed substantial (chronic) reticular fiber loss (). Treatment D-HFD + 250 CM group demonstrated minimal reticular fiber repair (), D-HFD + 500 cm group demonstrated marked reticular fiber repair (), while D-HFD + MET group showed marked reticular fiber repair ().
Figure 4. Composite photomicrographs of non-atherosclerotic and atherosclerotic pig liver showing normal cytoarchitecture of the hepatocyte (blue arrow), hepatic artery (HA), hepatic portal vein (HPV) and bile duct (BD) (a); hepatocellular vacuoles (steatosis) of varying sizes (dotted arrow), ballooning degeneration, and necrosis (green arrow) (b); and a dose-dependent hepatocyte restoration (c, d, & e). H&E X 250. A = liver of normal control pigs, B = liver of atherosclerotic control pigs, C = liver of pigs treated with 250 mL/day Camel milk, D = liver of pigs treated with 500 mL/day Camel milk, E = liver of pigs treated with Metformin.
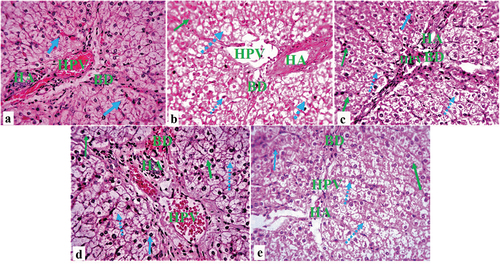
Figure 5. Composite photomicrographs of non-diabetic and diabetic pig liver showing normal distribution of the reticular fibers of the hepatocyte (blue arrow) (a); reticular fiber loss (green arrow) b; and a dose-dependent reticular fiber repair (c, d, & e). Gordon and sweet silver stain X 250. A = liver of normal control pigs, (b) Liver of atherosclerotic control pigs, (c) liver of pigs treated with 250 mL/day camel milk, (d) Liver of pigs treated with 500 mL/day camel milk, (e) Liver of pigs treated with Metformin.
Histological studies of aorta
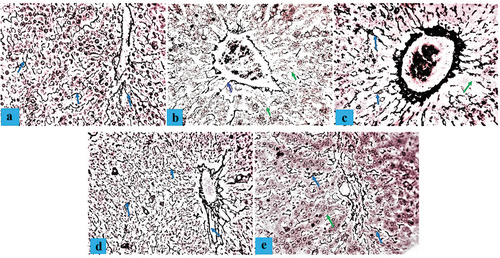
A Photomicrograph section of an aorta tissue from the control group (NC) showed normal tunica intima, tunica media, tunica adventitia, and Vasa vasorum characteristics (). A histological section of the aorta in the D-HFD group showed marked tunica intima ulceration, medial cystic necrosis, and some fibrinoid necrosis in the aortic medium (). Photomicrographs of the aorta in the D-HFD + 250 CM group displayed typical tunica intima characteristics, some calcification of the tunica media, and medial cystic necrosis (). Sections from the D-HFD + 500 CM group revealed normal tunica intima, tunica media, and minor disruption of the tunica adventitia (), while D-HFD + MET showed minor tunica intima ulceration, medial cystic necrosis, and tunica adventitia disruption (). For Masson’s trichrome stain, aorta from NC sections showed a normal distribution of reticular fibers in the parenchyma collagen fiber (). The D-HFD section revealed marked disruption/depletion of collagen fiber and extensive ulcers at the tunica intima (). D-HFD + 250 section exhibited remarkable collagen fiber restoration with tunica media ulceration (). D-HFD + 500 section demonstrated marked collagen fiber repair (), while D-HFD + MET aorta showed a slight improvement in collagen fiber distribution with medium ulceration ().
Figure 6. Composite photomicrographs of the aorta of non-diabetic and diabetic pigs showing normal tunica intima (a), tunica media (b), tunica adventitia (c), and Vasa vasorum characteristics (a); marked tunica intima ulceration, medial cystic necrosis, and some fibrinoid necrosis (arrow) in the aortic medium (b&e); and revealed normal tunica intima (a), tunica media (b), and minor disruption of the tunica adventitia (c) (c&d). H&E X 250. A = aorta of normal control pigs, B = aorta of atherosclerotic control pigs, C = aorta of pigs treated with 250 mL/day Camel milk, D = aorta of pigs treated with 500 mL/day Camel milk, E = aorta of pigs treated with Metformin.
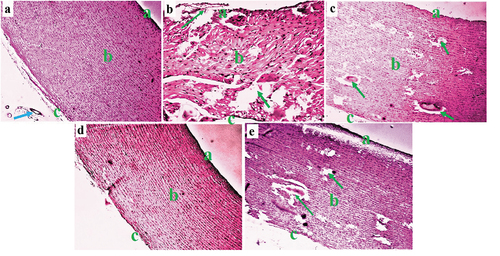
Figure 7. Composite photomicrographs of non-diabetic and diabetic pig aorta showing normal distribution of the collagen fibers of the aorta at the tunica intima (a), tunica media (b), and tunica adventitia (c) (blue arrow) (a); collagen fiber disruption (red arrow) (b); and a dose-dependent collagen fiber repair (arrow) (c, d, & e). Masson’s trichrome stain X 250. A = aorta of normal control pigs, B = aorta of diabetic control pigs, C = aorta of pigs treated with 250 mL/day Camel milk, D = liver of pigs treated with 500 mL/day Camel milk, E = aorta of pigs treated with Metformin.
Quantitative histopathology changes in experimental pigs
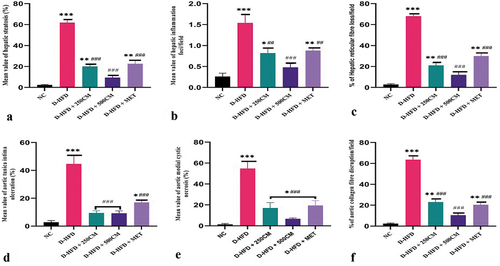
The quantitative evaluation of the hepatic steatosis, inflammation and percentage of hepatic reticular loss/filed between the groups showed a significant increase in D-HFD (p < 0.05) pigs compared to the treatment groups. Pigs in the D-HFD + 500 CM group showed no significant difference (p > 0.05) in their hepatic steatosis, inflammation, and percentage of hepatic reticular loss/filed compared with the NC group. For the percentage of aortic tunica ulceration, medial cystic necrosis, and percentage of aortic collagen fiber disruption/field showed a significant increase in D-HFD (p < 0.05) pigs compared with pigs in the treatment groups. While Pigs in the D-HFD + 500 CM group showed no significant difference (p > 0.05) when compared with the NC group ().
Figure 8. Bar charts of quantitative histopathology changes (a) hepatic steatosis, (b) hepatic inflammation, (c) % of reticular fiber loss (d) % of aortic tunica intima ulceration, (e) % of aortic medial cystic necrosis, and (f) % of aortic collagen fiber disruption *P < 0.033; ** P < 0.002; *** P < 0.0001 indicates a significant difference when compared to Normal control; #P < 0.03; ## P < 0.002; ### P < 0.0001, indicates a significant difference when compared to D-HFD Control group. n = 5, NC = non-diabetic, D-HFD = diabetic control, CM = camel milk, MET = metformin.
Discussion
Atherosclerosis is a chronic disorder and is a well-known risk factor for various clinical conditions like diabetes, morbidity, and mortality. Even though there is no effective treatment for diabetes, atherosclerosis, and related vascular diseases, previous studies have established and published that atherosclerosis is linked to diabetes and cardiovascular ailments [Citation34,Citation35]. The induction of diabetes and atherosclerosis in animals by feeding the animals with HFD has been documented in multiple studies. It is widely regarded as the most popular and reliable model for investigating atherosclerosis because the typical path of atherosclerosis in humans is comparable [Citation4,Citation36]. As a result, the goal of this study was to look into the medical use of camel’s milk in the treatment of diabetes-related dyslipidemia and vascular endothelial dysfunction caused by a high-fat diet.
The elevated activities of serum AST, ALT, ALP, LDH, CK-MB, and GGT, the primary markers of hepatic injury in this study, revealed extensive tissue damage in the concerned organ due to STZ and high-fat diet treatment of pigs. Increased serum activities of all of these enzymes resulted from increased cellular leakage into the circulation, most likely due to a loss of functional integrity of membrane architecture [Citation37]. This will promote an increase in necrotic cells in the affected tissues, as demonstrated in a previous study that found cardiac, renal, and liver disorders have a solid link to diabetes and atherosclerosis [Citation38]. The dose-dependent camel milk and metformin administration reduced the hepatic specific damage indices in the treated groups, most likely due to the antioxidant activity of the camel milk [Citation39,Citation40]. However, the ameliorative potential of camel milk can be attributed to several of its ingredients, including the high content of insulin-like amino acids, insulin, immunoglobulins and peptides, antioxidant vitamins C and E, and immunomodulators, which can improve insulin sensitivity and reduce fasting glucose levels by suppressing oxidative stress, preventing vascular and liver degeneration, and increasing glucose uptake and utilization [Citation12,Citation41]. This research suggests that camel milk can repair and protect diabetes/atherosclerosis-affected liver and vascular tissues by stabilizing membranes and preventing intracellular enzyme leakage. The reversal of AST, ALT, ALP, LDH, CK-MB, and GGT levels could result from hepatic parenchymal cells’ repair and healing process. Camels’ protective benefits have already been documented in similar studies [Citation42].
The changes in lipid metabolism caused by diabetes and a high-fat diet may contribute to the pathogenesis of fatty liver and can lead to nonalcoholic fatty liver disease, dyslipidemia [Citation43], atherosclerosis, and cardiovascular (CV) diseases [Citation44,Citation45]. These were marked by increased total cholesterol, triglyceride, and LDL-c levels in the blood and a decrease in HDL-c values. Hyperglycemia and high-fat diet-induced dyslipidemia may be prone to raised TG levels, which affect the oxidant-antioxidant balance, resulting in enhanced free fatty acid bioavailability with increasing LPO [Citation46,Citation47]. Additionally, higher LDL-c in the blood of diabetic and high-fat diet-fed pigs could be oxidized, resulting in cholesterol accumulation in phagocytes and the production of foam cells, potentially leading to the development of atherosclerosis [Citation48]. Low levels of circulating HDL-c due to diabetes and a high-fat diet also cause ROS production in the endothelium [Citation49]. Camel milk therapy significantly reduced changes in lipid metabolism parameters caused by diabetes and a high-fat diet. Camel milk reduced the effects of a changed lipid profile by mitigating the formation of lipid peroxidation and regulating the activity of lipid metabolic enzymes [Citation23]. Furthermore, these findings are consistent with previous research indicating that camel milk can lower TG, CHOL, and LDL-c levels in human and animal models of diabetes [Citation41,Citation50]. Camel milk may also prevent CHOL production and transport by inducing the enzyme lecithin cholesterol acyltransferase (LCAT), blocking 3-hydroxy-3-methylglutaryl-CoA (HMG-CoA) reductase, and other mechanisms [Citation51]. Additionally, camel milk’s ability to act as an antioxidant [Citation52] and its high concentration of vitamins C and E were credited with having a hypolipidemic impact [Citation17,Citation53]. In untreated pigs, the biochemical picture of dyslipidemia was correlated with hepatic degeneration, steatosis, and reticular fiber degeneration, which corresponds to the known histological characteristics of NASH [Citation54]. HFD-induced obesity is also linked to vascular endothelial dysfunction, which is likely due to many metabolic problems such as atherosclerosis, hypertension, hyperglycemia, and dyslipidemia, all of which are related to vascular oxidative stress [Citation55]. In the current investigation, all of the histological characteristics of NASH identified in the untreated pigs improved significantly in the CM-treated pigs. The antioxidant action of CM helps to reduce hepatic fat buildup as well as systemic and hepatic oxidative stress [Citation56,Citation57]. In addition, vascular endothelial dysfunction caused by the HFD has been linked to several factors, including elevated blood pressure, elevated serum triglyceride levels, oxidant overproduction, and antioxidant system insufficiency [Citation35]. In this study, the aorta of STZ/HFD fed pigs had severe tunica intima ulceration, medial cystic necrosis, elastic fiber layer weakening, and some fibrinoid necrosis in the aortic media compared to control pigs. Camel milk supplementation was found to improve and protect the aorta from degeneration by modifying the PPAR alpha/SREBP1 ratio, resulting in increased activity of fat-metabolizing enzymes and hormones, higher caloric expenditure, or decreased fat storage, and thus preventing or treating aortic tissue lesion [Citation58]. The uptake of ox-LDL by macrophage scavenger receptors is assumed to be substantially responsible for disease progression. Ox-LDL is a crucial factor in the onset and progression of atherosclerosis [Citation59]. In vivo, LOX-1 accumulates in human and animal atherosclerotic lesions as an ox-LDL receptor [Citation60]. LOX-1 protein expression levels are significantly higher in the aortas of STZ/HFD-administered control pigs. Previous research has found that oxLDL and Lox-1 are colocalized in atherosclerotic lesions [Citation61], and that HFD increased Lox-1 expression in the aorta [Citation62]. In atherosclerotic plaques, interactions between oxLDL and Lox-1 may play a role in matrix disintegration [Citation63,Citation64]. The overexpression of Lox-1 by endothelial cells, triggered by oxLDL, may be involved in atherosclerotic plaque disruption [Citation63]. According to this findings, Camel milk dramatically reduced lox-1 expression in the aorta of diabetic/atherosclerotic pigs by inhibiting LOX-1 expression. This might be related to camel milk’s capacity to greatly promote AMPK activation [Citation53]. AMPK is a conserved energy molecule that drives catabolic pathways to create ATP by blocking lipogenesis [Citation65]. Similarly, the antioxidant activity of camel milk may aid in the prevention of ox-LDL and LOX-1 production and lipid buildup in the tissues of concern.
Conclusion
The anti-dyslipidemic and endothelial health benefits of camel milk were discovered to be dose-dependent, as evidenced by improvements in the lipid profile, liver enzymes, and aortic vascular endothelial function. As a result, the current study validates camel milk’s medicinal use in dyslipidemia and related vascular and metabolic disorders.
Authors contribution
All authors contributed to the concept and design. Study materials are provided by Hadiza Bello Rilwan, Sunday Samuel Adibisi, James Abrak Timbuak, &, Sunday Blessing Oladele; Data collection: Hadiza Bello Rilwan, Wusa Makena, Aliyu Muhammad, James Abrak Timbuak & Adamu Abubakar Sadeeq. Data interpretation and analysis: All authors; The first draft of the manuscript: Hadiza Bello Rilwan, Wusa Makena, Sunday Samuel Adibisi & Aliyu Muhammad. Manuscript review: Hadiza Bello Rilwan, Wusa Makena, Sunday Blessing Oladele, Sunday Samuel Adibisi & Adamu Abubakar Sadeeq. The manuscript’s final approval: All authors.
Acknowledgements
My special thanks go to Mr Jigo Yaro, Chief Medical Laboratory Scientist, Department of Pathology, ABU Teaching Hospital, and Mr Peter Akpulu of the Human Anatomy Department, who took their time to process the tissues.
Disclosure statement
No potential conflict of interest was reported by the author(s).
Data availability statement
The raw data that support the findings of this study are available on request from the corresponding author (https://figshare.com/s/f378bb6773ed7b8e5eb7).
References
- Wanner C, Amann K, Shoji T. The heart and vascular system in dialysis. Lancet. 2016;388(10041):276–284.
- Tyrrell DJ, Goldstein DR. Ageing and atherosclerosis: vascular intrinsic and extrinsic factors and potential role of IL-6. Nat Rev Cardiol. 2020;18(1):58–68.
- Di Pietro N, Formoso G, Pandolfi A. Physiology and pathophysiology of oxldluptake by vascular wall cells in atherosclerosis, Vasc. Pharmacol. 2016;84:1–7.
- Li C, Zhang J, Wu H, et al. Lectin-like oxidized low-density lipoprotein receptor-1 facilitates metastasis of gastric cancer through driving epithelial-mesenchymal transition and PI3K/Akt/GSK3β activation. Sci Rep. 2017 27;7(1):45275. PMID: 28345638; PMCID: PMC5366889.
- Udell JA, Bhatt DL, Braunwald E, et al. Scirica BM; SAVOR-TIMI 53 steering committee and investigators. Saxagliptin and cardiovascular outcomes in patients with type 2 diabetes and moderate or severe renal impairment: observations from the SAVOR-TIMI 53 trial. Diabetes Care. 2015;38(4):696–705. PMID: 25552421.
- Einarson TR, Acs A, Ludwig C, et al. Prevalence of cardiovascular disease in type 2 diabetes: a systematic literature review of scientific evidence from across the world in 2007–2017. Cardiovasc Diabetol. 2018;17(1):83.
- Dharmalingam M, Yamasandhi PG. Nonalcoholic fatty liver disease and type 2 diabetes mellitus. Indian J Endocrinol Metab. 2018;22(3):421–428.
- Kanuri BN, Rebello SC, Pathak P, et al. Glucose and lipid metabolism alterations in liver and adipose tissue pre-dispose p47phox knockout mice to systemic insulin resistance. Free Radic Res. 2018;52:568–582.
- Singh A, Srinivasan AK, Chakrapani LN, et al. LOX-1, the common therapeutic target in hypercholesterolemia: a new perspective of antiatherosclerotic action of aegeline. Oxid Med Cell Longev. 2019;2019:11. Article ID 8285730.
- Head T, Daunert S, Goldschmidt-Clermont PJ. The Aging Risk and atherosclerosis: a fresh look at arterial homeostasis. Front Genet. 2017;8:216.
- Kong P, Cui ZY, Huang XF, et al. Inflammation and atherosclerosis: signaling pathways and therapeutic intervention. Vol. 7; 2022. pp. 131. doi:10.1038/s41392-022-00955-7.
- Ayoub MA, Palakkott AR, Ashraf A, et al. The molecular basis of the anti-diabetic properties of camel milk. Diabetes Res Clin Pract. 2018;146:305–312.
- Abdul-Elhakim YM, El-Sharkawy NI, Mohammed HH, et al. Camel milk rescues neurotoxic impairments induced by fenpropathrin via regulating oxidative stress; apoptotic and inflammatory events in the brain of rats. Food Chem Toxicol. 2020;135:111055.
- Mohamed AAR, Abdellatief SA, Khater SI, et al. Fenpropathrin induces testicular damage, apoptosis, and genomic DNA damage in adult rats: protective role of camel milk. Ecotoxicol Environ Saf. 2019;181:548–558.
- Benmeziane-Derradji F. Evaluation of camel milk: gross composition-a scientific overview. Trop Anim Health Prod. 2021;53:308.
- Anwar I, Khan FB, Maqsood S, et al. Camel milk targeting insulin receptor—toward understanding the antidiabetic effects of camel milk. Front Nutr. 2022;8:819278.
- Badr G, Ramadan NK, Sayed LH, et al. Why whey? Camel whey protein as a new dietary approach to the management of free radicals and for the treatment of different health disorders. Iran J Basic Med Sci. 2017;20:338–349.
- Swelum AA, El-Saadony MT, Abdo M, et al. Nutritional, antimicrobial and medicinal properties of camel’s milk: a review. Saudi J Biol Sci. 2021;28(5):3126–3136. Epub 2021 Feb 21. PMID: 34025186; PMCID: PMC8117040.
- Singh R, Ghorui SK, Sahani MS. Camel milk: properties and processing potential. The Indian camel 2006; NRCC, Bikaner.;59–73.
- Navarrete-Rodríguez EM, Ríos-Villalobos LA, Alcocer-Arreguín CR, et al. Cross-over clinical trial for evaluating the safety of camel’s milk intake in patients who are allergic to cow’s milk protein. Allergo immunopathol (Madr). 2018;462:149–154.10.1016/j.aller.2017.06.005.
- Srinivasan K, Viswanad B, Asrat L, et al. Combination of high-fat diet-fed and low-dose streptozotocin-treated rat: a model for type 2 diabetes and pharmacological screening. Pharmacol Res. 2005;52(4):313–320. PMID: 15979893.
- Gerrity RG, Natarajan R, Nadler JL, et al. Diabetes-Induced Accelerated Atherosclerosis in Swine. Diabetes. 2001 JULY;50:1654–1665.
- Mansour AA, Nassan MA, Saleh OM, et al. Protective effect of camel milk as anti-diabetic supplement: biochemical, molecular and immunohistochemical study. Afr J Tradit Complement Altern Med. 2017;14(4):108–119.
- DiGiacomo K, Zamuner F, Sun Y, et al. Effects of raw and pasteurized camel milk on metabolic responses in pigs fed a high-fat diet. Animals. 2022;12:1701.
- Reitman S, Frankel S. A colorimetric method for the determination of serum glutamic oxalacetic and glutamic pyruvic transaminases. Am J Clin Pathol. 1957Jul;28(1):56–63. PMID: 13458125.
- Wright PJ, Plummer DT, Leathwood PT. Enzyme in rat urine Alkaline phosphatase. Enzymologia. 1972;42:317–327.
- Tabatabai M, Segal R, Amidi M, et al. Serum creatine phosphokinase, lactic dehydrogenase, and their isoenzymes in the perioperative period. J Clin Anesth. 1989;1(4):277–283. PMID: 2627401.
- Scouller K, Conigrave KM, Macaskill P, et al. Should we use carbohydrate deficient transfferin instead of gamma glutamyl transferase for detecting problem drinkers? a systematic review and meta analysis. Clin Chem. 2000;46:1894–1902.
- Bancroft JD, Layton C. The hematoxylin and eosin. In: Suvarna SK, Layton C, Bancroft JD, editors. Theory Practice of histological techniques 7th Ch. 10 and 11. Philadelphia: Churchill Livingstone of El Sevier; 2018. p. 179–220. 10.1016/b978-0-7020-4226-3.00010-x.
- Gordon H, Sweets HH. A simple method for the silver impregnation of reticulum. Am J Pathol. 1936;12(4):545–552.1. PMID: 19970284; PMCID: PMC1911089.
- Rieppo L, Janssen L, Rahunen K, et al. Histochemical quantification of collagen content in articular cartilage. PLoS One. 2019;14(11):e0224839. PMID: 31697756; PMCID: PMC6837441.
- Kleiner DE, Brunt EM, Van Natta M, et al. Design and validation of a histological scoring system for nonalcoholic fatty liver disease. Hepatology. 2005;41:1313–1321.
- Ruifrok AC, Johnston DA. Quantification of histochemical staining by colour deconvolution. Anal Quant Cytol Histol. 2001;23:291–299. PMID: 11531144.
- Uslu GA, Gelen V, Uslu H, et al. Effects of Cinnamomum cassia extract on oxidative stress, immunreactivity of iNOS and impaired thoracic aortic reactivity induced by type II diabetes in rats. Braz. J. Pharm. Sci. 2018;54(3): e17785
- Madkhali HA. Morin attenuates high-fat diet induced-obesity related vascular endothelial dysfunction in wistar albino rats. Saudi Pharm J. 2020;28(3):300–307. PMID: 32194331; PMCID: PMC7078537.
- Zhao Y, Qu H, Wang Y, et al. Small rodent models of atherosclerosis. Biomed Pharmacother. 2020;129(2020):110426.
- Lim AK. Abnormal liver function tests associated with severe rhabdomyolysis. World J Gastroenterol. 2020 14;26(10):1020–1028. PMID: 32205993; PMCID: PMC7081005.
- Adil M, Kandhare AD, Ghosh P, et al. Sodium arsenite-induced myocardial bruise in rats: ameliorative effect of naringin via TGF-β/Smad and Nrf/HO pathways. Chem Biol Interact. 2016;253:66–77.
- Mazen A, John EG. Hypoglycemia in patients with diabetes and renal disease. J Clin Med. 2015;4:948–964.
- Behrouz S, Saadat S, Memarzia A, et al. The antioxidant, anti-inflammatory and immunomodulatory effects of camel milk. Front Immunol. 2022;13:855342. PMID: 35493477; PMCID: PMC9039309.
- Zheng Y, Wu F, Zhang M, et al. Hypoglycemic effect of camel milk powder in type 2 diabetic patients: a randomized, double-blind, placebo-controlled trial. Food Sci Nutr. 2021;9(8):4461–4472.
- Fallah Z, Feizi A, Hashemipour M, et al. Positive effect of fermented camel milk on liver enzymes of adolescents with metabolic syndrome: a double blind, randomized, cross-over trial. Mater Sociomed. 2018;30(1):20–25. PMID: 29670474.
- Pei K, Gui T, Kan D, et al. An overview of lipid metabolism and nonalcoholic fatty liver disease. Biomed Res Int. 2020;18:4020249. PMID: 32733940; PMCID: PMC7383338.
- Akhtar DH, Iqbal U, Vazquez-Montesino LM, et al. Pathogenesis of insulin resistance and atherogenic dyslipidemia in nonalcoholic fatty liver disease. J Clin Transl Hepatol. 2019;7(4):362–370. Epub 2019 Nov 29. PMID: 31915606; PMCID: PMC6943204.
- Brankovi´c M, Jovanovi´c I, Duki´c M, et al. Lipotoxicity as the leading cause of non-Alcoholic steatohepatitis. Int J Mol Sci. 2022;23:5146.
- Ma M, Liu H, Yu J, et al. Triglyceride is independently correlated with insulin resistance and islet beta cell function: a study in population with different glucose and lipid metabolism states. Lipids Health Dis. 2020;19:121.
- Petyaev IM, Dovgalevsky PY, Chalyk NE, et al. Reduction of elevated lipids and low‐density lipoprotein oxidation in serum of individuals with subclinical hypoxia and oxidative stress supplemented withlycosome formulation of docosahexaenoic acid. Food Sci Nutr. 2019;7:1147–1156.
- Haixia D, Chang L, Zhixiong W, et al. Effects of Danhong injection on dyslipidemia and cholesterol metabolism in high-fat diets fed rats. J Ethnopharmacol. 2021;274:114058.
- Tangvarasittichai S. Oxidative stress, insulin resistance, dyslipidemia and type 2 diabetes mellitus. World J Diabetes. 2015;6(3):456–480. PMID: 25897356; PMCID: PMC4398902.
- Ejtahed HS, Niasari NA, Mirmiran P, et al. Effect of camel milk on blood sugar and lipid profile of patients with type 2 diabetes: a pilot clinical trial. Int J Endocrinol Metab. 2015 22;13(1):e21160. PMID: 25745496; PMCID: PMC4338669.
- Zuberu J, Saleh MIA, Alhassan AW, et al. Hepatoprotective effect of camel milk on poloxamer 407 induced hyperlipidaemic Wistar rats. Open Access Maced J Med Sci. 2017;5(7):852–858.
- Rilwan HB, Adebisi SS, Timbuak JA, et al. Camel milk ameliorates diabetes in pigs by preventing oxidative stress, inflammation and enhancing beta cell function. J Diabetes Metab Disord. 2022;21:1625–1634.
- Mohammad A, Alshuniaber GM, Alshammari SM, et al. Camel milk protein hydrosylate alleviates hepatic steatosis and hypertension in high fructose-fed rats. Pharm Biol. 2022;60(1):1137–1147.
- Qinna NA, Badwan AA. Impact of streptozotocin on altering normal glucose homeostasis during insulin testing in diabetic rats compared to normoglycemic rats. Drug Des Dev Ther. 2015;9: 2515–2525. PMID:26005328: 10.2147/DDDT.S79885
- Carvalho KM, Marinho FJD, de Melo TS, et al. The resin from protium heptaphyllum prevents high-Fat Diet-Induced obesity in mice: scientific evidence and potential mechanisms. Evid Based Complement Alternat Med. 2015;2015:1–13. Epub 2015 Jan 29. PMID: 25709707; PMCID: PMC4325975.
- Khan MZ, Xiao J, Ma Y, et al. Research development on anti-microbial and antioxidant properties of camel milk and its role as an anti-Cancer and anti-Hepatitis agent. Antioxidants. 2021;10:788.
- Shakeel K, Rabail R, Iahtisham-Ul-Haq S, et al. Camel milk protectiveness toward multiple liver disorders: a review. Front Nutr. 2022;9:944842.
- Korish AA, Arafah MM. Camel milk ameliorates steatohepatitis, insulin resistance and lipid peroxidation in experimental non-alcoholic fatty liver disease. BMC Complement Altern Med. 2013;13:264.
- Kattoor AJ, Goel A, Mehta JL. LOX-1: regulation, Signaling and Its Role in Atherosclerosis. Antioxidants (Basel). 2019;8(7):218. PMID: 31336709; PMCID: PMC6680802.
- Shatoor AS, Humayed SA. The protective effect of crataegus aronia against high-Fat diet-Induced vascular inflammation in rats entails inhibition of the NLRP-3 inflammasome pathway. Cardiovasc Toxicol. 2019. 10.1007/s12012-019-09534-9
- Poznyak AV, Nikiforov NG, Markin AM, et al. Overview of OxLDL and its impact on cardiovascular health: focus on atherosclerosis. Front Pharmacol. 2021;11:613780.
- Son M, Oh S, Jang JT, et al. Pyrogallol-Phloroglucinol-6 6-Bieckol on attenuates high-Fat diet-Induced hypertension by modulating endothelial-to mesenchymal transition in the aorta of mice. Oxid Med Cell Longev. 2020;2021:12. Article ID 8869085.
- Tsai KL, Chang YL, Huang PH, et al. Ginkgo biloba extract inhibits oxidized low-density lipoprotein (oxLDL)-induced matrix metalloproteinase activation by the modulation of the lectin-like oxLDL receptor 1-regulated signaling pathway in human umbilical vein endothelial cells. J Vasc Surg. 2016;63(1):204–15.e1.
- Barreto J, Karathanasis SK, Remaley A, et al. Role of LOX-1 (Lectin-Like oxidized low-Density lipoprotein receptor 1) as a cardiovascular risk predictor: mechanistic insight and potential clinical use. Arterioscler Thromb Vasc Biol. 2021;41(1):153–166. Epub 2020 Nov 12. PMID: 33176449; PMCID: PMC9186447.
- Wang Q, Liu S, Zhai A, et al. AMPK-mediated regulation of lipid metabolism by phosphorylation. Biol Pharm Bull. 2018;41(7):985–993.