
ABSTRACT
Diabetes Mellitus is the most common metabolic disorder affecting central nervous system (CNS) and is associated with altered brain structure. In this study, we assessed the ability of Cerebrolysin, alone and combined with insulin, to protect from the hippocampal degenerative changes in a diabetic rat model. Sixty adult male albino rats were equally divided into: control (gpI), diabetic (gpII), insulin-treated (gpIII), Cerebrolysin-treated (gpIV) and combined Insulin & Cerebrolysin-treated groups (gpV). Type-1 DM was induced by a single intraperitoneal injection of Streptozotocin (65 mg/kg) in groups (II, III, IV & V). Insulin was given subcutaneously (1 U/100g) daily, starting from the 4th day till the end of the experiment. Cerebrolysin was given intraperitonealy (5 ml/kg/day), starting from the 4th day till the end of the experiment. Hippocampus samples were collected 8-weeks post-injection. Hematoxylin & Eosin (H&E) and Immunohistochemical stains were used to assess the degenerative changes. The rat hippocampal region (CA3) and the dentate gyrus (DG) were subjected to microscopic examination and morphometric analysis. The hippocampus of rats of group II showed evident degenerative changes. Changes in immunohistochemical expression of Bax, TNF-alpha, Synaptophysin & GFAP were also detected. The morphometric study revealed changes in the thickness of layers and number of cells. Groups III and IV showed mild improvement in most parameters. Group V demonstrated marked improvement in most parameters and the hippocampus appeared more or less similar to the control. Cerebrolysin is a neurotropic drug that protects from the diabetic degenerative changes, especially if combined with insulin.
Introduction
Diabetes mellitus (DM) is a metabolic disorder affecting the whole-body systems. Besides the most common peripheral nervous system (PNS) complications in diabetic patients, diabetes has negative impacts on the central nervous system (CNS) [Citation1]. Although diabetic peripheral neuropathy has been extensively reported, the numbers of studies that investigated diabetes-related changes in the CNS are still limited [Citation2]. Cognition is the mental process of acquiring knowledge and understanding through thoughts, experiences, and senses. Cognition is regulated by discrete brain circuits in different brain areas such as prefrontal cortex, hippocampus and cerebellum [Citation3]. It has been reported that chronically increased intracellular glucose concentration leads to functional and structural changes in brain areas concerned with cognitive function [Citation4].
The hippocampus is a small organ located within the brain’s medial temporal lobe and forms an important part of the limbic system concerned with memory, emotions and behavior [Citation5]. The hippocampal formation is subdivided into hippocampus proprius, dentate gyrus (DG) and subicular cortex. The hippocampus proprius is formed of five layers. It is divided into four regions (CA1–CA4) according to density, size and branching of axons and dendrites of the pyramidal cells in the pyramidal cell layer. The DG consists of three layers [Citation6]. The granule cell layer (GCL) contains granule cells and immature neurons in the subgranular zone (SGZ) which is one of the stem cell-containing areas in adult mammalian brain [Citation7,Citation8].
Insulin has been widely used for blood glucose control in people with DM. It exerts a neuroprotective effect by reducing glutamate, rather than by modifying glucose levels [Citation9]. Also, it can inhibit neuronal necrosis and apoptosis as neurotrophic factors [Citation10,Citation11]. Cerebrolysin (Cbl) is a neurotropic drug that enhances brain health and cognitive performance. It includes many neurotrophic factors that participate in improving the integrity of the neuronal circuits. Cbl has a fast onset of action that helps to regain and maintain the independence of patients suffering from stroke, dementia and cognitive impairment [Citation12].
In this study, we investigated the microscopic and histological changes in the rat hippocampus after the experimental induction of diabetes by streptozotocin (STZ). The potential ability of Cbl, alone and combined with insulin, to protect from the degenerative changes of DM was also assessed.
Material and methods
This study was approved by the Institutional Review Board (IRB), Faculty of Medicine, Mansoura University. Code number: MS.19.02.495. All the steps took place in Mansoura Experimental Research Center (MERC), Faculty of Medicine, Mansoura University and were performed in accordance with international guidelines for care and use of laboratory animals.
Material
Streptozotocin was purchased from Sigma Company; available in the form of 4000 ml vial for intraperitoneal injection (I.P.I).
Cerebrolysin was purchased from Sigma Company; available in the form of 5 ml vial for I.P.I.
Insulin was purchased from Sigma Company; available in the form of 10 ml vial for S.C. injection.
Primary antibodies were purchased from Sigma Company; included rabbit polyclonal anti-Bax antibody (catalog number: sc-526); rabbit polyclonal anti -TNF α antibody (catalog number: IW-PA1079), mouse monoclonal anti-synaptophysin antibody (catalog number: A0010) and mouse monoclonal anti-GFAP antibody (catalog number: NCL-GFAP-GA5).
Experimental design and animal groups
Sixty adult male albino rats, weighing (180–220 g) were used in this study. Animals were housed in a temperature- and humidity-controlled environment on a 12 h/12 h light/dark cycle with free access to food and water. All animals were weighed at the beginning and at the end of the experiment.
The animals were randomly divided into five equal groups, 12 rats each. Group I (control group) was equally subdivided into four subgroups. The first subgroup received nothing, the second received STZ vehicle, the third received Cbl vehicle and the fourth received Cbl only. Group II (diabetic group) received a single I.P.I of STZ (65 mg/kg in 100 mmol/L sodium citrate buffer, pH 4.5) on day 1 of the experiment [Citation13]. Group III (insulin-treated group) received a single I.P.I of STZ as in group II. After biochemical confirmation of hyperglycemia, the animals received insulin (Mixtard 30/70) at a dose of 1 U/100 g, once/day subcutaneously, starting from the fourth day till the end of the experiment [Citation14]. Group IV (Cerebrolysin-treated group) received a single I.P.I of STZ as group II. Then, they received I.P.I of 5 ml/kg/day of Cbl, starting from the fourth day till the end of the experiment [Citation15]. Group V (insulin- and Cerebrolysin-treated group) received a single I.P.I of STZ as in group II and combined treatment of insulin and Cbl as in Groups III and IV, respectively. After 8 weeks, the rats were anesthetized by I.P.I of sodium pentobarbital 40 mg/kg then perfused through the left ventricle with 500 ml of 10% neutral buffered formalin (NBF). The brains were dissected out; the hippocampus was cut out, fixed in NBF and prepared for histological and immunohistochemical studies.
Histological and immunohistochemical studies
Paraffin sections of 5 µm thickness were prepared from the hippocampus specimens and stained with H&E. The sections were also stained immunohistochemically by anti-Bax for demonstration of apoptotic process, anti-TNF-α for assessment of inflammatory process, anti-synaptophysin for demonstration of synaptic density and anti-GFAP for assessment of astrocyte reactivity [Citation16].
For immunohistochemical staining, paraffin sections of 5 µm thickness were cut and mounted on positively charged slides, deparaffinized in xylene for 30 min and rehydrated in descending grades of ethanol. Then, the sections were treated with 3% hydrogen peroxide in methanol for 15 min at 37°C to block endogenous peroxidase activity. Antigen retrieval and blocking of nonspecific antigens were performed then, the primary antibodies were applied at room temperature for 60 min with a dilution of 1:100. Detection of primary antibodies was done by using a biotin – streptavidin detection system with 3, 3’-diaminobenzidine (DAB) as a chromogen. After that, sections were counterstained with hematoxylin, dehydrated, cleared and mounted in Canada balsam [Citation17].
Positive and negative control slides were prepared. Positive control monitored the correct performance of tissue and reagents; it included kidney for Bax, liver for TNF-alpha, pancreas for synaptophysin and brain for GFAP. Negative control sections were subjected to the same steps with the omission of the primary antibody.
Morphometric study and statistical analysis
Stratum pyramidale (st.py) in CA3 of hippocampus proprius and granule cell layer (GCL) of DG were chosen for morphometric study (power ×100).
The following parameters were assessed:
Body weight (g) and fasting blood glucose level (BGL) (mg/dl) of rats at the beginning of the experiment, as well as before sacrifice (after 8 weeks).
Thickness of st.py in CA3 and thickness of GCL in DG (µm).
Neuronal cell count for intact pyramidal cells in CA3 and intact granule cells in GCL.
The mean area % for GFAP and synaptophysin +ve immunoreaction in both CA3 and DG.
For assessment of the previous parameters, six non-overlapping fields from each animal in each group were randomly chosen and photographed in Department of Medical Histology and Cell Biology, Faculty of Medicine, Mansoura University. Olympus® digital camera installed on Olympus® microscope with 0.5 × photo adaptor was used. The objective lens was chosen according to the required analysis. The data were tabulated, coded then analyzed using SPSS software program. The significance of difference was calculated using ANOVA (one-way analysis of variance) to compare two groups of numerical data, followed by post hoc Tukey for multiple comparisons.
The results were first assessed semi-quantitatively on the basis of the estimated proportion of the positive cells, and then quantitatively using the ‘quick score’. The intensity of cytoplasmic staining was graded from 0 to 3; 0 (negative), 1 (weak), 2 (moderate) and 3 (strong). The percentage of positive stained cells was estimated on each section. Q-score was calculated by multiplying the percentage of positive cells by the intensity of the staining. The average and SD of Q-score were calculated for each section. F-test was used for scoring analysis [Citation18].
For all tests, significance was realized at P-value; P-value <0.05 was considered statistically significant and P-value <0.001 was considered highly significant.
The mean multiplicative Quick-score (Q-score) for Bax and TNF-α expression was calculated.
Results
The diabetic group (Group II) showed mortality of four rats after STZ administration.
Results of histological study
For microscopic examination, CA3 region of hippocampus proprius and DG were chosen for the assessment of H&E and immunohistochemical stains.
H&E stain
Group I (Control Group)
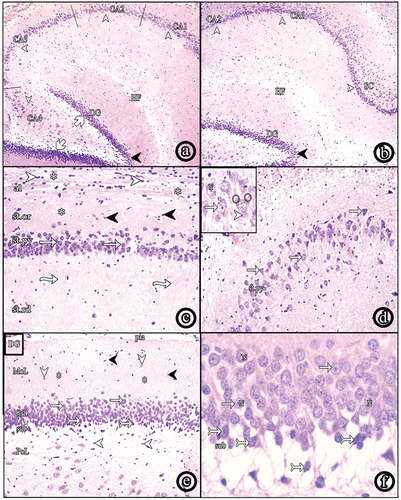
The hippocampal formation consisted of hippocampus proprius, dentate gyrus (DG) and the subicular cortex (SC). The hippocampus proprius could be differentiated into CA1, CA2, CA3 and CA4 regions. The DG had a crest and upper and lower blades surrounding CA4 (. The hippocampus proprius was formed of the following layers; the alveus, stratum oriens (st.or), stratum pyramidale (st.py), stratum radiatum (st.rd) and stratum lacunosum-moleculare (st.lm). The alveus was the innermost layer containing nerve fibers and neuroglial cells. St.or showed scattered cells within the nerve fibers. St.py consisted of 5–6 layers of pyramidal cells. St.rd showed a radial streaking pattern of fibers. Finally, St.lm showed horizontal fibers, neuroglial cells and blood vessels (. Pyramidal cells of CA3 appeared as large sized, loosely packed triangular cells with vesicular nuclei and prominent nucleoli. Each cell showed an apical dendrite ramifying toward St.rd and basal dendrites (. The DG consisted of molecular, granular and polymorphic layers. The polymorphic layer showed scattered polymorphic nuclei. The granule cell layer (GCL) contained 8–9 compactly arranged layers of granule cells with vesicular nuclei and prominent nucleoli. Spindle-shaped immature cells with oval darkly stained nuclei were seen in the subgranular zone (SGZ) (.
Figure 1. Photomicrographs of paraffin sections in the hippocampus. (a & b) show hippocampus proprius, dentate gyrus (dg) and subiculum (SC); (HF: hippocampal fissure, CA: cornus amonis, blades of DG (white arrows), crest (black arrow heads (H&E, ×40). (c) shows layers of the hippocampus; alveus (al), stratum oriens (st.Or), stratum pyramidale (st.Py) and stratum radiatum (st.Rd); (neuroglial cells (white arrow heads), nerve fibers (asterisks), scattered nuclei (black arrow heads), pyramidal cells (white arrows), radial fibers (wavy arrows) (H&E, ×100). (d) shows CA3 region (H&E, ×100) and the inset shows a higher magnification of pyramidal cells (white arrows) with vesicular nuclei (N), apical dendrite (arrow head) and basal dendrites (round shape) (H&E, ×400). (e) shows layers of the DG; the molecular layer (MoL), the granule cell layer (GrL) and the polymorphic layer (PoL); (pia matter (pia), blood vessels (black arrow heads), scattered nuclei (arrow heads), nerve fibers (asterisks), granule cells (white arrows), immature cells (tailed arrows), the subgranular zone (sub) (H&E, ×100). (f) shows a higher magnification of granule cells (white arrows) with vesicular nuclei (N). Spindle-shaped immature cells (tailed arrows) appear in the subgranular zone (H&E, ×400).
Group II (Diabetic Group)
The hippocampus proprius of this group showed numerous small shrunken pyramidal cells with darkly stained nuclei and cytoplasm, as well as normal pyramidal cells (. Some pyramidal cells were displaced toward St.or. Focal areas of cell loss were observed in which number of layers were reduced to one layer. Numerous neuroglial cells were observed in St.rd (. The DG showed a large number of shrunken darkly stained granule cells, in addition to normal granule cells with vesicular nuclei. Immature cells in SGZ were absent (.
Figure 2. Photomicrographs of paraffin sections in CA3. (a) Group II shows numerous shrunken darkly stained pyramidal and neuroglial cells. (b) Group III and (c) Group IV show decreased shrunken pyramidal and neuroglial cells. (d) Group V reveals very few shrunken pyramidal cells with increased number of normal ones. Also, neuroglial cells decreased in number (H&E, ×100). (e) a higher magnification of the diabetic group (Group II) and (f) a higher magnification of insulin and Cbl-treated group (Group V) (H&E, ×400); (shrunken pyramidal cells (white arrows), normal pyramidal cells (wavy arrows), neuroglial cells (arrow heads), focal areas of cell loss (asterisks), vesicular nuclei (N).
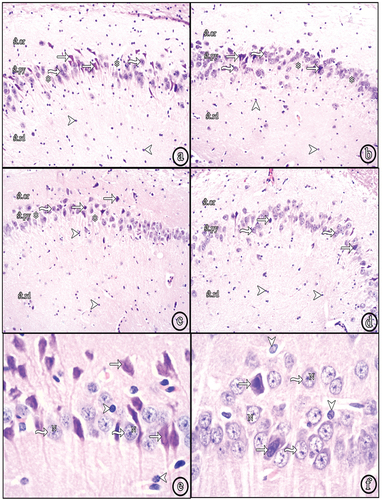
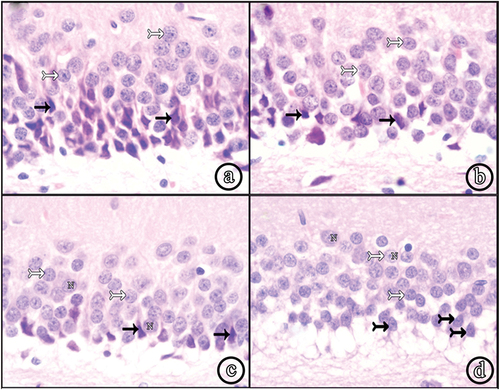
Figure 3. Photomicrographs of paraffin sections in the DG. (a) Group II (diabetic group) shows numerous shrunken darkly stained granule cells. (b) Group III (insulin-treated group) and (c) Group IV (Cbl-treated group) show an apparent decreased number of shrunken granule cells. (d) Group V (insulin- and Cbl-treated group) shows no shrunken cells. Immature cells are seen in the subgranular zone (sub); (normal granule cells (white tailed arrows), shrunken granule cells (black arrows), vesicular nuclei (N), immature cells (black tailed arrows) (H&E, ×400).
Group III (Insulin-treated Group) and Group IV (Cerebrolysin-treated Group)
Sections of both groups showed a decreased number of degenerated pyramidal cells and an increase in normal ones. The displacement and focal loss of pyramidal cells were still observed. St.rd demonstrated an apparent decreased number of neuroglial cells ( (b & c)). The DG showed a decreased number of shrunken granule cells and more number of normal granule cells, compared to the diabetic group. Immature cells in SGZ could not be seen ( (b and c)).
Group V (Insulin- and Cerebrolysin-treated group)
Most of the pyramidal cells in the hippocampus appeared normal with vesicular nuclei. Very few degenerated cells were seen (. No areas of cell loss were observed. St.rd showed a marked decrease in neuroglial cells (. Almost all granule cells in DG were normal. Very few shrunken granule cells were observed. The immature cells reappeared in the SGZ (.
Immunohistochemical stains
Bax and TNF-alpha stains
The control group (Group I) showed -ve immune reaction in the cytoplasm of pyramidal cells in CA3 ( and granule cells in DG (. The diabetic group (Group II) showed numerous +ve immunostained cells in both CA3 and DG. The insulin-treated (Group III) and Cbl-treated (Group IV) groups showed a decreased number of +ve cells. Insulin- and Cbl-treated group (Group V) showed a marked decrease in the immunoreactivity (.
Figure 4. Photomicrographs of paraffin sections in CA3 region showing Bax, TNF-α, synaptophysin and GFAP immune reactions; Positive reactions (arrow heads) (Power × 100). According to Bax and TNF- α immunostains; Group I (control group) shows -ve immune reaction. Group II shows numerous +ve immunostained cells. Group III (insulin-treated group) and Group IV (Cbl-treated group) shhow a decrease in the number of immunoreactive cells and in Group V (insulin- and Cerebrolysin-treated group) almost all cells appear -ve immunostained. In synaptophysin stain, +ve reaction of presynaptic terminals is seen in the form of coarse beaded granules at surfaces of pyramidal cells and at their apical dendrites. Group II shows markedly decreased immunoreactivity. Group III and Group IV show a moderate decrease and Group V shows a marked decrease in number of labeled astrocytes.
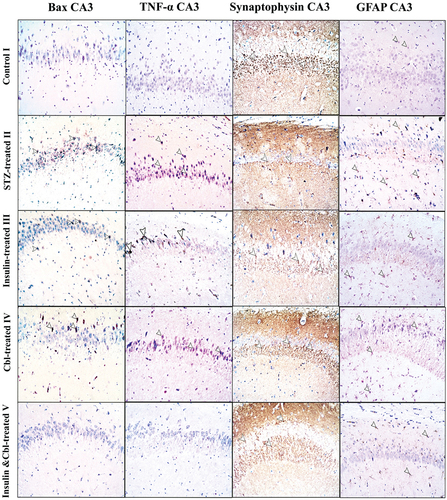
Figure 5. Photomicrographs of paraffin sections in DG showing Bax, TNF-α, synaptophysin and GFAP immune reactions; Positive reactions (arrow heads) (Power × 100). According to Bax and TNF-alpha immunostains; Group I (control group) shows -ve immune reaction. Group II shows numerous +ve immunostained cells. Group III (insulin-treated group) and Group IV (Cbl-treated group) show a decrease in the number of immunoreactive cells and Group V (insulin- and Cerebrolysin-treated group) shows a marked decrease in immunoreactivity compared to the diabetic group. In synaptophysin stain, +ve reaction of presynaptic terminals is seen in the form of coarse beaded granules at surfaces of granule cells in the granule cell layer and in hilus fasciae dentate. Group II show a markedly decreased immunoreactivity. Group III and Group IV show a mild increase in immunoreactivity and Group V show a marked increase in immune reaction compared to the diabetic group. GFAP immunoreaction in Group I shows few small sized astrocytes with thin short processes. Group II shows a marked increase in labeled astrocytes. Group III, Group IV and Group V show a moderate decrease in number of labeled astrocytes compared to the diabetic group.
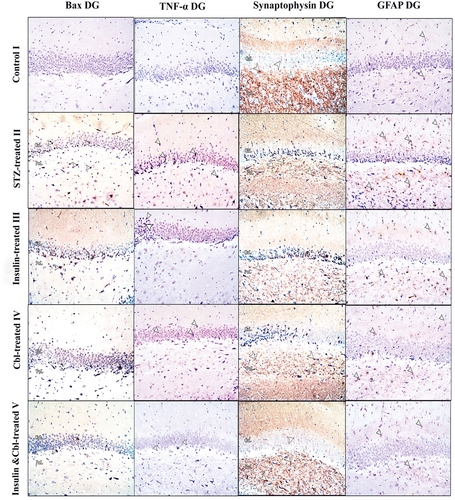
Synaptophysin
The control group (Group I) showed +ve immune reaction of presynaptic terminals in the form of coarse beaded granules at surfaces of pyramidal cells ( and granule cells and in the hilus fasciae dentate (the polymorphic layer of DG with CA4) (. The diabetic group (Group II) showed a marked decrease in immune reaction. In CA3, the insulin-treated (Group III) and Cbl-treated (Group IV) groups demonstrated a moderate increase in immune reaction, while in DG, both groups showed a mild increase. The combined insulin- and Cbl-treated group (Group V) exhibited a marked increase in immunoreactivity in CA3 and DG ().
GFAP
The control group (Group I) showed a few number of +ve immunostained star-shaped astrocytes which appeared small with thin processes in CA3 ( and DG (. The diabetic group (Group II) showed a marked increase in the number of labeled astrocytes in both CA3 and DG. In CA3, the insulin-treated (Group III) and Cbl-treated (Group IV) groups exhibited a modearte decrease in +ve immunostained astrocytes, while combined the insulin- and Cbl-treated group (Group V) revealed a marked decrease in number of astrocytes. In DG, the insulin-treated (Group III), Cbl-treated (Group IV) and combined insulin- and Cbl-treated group (Group V) groups revealed a moderate decrease in number of astrocytes ().
Results of image analysis and statistical analysis
Body weight (g)
Figure 6. Representative histograms: (a) The mean body weight in different groups. (b) The mean fasting blood glucose level (BGL) in different groups. (c) The mean thickness of St.Py in CA3 and GCL in DG in different groups. (d) The mean number of pyramidal cells in CA3 and granule cells in DG of different groups (SD: standard deviation). *a: siginificance versus control group. *b: significance versus diabetic group. *c: significance versus insulin-treated group. *d: siginificance versus Cbl-treated group.
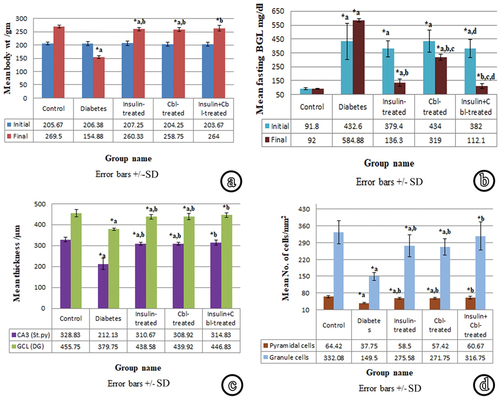
At the beginning of the experiment (72 h after induction of DM), the animal body weight did not show a significant difference among different groups. At the time of sacrifice (8-weeks following STZ injection); the diabetic group (Group II) showed a highly significant decrease (p ≤ 0.001) in body weight as compared to the control group (Group I). The insulin-treated (Group III) and Cbl-treated (Group IV) groups showed a highly significant increase compared to the diabetic group. However, both groups showed a significant decrease in body weight (p ≤ 0.05) as compared to the control. The combined insulin- and Cbl-treated group (Group V) showed a highly significant increase in body weight as compared to the diabetic group. There was no significant decrease in comparison with the control.
Fasting blood glucose level (BGL) (mg/dl)
The initial measurement of BGL of the diabetic group (Group II) at the beginning of the experiment showed a highly significant increase compared to the control. The insulin-treated (Group III), Cerebrolysin-treated (Group IV) and insulin- and Cbl-treated (Group V) groups showed no significant differences compared to the diabetic group. However, the three groups showed a significant increase compared to the control. Group V demonstrated a significant decrease compared to Group IV.
Just before sacrifice; diabetic group (Group II) showed a highly significant elevation in BGL as compared to the control (Group I). The insulin-treated (Group III) and Cerebrolysin-treated (Group IV) groups showed a highly significant decrease in BGL as compared to the diabetic group. However, both groups demonstrated a highly significant increase as compared to the control. Group IV showed a highly significant increase compared to Group III. In the group of combined treatment with insulin and Cbl (Group V), BGL showed a highly significant decrease in comparison with the diabetic group. On the other hand, no significant increase was observed compared to the control. This group also showed a significant decrease in BGL as compared to Group III and a highly significant decrease as compared to Group IV.
Thickness of Stratum Pyramidale (St.py) in CA3 region of hippocampus proprius (µm)
The thickness of St.py in CA3 was measured using magnification × 100 in all groups. Lines were drawn from the uppermost border of pyramidal cells to the lowermost one, perpendicular to the junction between St.py and St.rd. The diabetic group (Group II) demonstrated a highly significant decrease in St.py thickness in comparison with the control. The insulin-treated (Group III) and Cbl-treated (Group IV) groups exhibited a highly significant increase, compared to the diabetic group. However, both groups showed a significant decrease, compared to the control. The insulin- and Cbl-treated (Group V) group showed a highly significant increase in comparison with the diabetic group and a non-significant decrease in comparison with the control.
Thickness of granule cell layer (GCL) of DG (µm)
The thickness of GCL of DG was measured using magnification × 100 in all groups. Lines were drawn from the uppermost border of granule cells to the lowermost one, perpendicular to the junction between the GCL and polymorphic layer. The diabetic group demonstrated a highly significant decrease in GCL thickness as compared to the control. The insulin-treated (Group III) and Cbl-treated (Group IV) groups showed a highly significant increase as compared to the diabetic group and a significant decrease as compared to the control. The combined insulin- and Cbl-treated group (Group V) exhibited a highly significant increase in GCL thickness in comparison with the diabetic group and a non-significant decrease in comparison with the control.
Neuronal cell count for intact pyramidal and granule cells
The numbers of intact pyramidal cells in the St.py of CA3 of the hippocampus proprius, as well as, the numbers of intact granule cells in the GCL of the DG were counted/mm2 using magnification × 100. The number of intact pyramidal and granule cells in the diabetic group (Group II) revealed a highly significant decrease compared to the control. The insulin-treated (Group III) and Cbl-treated (Group IV) groups showed a highly significant increase, compared to the diabetic group and a significant decrease, compared to the control. The insulin- and Cbl-treated group (Group V) demonstrated a highly significant increase in neuronal cell count in comparison with Group II and a non-significant decrease in comparison with the control.
The mean multiplicative Q-score for Bax and TNF-α-positive cells
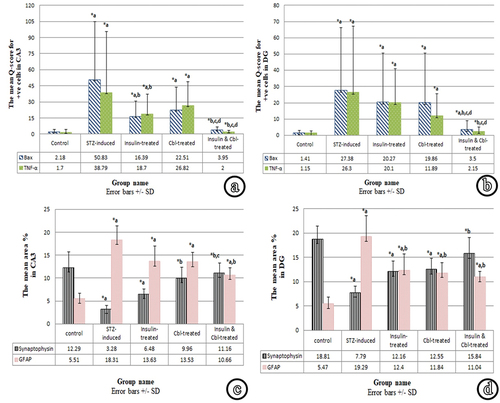
Figure 7. Representative histograms: (a) The mean Q-score of Bax and TNF- α expression in CA3 in different groups. (b) The mean Q-score of Bax and TNF-α expression n DG in different groups. (c) The mean area % of synaptophysin and GFAP reactions in CA3 in different groups. (d) The mean area % of synaptophysin and GFAP reactions in DG in different groups (SD, standard deviation). *a: sigificance versus control group. *b: significance versus diabetic group. *c: significance versus insulin-treated group. *d: significance versus Cbl-treated group.
The proportions of positive immunostained cells (weak, moderate and strong) in the St.py of CA3 region and in the GCL of DG were calculated/mm2 using magnification × 100.
As regards Bax reaction; sections of the diabetic group (Group II) showed a highly significant increase of the mean Q-scores in both CA3 and GCL, compared to the control. In CA3, the insulin-treated (Group III) groups showed a significant decrease, compared to Group II, while it showed a significant increase as compared to the control. Cerebrolysin-treated (Group IV) group showed a non-significant decrease, compared to Group II in the mean Q-score for Bax. In comparison with the control group, it showed a significant increase. Combined treatment with insulin and Cbl (Group V) group demonstrated a highly significant decrease in the mean Q-score for Bax, compared to the diabetic group, while it showed a non-significant increase compared, to the control. Also, Group V showed a significant decrease as compared with Groups III & IV. In GCL, the insulin-treated (Group III) and Cbl-treated (Group IV) groups showed a non-significant decrease in the mean Q-score for Bax, compared to the diabetic group, while both groups exhibited a highly significant increase, compared to the control. Combined treatment with insulin and Cbl in (Group V) showed a significant decrease in the mean Q-score for Bax, compared to the diabetic group and a significant increase, compared to the control. Also, Group V demonstrated a significant decrease as compared with Groups III and IV.
Concerning TNF-α reaction; sections of the diabetic group (Group II) showed a highly significant increase of TNF-α Q-score in both CA3 and GCL, compared to the control. In CA3, the insulin-treated group (Group III) showed a significant decrease, compared to the diabetic group and a significant increase, compared to the control. Cbl-treated group (Group IV) showed a non-significant decrease, compared to the diabetic group, while it showed a significant increase as compared to the control. Combined treatment with insulin and Cbl (Group V) showed a highly significant decrease in the mean Q-score of TNF-α, compared to the diabetic group and a non-significant increase, compared to the control. Group V also demonstrated a highly significant decrease compared to Groups III and IV. In GCL, the insulin-treated (Group III) and Cbl-treated (Group IV) groups revealed a non-significant decrease, compared to the diabetic group. Group III showed a highly significant increase, compared to the control and Group IV showed a significant increase compared to the control. Combined treatment with insulin and Cbl (Group V) resulted in a highly significant decrease in the mean Q-score for TNF-α, compared to the diabetic group and a non-significant increase, compared to the control. It also demonstrated a significant decrease in comparison with Groups III and IV.
The mean area % for synaptophysin and GFAP +ve immunoreaction
The mean area % of positive immune reaction for both synaptophysin and GFAP was measured in CA3 region and in DG using magnification × 100.
The mean percentage area of synaptophysin of diabetic group (Group II) showed a highly significant decrease in both CA3 and DG, compared to the control. In CA3, the insulin-treated group (Group III) revealed a non-significant increase, compared to the diabetic group and a significant decrease, compared to the control. The Cbl-treated group showed a significant increase, compared to the diabetic group, while it showed a non-significant decrease as compared to the control. The combined insulin- and Cbl-treated group (Group V) exhibited a highly significant increase, compared to the diabetic group and a non-significant decrease, compared to the control. Also, there was a significant increase, compared to the insulin-treated group. In DG, the insulin-treated (Group III) and Cbl-treated (Group IV) groups revealed a non-significant increase with the diabetic group. However, both groups showed a significant decrease, compared to the control. The combined insulin- and Cbl-treated group (Group V) exhibited a highly significant increase in the mean percentage area of synaptophysin, compared to the diabetic group and a non-significant decrease compared to the control.
Regarding GFAP reaction, sections of the diabetic group (Group II) revealed a highly significant increase in the mean area % of GFAP in both CA3 and DG, compared to the control. In CA3, the insulin-treated (Group III) and Cbl-treated (Group IV) groups showed a non-significant decrease, compared to the diabetic group. However, both groups showed a highly significant increase, compared to the control. The combined insulin and Cbl treatment (Group V) showed a significant decrease, compared to Group II and a significant increase, compared to the control. In DG, the insulin-treated (Group III) and Cbl-treated (Group IV) groups showed a significant decrease in the mean area % of GFAP, compared to Group II and a significant increase, compared to the control. The combined insulin- and Cbl-treated (Group V) group showed a significant decrease, compared to the diabetic group and a significant increase, compared to the control.
Discussion
Diabetes is a chronic metabolic disorder resulting in persistent hyperglycemia. There is an increasing evidence of CNS involvement with DM [Citation2]. Cognitive dysfunction and DM form a parallel phenomenon that is linked to many pathological changes such as alterations in anti-oxidants and induction of inflammatory markers [Citation19].
Streptozotocin (STZ) is an antibiotic that has been commonly used for the induction of diabetes in experimental models of mice and rodents. It was first reported to have diabetogenic effect in 1963, ever since several studies have used it in different combinations for the induction of diabetes [Citation20].
The present study was done to assess the effect of 8-week diabetic condition induced by STZ administration on the histological structure of the hippocampus which is crucial for many cognitive processes, particularly learning and memory in humans and other primates. The possible neuroprotective effect of insulin and Cerebrolysin, separately and combined, was also evaluated.
In the current experiment, animals of the diabetic group showed a highly significant elevation in BGL above 300 mg/dl just before sacrifice. A similar finding has been previously reported [Citation13,Citation19]. Diabetic rats treated with insulin showed a significantly lower BGL than that of the diabetic group. A similar finding was previously demonstrated [Citation21,Citation22]. Streptozotocin enhances cytotoxicity to the pancreatic β-cells by facilitated diffusion via cell membranes and by increasing the production of nitric oxide (NO). This results in reduction of insulin secretion and elevation in BGL [Citation23,Citation24]. Insulin has an anti-hyperglycemic effect by enhancing carbohydrate synthesis and stimulating glucose uptake by cells [Citation25]. The Cerebrolysin-treated group (Group IV) demonstrated a highly significant decrease in BGL as compared to the diabetic group and a highly significant increase as compared to the control. It has been reported that Cbl fails to normalize BGL, but it can increase the expression of glucose transporter (GLUT) in blood–brain barrier (BBB), and thus could improve glucose usage by cells [Citation26].
Diabetic animals showed a highly significant weight loss compared to the control group. This observation has been previously reported [Citation19,Citation22]. However, in comparison, the insulin-treated group (Group III) exhibited a significant weight gain. A similar finding has been reported [Citation21,Citation27]. The authors confirmed that insulin therapy in STZ diabetic rat model causes weight gain. Weight loss in DM may be due to impaired protein metabolism because of protein consumption instead of carbohydrates for energy production [Citation28] or due to inhibition of the uptake of free fatty acids and acceleration of lipolysis in adipose tissues. Insulin has been identified as an anabolic hormone stimulating cell growth, helping storage of fatty acids in adipose and muscle tissues, motivating muscle hypertrophy and inhibiting proteolysis [Citation29]. A study demonstrated that poor glycemic control (HbA1c ≥8.5%) was associated with poor lower-limb muscle strength and physical performance [Citation30].
In the present work, Cbl administration minimized the diabetes-induced weight loss. Animals of the Cbl-treated group (Group IV) exhibited a highly significant increase in body weight compared to the diabetic group. It has been reported that Cbl prevents the elevation in HbA1c% and lowers the inflammatory cytokines, so it just reduces the diabetes associated weight loss, but does not restore normal body weight [Citation31]. The combined insulin- and Cbl-treated (Group V) group showed a significant improvement in both BGL and body weight compared to the diabetic group and a non-significant difference compared to the control. This may be attributed to the potent effect of the two drugs on the BGL and body weight in DM.
In the present work, CA3 region of hippocampus proprius and DG was chosen for the microscopic assessment of H&E and immunohistochemical changes. St.py in control CA3 showed 5–6 layers of large sized, loosely packed pyramidal cells. The same structure has been previously described [Citation32,Citation33]. The GCL of the DG contained 8–9 layers of compactly arranged rounded granule cells. Spindle-shaped immature cells were seen in the SGZ. This description has been previously reported [Citation8,Citation34]. The SGZ is considered as a germinal region containing non-differentiated cells that have the ability to produce glial and nerve cells [Citation35].
Sections of the diabetic group showed degeneration and displacement of pyramidal and granule cells. Areas of cell loss were seen in CA3 and immature cells disappeared from SGZ of DG. This comes in agreement with previous studies [Citation36,Citation37]. The current morphometric analysis of St.py and GCL thickness, as well as the mean number of pyramidal and granule cells in the diabetic group showed a highly significant decrease compared to the control, confirming the microscopic results. Furthermore, the current immunohistochemical study has demonstrated a significantly high number of Bax positive apoptotic cells, confirming the apoptotic changes in both layers.
Diabetes causes progressive degenerative changes which are explained by increased NO secretion that has neurotoxic effects on neurons, as well as decreased anti-oxidants markers [Citation38]. Moreover, hyperglycemia causes oxidative damage, increases expression of mitochondria-specific proteins and opens transition pores in mitochondria. These changes guide the expression of caspase-3 and caspase-8 that play a principal role in cell apoptosis and degeneration [Citation37]. Proliferative neural stem cells (NSCs) maintain high endogenous reactive oxygen species (ROS), but the excess and prolonged increase can inhibit their proliferation and cause cell death. Also, STZ decreases expression of insulin receptors and GLUT-3 in NSCs leading to altered glucose/energy metabolism [Citation39]. This may explain why immature cells in the SGZ of DG disappeared in the diabetic group of the current study.
The immunohistochemical study of the diabetic group in the present work showed significant increases in the mean Q-score of Bax and TNF-α expression as well as the mean area percentage of GFAP immunoreactivity. Similar results were reported [Citation23,Citation40,Citation41]. On the other hand, synaptophysin expression significantly decreased in the diabetic group as previously reported [Citation42].
In addition to mitochondrial changes and expression of caspase-3 and caspase-8 as previously explained [Citation37], diabetic immunohistochemical changes can be correlated to dysregulation of PI3K-Akt (phosphoinositide 3-kinase/protein kinase B) signaling pathway and to increased expression of transcription factor NF-kB (nuclear factor kappa B). STZ reduces the phosphorylated form of AKT, increases the expression of iNOS (inducible nitric oxide synthase) & Nf-kB and decreases pGSK-3β (Glycogen synthase kinase-3 beta) level, leading to apoptosis [Citation19]. TNF-α activity is related to activation of two transcription factors; NF-kB and activating protein-1. Both mediate transcription of pro-inflammatory cytokines [Citation43]. Mammalian target of rapamycin (mTOR) is an essential molecule in the PI3K/AKT and NF-κB signaling pathway. mTOR is increased by hyperglycemia and activates NF-κB leading to synaptic dysfunction [Citation44,Citation45]. Overexpression of GFAP is due to astrogliosis. Astrocytes can perform anti-oxidant function, produce neuroprotective & pro-inflammatory agents and protect the surrounding healthy tissue from the spread of injury and inflammatory cells [Citation46].
Sections of hippocampus and DG in the insulin-treated and Cbl-treated groups (Group III and Group IV, respectively) showed mild improvement compared to the diabetic group. The number of degenerated cells decreased but numerous neuroglial cells were seen. Such changes have been previously documented [Citation21,Citation47]. The authors demonstrated that insulin caused preservation of pyramidal cells and markedly decreased apoptosis in diabetic animals. It was also found that Cbl reverses the dendritic atrophy of neurons caused by STZ injection [Citation48]. In support, statistical analysis of layers’ thickness and number of intact cells in the present work revealed a highly significant increase in Group III and IV compared to the diabetic group.
Insulin is a neuroprotective drug that restores intracellular ATP formation and reduces oxidative stress via stimulating glucose uptake by neurons [Citation49]. Also, it improves antioxidant status by increasing serum levels of catalase, glutathione, and vitamin E [Citation50]. Insulin also improves blood flow by increasing endothelial NO and NO synthase secretion [Citation51]. This may explain the improvement in the microscopic picture of Group III.
Cerebrolysin has the ability to penetrate BBB. Cbl plays an important role in the continuous protection against neurodegeneration via neurotrophic factor and Shh (sonic hedgehog) signaling pathways. Also, neurotrophic and nerve growth factors in its composition promote cell division cycle and act as anti-oxidants [Citation12]. This may explain the microscopic findings in Group IV.
Group III and Group IV showed an improvement in immunohistochemical results. Both groups exhibited decreased Bax & TNF-α expression and decreased GFAP immunoreactivity. Also, both groups demonstrated increased synaptophysin expression, compared to the diabetic group.
Explaining the immunohistochemical results of Group III, it has been reported that insulin and insulin-like growth factor (IGF-1) receptors are major activators of PI3K pathway which activates AKT and, in turn, inhibits glycogen synthase kinase (GSK3-β); thereby the pro-apoptotic signal mediated by GSK3-β is inhibited [Citation11]. Insulin also reduces inflammation via regulating the inflammasome and the innate immunity [Citation51,Citation52]. In addition, insulin regulates metabolism of neurotransmitters and adjusts the sensitivity of post-synaptic receptors [Citation53]. Moreover, insulin modulates the oxidative stress produced in astrocytes via IGF receptors [Citation54].
As regards Cerebrolysin, it has been reported to activate TrKB receptor via brain derived neurotrophic factor (BDNF). TrKB is associated with anti-apoptotic signaling pathways [Citation55]. Moreover, it has been stated that Cbl decreases the gene expression of pro-inflammatory factors and increases the gene expression of anti-inflammatory factors [Citation56]. Also, Cbl has been presumed to activate Shh signaling cascade which is an essential modulator of anti-oxidation and anti-inflammation [Citation12,Citation57]. Furthermore, Cbl has been postulated to increase the expression of synaptic proteins and to promote formation of new synapses [Citation58,Citation59]. The authors also stated that neurotropic drugs enhance and regulate the expression of growth-associated phosphoprotein (GAP43) which is a crucial component of the axon and presynaptic terminals. Moreover, astrocytes migration and proliferation are suggested to be affected by Aquaporin-4 channel, water-selective membrane transport protein, which is regulated by Cbl as it can inhibit its activity [Citation60,Citation61].
Hippocampal sections of the combined insulin- and Cbl-treated group (Group V) were more or less similar to those of the control. Most of the cells appeared intact and very few degenerated cells were seen. Moreover, immature cells reappeared in the SGZ of the DG. Statistical analysis of the thickness of St.py, GCL as well as neuronal cell count demonstrated marked improvement in Group V as both parameters were highly significantly increased compared to the diabetic group, while no significant difference was detected compared to the control. Moreover, the combined treatment with insulin and Cbl in Group V demonstrated a significant improvement in most immunohistochemical parameters that mostly showed a non-significant difference compared to the control. These results indicate the potent neuroprotective effect triggered by the combined administration of both drugs. Thus, the combined use of both insulin and Cbl has the advantage of markedly protecting the hippocampus from the structural and immunohistochemical diabetic changes. This may spark a future therapeutic role of this combination in diabetes-associated cognitive dysfunction.
Conclusion
In light of the results of the present study, it could be concluded that diabetes causes marked neurotoxic effects on the hippocampus which may explain diabetes related cognitive dysfunction. Cerebrolysin is recommended as an adjuvant neuroprotective drug for the management of diabetic neurotoxicity, especially if combined with Insulin.
Disclosure statement
No potential conflict of interest was reported by the author(s).
References
- Rashedinia M, Alimohammadi M, Shalfroushan N, et al. Neuroprotective effect of syringic acid by modulation of oxidative stress and mitochondrial mass in diabetic rats. Bio Med Res Int. 2020;2020:8297984.
- Elgayar S. Protective effect of vitamin B complex in diabetic peripheral neuropathy - Histopathological study. Eur J Anat. 2017;21(3):173–187.
- Chandrakala BS, Kate NN, Kamalakannan V, et al. Effect of hormones on cognitive abilities and skills. National J Physiol Pharm Pharmacol. 2019;9(8):788.
- Karvani M, Simos P, Stavrakaki S, et al. Neurocognitive impairment in type 2 diabetes mellitus. Hormones. 2019;18(4):523–534. DOI:10.1007/s42000-019-00128-2
- Cherubini E, Miles R. The CA3 Region of the Hippocampus: how is it? What is it for? How does it do it? Front Cell Neurosci. 2015;9:4–6.
- Schröder H, Moser N, Huggenberger S. The mouse Hippocampus. Neuroanatomy of the mouse: an introduction. Cham, Sprielgay: Springer International Publishing; 2020. pp. 267–288.
- Abbott LC, Nigussie FJ. Adult neurogenesis in the mammalian dentate gyrus. Anat Histol Embryol. 2020;49(1):3–16.
- Abdel-Aziz H, Ahmed SM, Mohammed MZ, et al. Efficacy of cerebrolysin on dentate gyrus of hippocampus after experimentally induced acute ischemic stroke in adult albino rats (Histological, immunohistochemical and biochemical study). Egypt J Histol. 2019;42(1):229–244. DOI:10.21608/EJH.2018.4314.1013
- Yu L-Y, Pei YJ. Insulin neuroprotection and the mechanisms. Chinese Med J. 2015;128(7):976–981.
- Gabbouj S, Ryhänen S, Marttinen M, et al. Altered insulin signaling in Alzheimer’s disease brain–special emphasis on PI3K-Akt pathway. Front Neurosci. 2019;13:629.
- Ren Z, Zhong H, Song C, et al. Insulin promotes mitochondrial respiration and survival through PI3K/AKT/GSK3 pathway in human embryonic stem cells. Stem Cell Rep. 2020;15(6):1362–1376. DOI:10.1016/j.stemcr.2020.10.008
- Bliźniewska-Kowalska K, Łukasik M, Gałecki P. Cerebrolysin–mechanism of action and application in psychiatry and neurology. Pharmacother Psychiatr Neurol. 2019;35(1):9–23.
- Azad A, Sulaiman W. Antidiabetic effects of P. macrocarpa ethanolic fruit extract in streptozotocin-induced diabetic rats. Future J Pharm Sci. 2020;6:1–12.
- Jarrar YB, Al-Essa L, Kilani A, et al. Alterations in the gene expression of drug and arachidonic acid-metabolizing Cyp450 in the livers of controlled and uncontrolled insulin-dependent diabetic mice. Diabetes Metab Syndr Obesity. 2018;11:483–492.
- Dong HY, Jiang XM, Niu CB, et al. Cerebrolysin improves sciatic nerve dysfunction in a mouse model of diabetic peripheral neuropathy. Neural Regen Res. 2016;11(1):156–162.
- Bancroft JD, Layton C The hematoxylins and eosin. Bancroft’s theory and practice of histological techniques e-book. 8th ed. Suvarna KS, Layton C, Bancroft JD. China: Elsevier Health Sciences. 2018; 126–138
- Sanderson T, Wild G, Cull A, et al. Immunohistochemical and immunofluorescent techniques. Bancroft’s theory and practice of histological techniques e-book. 8th. Suvarna K, Layton C, and Bancroft J. China: Elsevier Health Sciences. 2018; pp. 337–394
- Khushman M, Bhardwaj A, Patel GK, et al. Exosomal Markers (CD63 and CD9) expression pattern using immunohistochemistry in resected malignant and non-malignant pancreatic specimens. Pancreas. 2017;46(6):782–788.
- Bathina S, Das UN. Dysregulation of PI3K-Akt-mTOR pathway in brain of streptozotocin-induced type 2 diabetes mellitus in Wistar rats. Lipids Health Dis. 2018;17(1):1–11.
- Akinlade OM, Owoyele BV, Soladoye AO. Streptozotocin-induced type 1 and 2 diabetes in rodents: a model for studying diabetic cardiac autonomic neuropathy. Afr Health Sci. 2021;21(2):719–727.
- Soleymaninejad M, Joursaraei SG, Feizi F, et al. The effects of lycopene and insulin on histological changes and the expression level of Bcl-2 family genes in the hippocampus of streptozotocin-induced diabetic rats. J Diabetes Res. 2017;2017:1–9.
- Wang Y, Sun H, Zhang J, et al. Streptozotocin-induced diabetic cardiomyopathy in rats: ameliorative effect of PIPERINE via Bcl2, Bax/Bcl2, and caspase-3 pathways. Biosci Biotechnol Biochem. 2020;84(12):2533–2544. DOI:10.1080/09168451.2020.1815170
- Ali AA, Essawy EA, Hamed HS, et al. The ameliorative role of Physalis pubescens L. against neurological impairment associated with streptozotocin induced diabetes in rats. Metab Brain Dis. 2021;36(6):1191–1200.
- Furman BL. Streptozotocin‐induced diabetic models in mice and rats. Curr Protoc Pharmacol. 2021;1(4):e78.
- Ruegsegger GN, Creo AL, Cortes TM, et al. Altered mitochondrial function in insulin-deficient and insulin-resistant states. J Clin Invest. 2018;128(9):3671–3681.
- Gavrilova SI, Alvarez AJ. Cerebrolysin in the therapy of mild cognitive impairment and dementia due to Alzheimer’s disease: 30 years of clinical use. Med Res Rev. 2021;41(5):2775–2803.
- Farshid AA, Tamaddonfard E, Moradi-Arzeloo M, et al. The effects of crocin, insulin and their co-administration on the heart function and pathology in streptozotocin-induced diabetic rats. Avicenna J Phytomed. 2016;6(6):658. DOI:10.22038/ajp.2016.6775
- Tomkin GH, Owens D. Diabetes and dyslipidemia: characterizing lipoprotein metabolism. Diabetes Metab Syndr Obesity. 2017;10:333–343.
- Brown A, Guess N, Dornhorst A, et al. Insulin‐associated weight gain in obese type 2 diabetes mellitus patients: what can be done? Diabetes Obesity Metab. 2017;19(12):1655–1668. DOI:10.1111/dom.13009
- Mesinovic J, Zengin A, De Courten B, et al. Sarcopenia and type 2 diabetes mellitus: a bidirectional relationship. Diabetes Metab Syndr Obesity. 2019;12:1057–1072.
- Georgy GS, Nassar NN, Mansour HA, et al. Cerebrolysin ameliorates cognitive deficits in type III diabetic rats. PLoS ONE. 2013;8(6):e64847. DOI:10.1371/journal.pone.0064847
- Keshvari M, Rahmati M, Mirnasouri R, et al. Effects of endurance exercise and Urtica dioica on the functional, histological and molecular aspects of the hippocampus in STZ-Induced diabetic rats. J Ethnopharmacol. 2020;256:112801.
- Woelfle S, Boeckers TM. Layer-specific vesicular glutamate transporter 1 immunofluorescence levels delineate all layers of the human hippocampus including the Stratum lucidum. Front Cell Neurosci. 2021;15:789903.
- Sinha JK, Aziz A, Ghosh S. Dentate Gyrus. In: Encyclopedia of animal cognition and behavior. Vonk J, and Shackelford T. New York: Cham, Springer International Publishing. 2019; pp. 1–5
- Ghosh HS. Adult neurogenesis and the promise of adult neural stem cells. J Exp Neurosci. 2019;13:1–12.
- Ahmadpour S, Foghi K. The Possible Neurodegeneration of the CA3 and CA1 of Hippocampus in STZ-Induced diabetes mellitus type1 on male wistar rats. J Med Histol. 2021;5(1):41–47.
- Yassa HD, Gergis SW, Hassan DM, et al. Therapeutic role of bone marrow mesenchymal stem cells in diabetic neuronal alternations of rat hippocampus. Folia Morphol (Warsz). 2020;79(2):211–218.
- Shalaby AM, Aboregela AM, Alabiad MA, et al. The effect of induced diabetes mellitus on the cerebellar cortex of adult male rat and the possible protective role of oxymatrine: a histological, immunohistochemical and biochemical study. Ultrastruct Pathol. 2021;45(3):182–196.
- Sun P, Ortega G, Tan Y, et al. Streptozotocin impairs proliferation and differentiation of adult hippocampal neural stem cells in vitro-correlation with alterations in the expression of proteins associated with the insulin system. Front Aging Neurosci. 2018;10:145.
- Chen Y, Guo Z, Mao Y-F, et al. Intranasal insulin ameliorates cerebral hypometabolism, neuronal loss, and astrogliosis in streptozotocin-induced Alzheimer’s rat model. Neurotox Res. 2018;33(4):716–724. DOI:10.1007/s12640-017-9809-7
- Farbood Y, Ghaderi S, Rashno M, et al. Sesamin: a promising protective agent against diabetes-associated cognitive decline in rats. Life Sci. 2019;230:169–177.
- Luo H, Xiang Y, Qu X, et al. Apelin-13 suppresses neuroinflammation against cognitive deficit in a streptozotocin-induced rat model of Alzheimer’s disease through activation of BDNF-TrkB signaling pathway. Front Pharmacol. 2019;10:395.
- Akash MS, Rehman K, Liaqat A. Tumor necrosis factor‐alpha: role in development of insulin resistance and pathogenesis of type 2 diabetes mellitus. J Cell Biochem. 2018;119(1):105–110.
- Wang Q, Hu J, Liu Y, et al. Aerobic exercise improves synaptic-related proteins of diabetic rats by inhibiting FOXO1/NF-κB/NLRP3 inflammatory signaling pathway and ameliorating PI3K/Akt insulin signaling pathway. J Mol Neurosci. 2019;69(1):28–38. DOI:10.1007/s12031-019-01302-2
- Xu T, Liu J, Li X-R, et al. The mTOR/NF-κB pathway mediates neuroinflammation and synaptic plasticity in diabetic encephalopathy. Mol Neurobiol. 2021;58(8):3848–3862. DOI:10.1007/s12035-021-02390-1
- Bylicky MA, Mueller GP, Day RM. Mechanisms of endogenous neuroprotective effects of astrocytes in brain injury. Oxid Med Cell Longevity. 2018;2018:6501031.
- Amin SN, Younan SM, Youssef MF, et al. A histological and functional study on hippocampal formation of normal and diabetic rats. F1000res. 2013;2:151.
- Sanchez‐vega L, Juárez I, De Jesus Gomez‐villalobos M, et al. Cerebrolysin reverses hippocampal neural atrophy in a mice model of diabetes mellitus type 1. Synapse. 2015;69(6):326–335. DOI:10.1002/syn.21819
- Blázquez E, Velázquez E, Hurtado-Carneiro V, et al. Insulin in the brain: its pathophysiological implications for States related with central insulin resistance, type 2 diabetes and Alzheimer’s disease. Front Endocrinol (Lausanne). 2014;5:161.
- Almulathanon AA, Mohammad JA, Allwash TA. Evaluation the effects of insulin on oxidant/antioxidant status in type 1 diabetic patients. Pharmacia. 2021;68:699.
- Dandona P, Ghanim HJ. Diabetes, obesity, COVID-19, insulin, and other antidiabetes drugs. Diabetes Care. 2021;44(9):1929–1933.
- Chang Y-W, Hung L-C, Chen Y-C, et al. Insulin reduces inflammation by regulating the activation of the NLRP3 inflammasome. Front Immunol. 2021;11:3856.
- Gralle M. The neuronal insulin receptor in its environment. J Neurochem. 2017;140(3):359–367.
- Hayes CA, Ashmore BG, Vijayasankar A, et al. Insulin-like growth factor-1 differentially modulates glutamate-induced toxicity and stress in cells of the neurogliovascular unit. Front Aging Neurosci. 2021;13:751304.
- Kang DH, Choi BY, Lee SH, et al. Effects of cerebrolysin on hippocampal neuronal death after pilocarpine-induced seizure. Front Neurosci. 2020;14:568813.
- Guan X, Wang Y, Kai G, et al. Cerebrolysin ameliorates focal cerebral ischemia injury through neuroinflammatory inhibition via CREB/PGC-1α pathway. Front Pharmacol. 2019;10:1245.
- Fiani B, Covarrubias C, Wong A, et al. Cerebrolysin for stroke, neurodegeneration, and traumatic brain injury: review of the literature and outcomes. Neurol Sci. 2021;42(4):1345–1353. DOI:10.1007/s10072-021-05089-2
- Attia TM. Assessment of the role of Cerebrolysin in treatment of idiopathic facial nerve paralysis. Menoufia Med J. 2019;32(2):712.
- Khavinson V, Ilina I, Kraskovskaya N, et al. Neuroprotective effects of tripeptides—epigenetic regulators in mouse model of Alzheimer’s disease. Pharmaceuticals. 2021;14(6):515.
- Catalin B, Rogoveanu O-C, Pirici I, et al. Cerebrolysin and aquaporin 4 inhibition improve pathological and motor recovery after ischemic stroke. CNS & Neurol Disord. 2018;17(4):299–308.
- Liu H, Qiu K, He Q, et al. Mechanisms of blood-brain barrier disruption in herpes simplex encephalitis. J Neuroimmune Pharmacol. 2019;14(2):157–172. DOI:10.1007/s11481-018-9821-6