
ABSTRACT
Thyroidectomy is the gold standard in treating cancer thyroid patients. Thyroidectomy patients are more susceptible to type 2 diabetes mellitus (T2DM) development. T2DM is a major health problem worldwide, due to its chronic associated complications. Diabetic nephropathy (DN) is one of the most detrimental complications. Moreover, thyroidectomy could increase kidney injury incidence and hypothyroidism either clinical or subclinical frequently coincides with T2DM, significantly associated with DN occurrence and severity, however the exact mechanism still unclear and it is the aim of this study to explore the pathogenesis involved in Thyroidectomy mediated nephrotoxicity, besides assessing the therapeutic role of L-thyroxine on nephropathy. Using biochemical and histopathological techniques, glucose homeostasis, lipid profile, kidney architecture, function, transforming growth β1 (TGF- β1), angiotensin II (Ang II) and Endothelin (ET)-1 markers were investigated in type 2 diabetic rats with or without thyroidectomy and after L-thyroxine treatment. Data revealed that thyroidectomy impaired glucose tolerance, adversely affected the lipid profile, induced nephropathy and deteriorated kidney function significantly compared to the control and T2DM groups (proteinuria, 118.5 ± 16.2 versus 10.3 ± 1.6 and 118.5 ± 16.2 versus 102.2 ± 9.2). Moreover, L-thyroxine could ameliorate hyperglycemia, dyslipidemia, renal morphology and function compared to thyroidectomy group (proteinuria 51.1 ± 3.4 versus 118.5 ± 16.2), which was mediated by TGF-β1, Ang II and ET-1. This could be a guide to use L-thyroxine supplementation in thyroidectomy patients, especially if associated with T2DM to avoid or slow down nephropathy development.
Introduction
Thyroid dysfunction is one of the most common health problems worldwide. Thyroidectomy is a common surgery frequently used in treating cancer thyroid patients. Patients with thyroi-dectomy were more susceptible to develop type 2 diabetes mellitus (T2DM) [Citation1].
T2DM is considered one of the most challenging morbidities affecting people of all ethnicities around the globe. The disease burden of T2DM is mainly related to the wide range of chronic complications affecting patients, including neurological, cardiovascular, gastrointestinal and genitourinary complications [Citation2]. Among diabetic complications, diabetic nephropathy (DN) is one of the most harmful complications. About 50.0% of diabetic patients develop DN at some point of their lifetime [Citation3], and the mortality is 30 times higher in diabetic patients with DN in comparison to those without [Citation4].
On the other hand, post-thyroidectomy hypothyroidism might increase acute kidney injury incidence [Citation5]. Moreover, many clinical studies identified a significant association between hypothyroidism and DN development [Citation6,Citation7] and severity [Citation8]. In this context, it was suggested that thyroid hormone replacement may reduce complications in patients with DN [Citation9]. L-thyroxine treatment could reduce oxidative stress and attenuate renal damage in DN patients [Citation10].
DN is the main cause of chronic kidney disease (CKD) worldwide [Citation11], through accumulation of extracellular matrix (ECM) collagen in glomeruli that cause proteinuria and end with renal failure [Citation12]. The Renin–angiotensin–aldosterone system (RAAS) is an important element in CKD pathogenesis. Angiotensin converting enzyme inhibitors or angiotensin II (Ang II) receptor blockers are a target therapy to attenuate proteinuria, control blood pressure and limit CKD progression [Citation13]. High glucose level in DM increases the production of Ang II by renal mesangial cells, which stimulate transforming growth β1 (TGF- β1) secretion, causing increased synthesis and decreased degradation of matrix proteins, causing matrix expansion [Citation14]. Dyslipidemia also noticed to induce the production of ECM in the glomeruli of diabetic patients, causing the development of DN [Citation15]. Ang II is a pro-inflammatory mediator that links to Ang II type 1 receptor and activates renal glomerular, tubular cells and local immune cells to release cytokines, like TGF-β, to regulate inflammatory responses in renal parenchyma [Citation16].
TGF-β1 is a cytokine involved in immunomodulation, angiogenesis and ECM formation. It is expressed by nearly all renal cells and infiltrating leukocytes and macrophages. Activated TGF-β1 signaling pathway involved in DN progression, moreover, TGF-β1 inhibitors ameliorated renal fibrosis in diabetic kidney disease [Citation17].
Endothelin (ET) is composed of 21 amino-acid peptides and is secreted by endothelial cells; it is also an important homeostasis regulator in physiological conditions. ET-1 is a potent vasoconstrictor, it regulates vascular tone in renal and cardiovascular systems [Citation18]. ET-1 exerts its effects through binding to endothelin A receptor and regulates both catecholamines and RAAS [Citation19]. ET-1 synthesis upregulation is observed to be linked to renal stress, vascular inflammation and fibrosis [Citation20]. ET-1 receptor and Ang II type 1 receptor blockers are effective in lowering blood pressure and reducing proteinuria in DN [Citation21].
The exact mechanism behind the relationship between thyroidectomy and nephropathy is still unclear, and it needs more exploration. Whether L-thyroxine could ameliorate kidney function, and whether it’s mediated by TGF-β1, Ang II and/or ET-1 markers also needs more investigations, and it is the aim of the present study to assess the biochemical and histopathological changes in the kidney, its correlation to thyroidectomy in diabetic rat model, and the role of L-thyroxine therapy. For further understanding of thyroidectomy complications on the renal function in T2DM and try to avoid its development. For better understanding of the complications of thyroidectomy on renal function in T2DM and try to prevent it from occurring.
Material & method
Animal study
The present study was conducted in Mansoura experimental research center (MERC), Mansoura Faculty of Medicine, Mansoura, Egypt. The study included 50 male Sprague-Dawley rats aged 8–10 weeks and weighing 200–250 g and were purchased from MERC. During the study period rats lived at room temperature with free access to water in 12:12 light/dark cycle. The duration of the study is about 8 weeks. The animal experiments were conducted according to the guidelines and the principles of laboratory animal care. All rats’ protocols and experimental procedures were approved by the institutional review board (IRB), Faculty of Medicine, Mansoura university (Ref: R.21.02.1188).
Rats were randomly divided into five experimental groups:
Group I (Control group, n = 10): This group included normal rats. They were fed a standard rat diet for 8 weeks and received one intraperitoneal (IP) injection of citrate buffer as a vehicle.
Group II (T2DM group, n = 10): This group was fed high fat (42% lipids, 36% carbohydrates and 22% protein) and high fructose diet (20% fructose in drinking water) for 4 weeks [Citation22], followed by IP single dose (30 mg/kg body weight) of streptozotocin (STZ) injection (100557, MP Biomedicals, LLC, Southern California, USA) freshly dissolved in chilled sodium citrate buffer, pH 4.5 for induction of T2DM. Induction of diabetes was confirmed by assessment of the level of glucose (<300 mg/dl for 2 weeks) via tail vein sampling [Citation23].
Group III (T2DM + Thyroidectomy group, n = 10): Diabetes was induced in this as previously described in group II. After induction of T2DM, these animals were subjected to subtotal thyroidectomy under anesthesia as described elsewhere [Citation24]. Under aseptic conditions, a 2 cm midline horizontal skin incision was made on the neck. Neck muscles were lateralized to expose the trachea to perform subtotal thyroidectomy. 5–0 polypropylene monofilament nonabsorbable sutures were used to close the skin wound.
Group IV (Sham operative group, n = 10): In this group, thyroid glands were exposed without surgical removal.
Group V (T2DM + Thyroidectomy + L-Thyroxine group, n = 10): In this group, induction of T2DM and thyroidectomy were performed as previously described in group III. In addition, animals received IP L-thyroxine (1.5 μg/Kg body weight) daily till the end of study [Citation25].
After 8 weeks and the end of the study, rats were fasted overnight (8–12 hours), then were weighed and sacrificed following anesthesia through intra-peritoneal injection of thiopental sodium in a dose of 120 mg/kg [Citation26]. Then each rat was placed on the dissecting plate, and blood samples were collected through cardiac puncture and kept in tubes for serum sample collection. The serum was separated within 30 min of collection by centrifugation at 1000 rpm for 15 min. The clear serum was separated by a Pasteur pipette and stored in dry sterile tubes at −20°C until used for subsequent biochemical analysis. All plasma samples were assessed for the following parameters: fasting insulin, fasting glucose, lipid profile (cholesterol, triglycerides, HDL and LDL), TSH, T4 and kidney function tests.
Biochemical assessment
Before the end of the study, urine samples were collected through replacing all the rats separately in glass cages for 24-hr as prescribed in [Citation27] for the estimation of urinary creatinine concentration and 24-hr urinary proteins, creatinine and urea by colorimetric determination using biochemical kits (Cat # ab272539 & ab83362, Abcam, Waltham, Massachusetts, USA). Insulin was measured by rat’s insulin Elisa kits (Cat # ERINS, Invitrogen, Waltham, Massachusetts, USA), plasma glucose was measured enzymatically using commercial kits (Cat # EIAGLUC, Invitrogen, Waltham, Massachusetts, USA). Insulin resistance marker (HOMA-IR) was calculated using the formula: (Plasma glucose (mg/dl) multiplied by plasma insulin ng/mL) divided by 405 [Citation28]. Serum cholesterol, triglycerides, HDL & LDL were measured enzymatically using commercial kits (Cat # MAK043, MAK266 & MAK045, Sigma Aldrish, Burlington, Massachusetts, USA). Blood urea nitrogen (BUN) and serum creatinine level were assessed using quantitative assay kits (Cat # ab83362 & ab65340, Abcam, Waltham, Massachusetts, USA). Serum levels of TSH and T4 were determined using Elisa kits (Cat # EHTSH & EIAT4C, Invitrogen, Waltham, Massachusetts, USA). All the manufacturer’s recommendations were followed.
Histopathological assessment
After scarification of animals, both kidneys were removed and washed using saline/heparin mixture. Parts of the kidney were fixed in 10% formalin. Paraffin sections were cut (5 m), stained with H&E for histological assessment using light microscope to confirm nephropathy development in T2DM and thyroidectomy groups. Sections were then blocked with goat serum and immunohistochemically stained with primary antibodies; Ang II (rabbit polyclonal IgG, bs-2132 R, Bioss antibodies, Woburn, Massachusetts, USA), ET-1 (rabbit polyclonal IgG, A18004, ABclonal, Woburn, Massachusetts, USA) and TGF-β1 (rabbit polyclonal IgG, sc-146, Santa Cruz Biotechnology, INC, Dallas, Texas, USA) overnight in the fridge using the recommended concentration following the previously described protocol [Citation29]. Then, washed with buffer and incubated for 2 hr at room temperature with secondary antibodies (goat anti-rabbit IgG conjugated HRP, ab6721, Abcam, Waltham, Massachusetts, USA), then washed again, mounted and examined under Olympus C× 31 light microscope.
Morphometric studies
The area percentage of brown stained Ang II, TGF-β1 and ET-1 immunohistochemically stained sections were calculated from nonoverlapping fields of five stained slides of each group, using the Image J program (National Institute of Health, Bethesda, Maryland, USA). Using images at × 400 magnification saved as JPEG format with a good contrast and consistent DAB and hematoxylin stain. Color deconvolution was used to split colors, and DAB was analyzed, then threshold was applied to select and measure the area of immunohistochemical positivity. The average percentage was calculated, and all data were presented as means ± standard deviation.
Statistical analysis
Statistical analyses were performed using IBM SPSS Statistics for Windows (Corp. Released 2013, Version 23.0. Armonk, New York, USA). The test of normal distribution was Shapiro–Wilk test. Normally distributed data were summarized by mean and standard deviation (sd), and non-normally distributed data were described by median, minimum and maximum. One-way anova and post hoc Tukey test were used to compare normally distributed quantitative variables in different groups. Also, Kruskal–Wallis test with post hoc test were used to compare quantitative data in different groups. Pearson’s correlation coefficient was used to determine the strength and direction of relationship between two variables. The level of significance was considered as 0.05
Results
Biochemical assays
Serum glucose level in different groups
Statistical analysis of the biochemical markers illustrated differences between the groups of the experiment. T2DM-induced group showed a significant elevation in glucose level compared to the control group, and in T2DM + thyroidectomy compared to the T2DM group. The level of glucose was reduced significantly in T2DM, thyroidectomy and L-thyroxine-treated group compared to the T2DM+ thyroidectomy group ().
Table 1. Comparison of biochemical markers among studied groups.
Serum insulin level in different groups
Insulin level elevated also significantly in the T2DM group compared to the control and in T2DM + thyroidectomy compared to the T2DM group. Then it reduced significantly in T2DM, thyroidectomy and L-thyroxine treated-group compared to the T2DM + thyroidectomy groups (). HOMA-IR increased significantly in T2DM compared to the control and in the T2DM + thyroidectomy compared to the T2DM group. It then decreased in T2DM, thyroidectomy and L-thyroxine compared to the T2DM + thyroidectomy group. ().
Lipid profile in different experimental groups
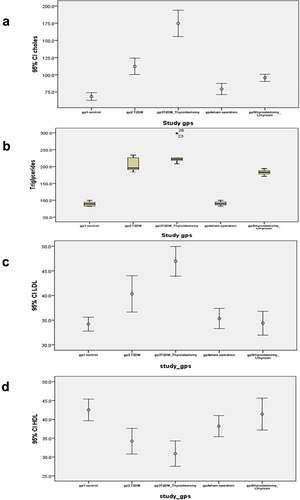
Lipid profile in different experimental groups also demonstrated significant differences. Cholesterol level in the T2DM-induced and in the T2DM + thyroidectomy group demonstrates a significant elevation compared to the control group, and in T2DM + thyroidectomy compared to the T2DM group. However, T2DM, thyroidectomy and L-thyroxine treated group showed significant decrease compared to the T2DM + thyroidectomy group (). Triglyceride level was significantly increased in T2DM and T2DM, thyroidectomy groups compared to the control, and reduced significantly in T2DM, thyroidectomy and L thyroxine compared to the T2DM + thyroidectomy (). LDL level in the T2DM group illustrates a significant increase as compared to control, and T2DM + thyroidectomy compared to the T2DM group. T2DM, thyroidectomy and L thyroxine treated groups showed significant reduction as compared to the T2DM + thyroidectomy (). However, HDL in the T2DM and the T2DM + thyroidectomy groups showed a significant reduction compared to the control. It then elevated significantly in the T2DM, thyroidectomy and L-thyroxine-treated group as compared to the T2DM + thyroidectomy group ().
Figure 1. (a-d) error bar and box plot charts for mean levels of cholesterol, triglycerides, LDL and HDL in different experimental groups. (a) cholesterol level in the T2DM-induced group demonstrates a significant elevation as compared to the control group, and significantly increase in the T2DM + thyroidectomy compared to the T2DM. It then reduced in the T2DM + thyroidectomy + L thyroxine treated group compared to the T2DM + thyroidectomy group. (b) Triglyceride level is significantly increased in T2DM and T2DM + thyroidectomy groups compared to the control. It then reduced significantly in the T2DM, thyroidectomy and L thyroxine compared to the T2DM + thyroidectomy group. (c) LDL level in the T2DM and the T2DM + thyroidectomy groups illustrate a significant increase compared to the control, and the T2DM + thyroidectomy compared to the T2DM. It then reduced significantly in the T2DM, thyroidectomy and L thyroxine treated group as compared to the T2DM + thyroidectomy group. (d) HDL levels in the T2DM and the T2DM + thyroidectomy groups illustrate a significant decrease compared to the control. It then elevated significantly in the T2DM, thyroidectomy and L thyroxine treated group as compared to the T2DM + thyroidectomy group. Parameters are described as mean ±SD and n = 10.
Kidney function in different experimental groups
Kidney function also showed significant changes among the groups. BUN level in the T2DM-induced group demonstrates a significant elevation as compared to the control group. It increased significantly in T2DM + thyroidectomy as compared to the T2DM group. It then reduced significantly in the T2DM, thyroidectomy and L thyroxine group compared to the T2DM + thyroidectomy (). Serum creatinine level showed significant elevation in T2DM compared to the control and reduced significantly in T2DM, thyroidectomy and L-thyroxine-treated group as compared to the T2DM + thyroidectomy (). Urine urea level was significantly decreased in T2DM group as compared to control, and in T2DM + thyroidectomy compared to the T2DM group, and increased significantly in T2DM, thyroidectomy and L thyroxine treated group compared to the T2DM + thyroidectomy (). Urine protein increased significantly in T2DM compared to the control, and in T2DM + thyroidectomy compared to the T2DM group. Then it decreased significantly in T2DM, thyroidectomy and L thyroxine compared to the T2DM + thyroidectomy (). Urine creatinine level in T2DM group illustrates a significant reduction compared to control group, and in T2DM + thyroidectomy as compared to the T2DM group, and increased significantly in T2DM, thyroidectomy and L-thyroxine-treated group compared to the T2DM + thyroidectomy ().
Table 2. Comparison of biochemical renal markers among studied groups.
Histopathological studies
Histological examination
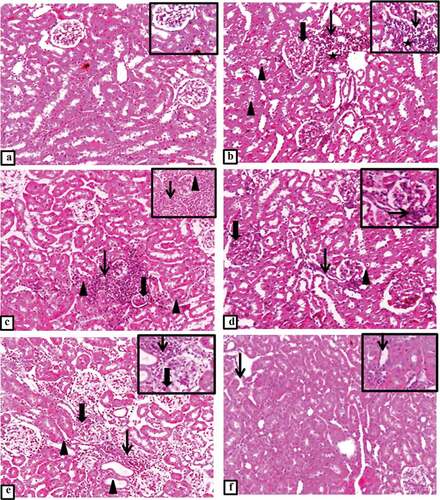
H&E-stained sections of controlled rats’ kidney demonstrated normal histological appearance of renal parenchyma, glomerulus and tubules (). T2DM group showed mild glomerular mesangial thickening with periglomerular aggregation of cellular lymphocytic infiltration and vacuolated atrophied necrotic tubules (). T2DM + thyroidectomy group illustrated multifocal expanded and atrophied glomerulus, tubular hyalinization, degeneration and necrosis beside massive interstitial inflammatory aggregation and thickened bowman’s capsule. Together with hyalinized and thickened glomerular capillaries, reduction of uriniferous space, periglomerular inflammation, sclerosis with interstitial fibrosis and tubular degeneration, indicating the development of renal nephropathy (). The operative sham group showed glomerular expansion with minimal uriniferous space and interstitial inflammation admixed with few fibroblasts surrounding necrotic and ectatic tubules, and mesangial expansion with periglomerular aggregations of lymphocytes, macrophages and fibroblasts (). T2DM + thyroidectomy + L-thyroxine group demonstrated restoration of most renal architecture with occasional interstitial inflammation with few ectatic tubules ().
Figure 2. (a-f) Representative photomicrograph of the kidney from different experimental groups. a) control group shows normal histological appearance of renal parenchyma with normal glomerulus and tubules. Inset demonstrates normal histological appearance of renal tubules. b) T2DM group shows mild glomerular mesangial thickening (thick arrow) with periglomerular aggregation of cellular infiltrates (thin arrow), some tubules appear vacuolated (arrowheads), atrophied necrotic tubules (star). Inset illustrates numerous lymphocytes (thin arrow) surrounding a necrotic tubule with pyknotic nucleus (star). c) T2DM + thyroidectomy group shows multifocal expanded and atrophied glomerulus (thick arrow) with tubular hyalinization, degeneration and necrosis (arrowheads) beside massive interstitial inflammatory aggregates (thin arrow). Inset demonstrates thickened bowman’s capsule (arrowhead) with hyalinized and thickened glomerular capillaries, reduction of uriniferous space and extensive interstitial aggregation of numerous macrophages (thin arrow). d) T2DM + thyroidectomy group demonstrates glomerular mesangial expansion (thick arrow), periglomerular inflammation with interstitial fibrosis (thin arrow) and tubular degeneration (arrowhead). Inset at higher magnification shows periglomerular sclerosis (thin arrow). e) operative sham group shows glomerular expansion (thick arrow) with minimal uriniferous space and interstitial inflammation admixed with few fibroblasts (thin arrow) surrounding a necrotic and ectatic tubules (arrowheads). Inset illustrates mesangial expansion (thickarrow) with periglomerular aggregations of lymphocytes, macrophages and fibroblasts (thin arrow). f) T2DM + thyroidectomy + L-thyroxine group demonstrates restoration of most renal architecture with occasional interstitial inflammation (thin arrow). Inset shows few ectatic tubules (thin arrow). Image magnification = 100×, inset = 400×.
Immunohistochemistry (IHC) of TGF-β1
Expression of TGF-β1 in cortical and medullary regions revealed few expressions of TGF-β1, especially in cytoplasm of some interstitial cells such as fibroblasts and macrophages in the control group (). However, intense glomerular expression of TGF-β1, and interstitially in the cytoplasm of many cells including macrophages and fibroblasts of medullary tubules were observed in the T2DM group (). While T2DM + thyroidectomy group showed markedly intense TGF-β1 glomerular and tubular expression with cytoplasmic positivity in medullary interstitium and intense large positive globules accumulation, mostly fibroblasts in a region of inflammatory aggregation (). The operative sham group cortical and medullary section demonstrated a few cortical expressions with faint medullary tubular epithelial cytoplasmic expression (). The group of T2DM + thyroidectomy + L-thyroxine showed no expression in cortical tubules and minimum expression in glomerular mesangial cells with few positive cells in medullary interstitial cells (). Statistical analysis indicates significant differences in TGF-β1 expression among experimental groups. In the T2DM and the T2DM + thyroidectomy groups, there was a significant elevation in TGF-β1 area percentage compared to control and in the T2DM + thyroidectomy as compared to the T2DM group. However, it reduced significantly in T2DM, thyroidectomy and L-thyroxine treated groups compared to the T2DM + thyroidectomy group ().
Figure 3. (a-i) Representative photomicrographs of immunostaining expression and localization of TGF-β1 in different treatment groups. a) control group in cortical regions shows positive expression in glomerular (thick arrow), tubulointerstitial cells (thin arrow), and in medullary regions b) illustrates few positivity in medullary interstitial cells (thin arrow). c) T2DM shows intense glomerular expression (thick arrow), tubular expression (arrowhead), marked expression in interstitial medullary aggregations of macrophages (thin arrow) in D. e) T2DM + thyriodectomy illustrates intense TGF-β1 glomerular expression (thin arrow), tubular epithelium (arrowhead), and in f) it reveals increased expression in medullary interstitium (thin arrow) and intense large inflammatory aggregates (thin arrow). g&h) representative cortical and medullary section from the operative sham group demonstrates few expressions in cortical tubulointerstitium (thin arrow), faint cytoplasmic expression in medullary tubular epithelium (arrowhead). I&J) represent cortical and medullary sections from T2DM + thyroidectomy + L-thyroxine, shows no expression in cortical tubules and minimal expression in glomerular mesangial cells (thick arrow) with few positivity in medullary interstitial cells (thin arrow). Image magnification = 400×, scale bar = 50 µm.
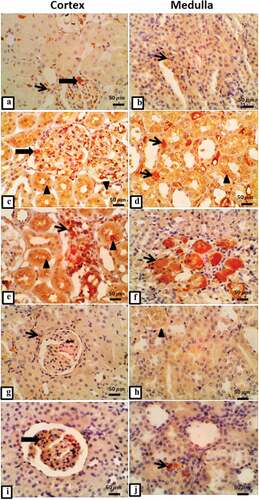
Table 3. Histopathological markers among studied groups.
Immunohistochemistry of Angiotensin II
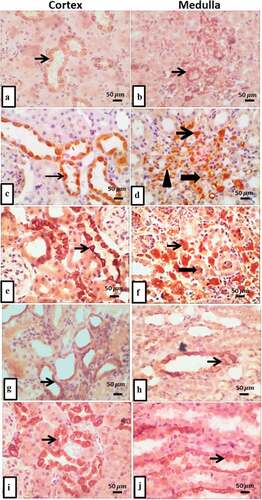
IHC expression of Ang II in the kidney of different experimental groups demonstrated change in the intensity of the stained. In control group, there was mild tubular and medullary Ang II expression () while diabetic nephropathy group revealed strong immuno-stained in tubular cytoplasmic, interstitial inflammatory, endothelial cells of interstitial capillaries, and moderate expression in intraluminal and medullary cytoplasm of tubules (). T2DM with thyroidectomy group, revealed intense tubular expression of Ang II and overexpression in medullary interstitium and intralumin (). The operative sham group was moderately stained in cortical tubular epithelial cells cytoplasm and in medullary tubular and interstitium (). T2DM + thyroidectomy + L-thyroxine group demonstrated moderate cytoplasmic Ang II expression with moderate expression in medullary tubular and interstitium (). The statistical analysis of the percentage of stained areas illustrated significant differences in angiotensin expression among various experimental groups. There was significant upregulation in T2DM and in the T2DM + thyroidectomy groups compared to the control. However, and in T2DM + thyroidectomy as compared to the T2DM group. However, it reduced significantly after treatment with L-thyroxine compared to the T2DM + thyroidectomy group ().
Figure 4. (a-j) Representative IHC expression of angiotensin II in renal cortical and medullary area of rat in different treated groups. a) control group demonstrates mild tubular Ang II expression (thin arrow), and b) shows mild expression in medullary tubule. c) T2DM group renal cortical regions shows intense positive immuno-stained Ang II in cytoplasm of tubular epithelium (thin arrow), and d) it shows intense Ang II expression in interstitial inflammatory cells (thin arrow), endothelial cells of interstitial capillaries (arrowhead) with moderate expression in intraluminal tubules and cytoplasm of medullary tubules (thick arrow). e) T2DM + thyroidectomy reveals strong tubular expression, and in f) it shows overexpression in medullary interstitium (thin arrow) and intraluminal (thick arrow). g) operative sham group shows moderate expression in medullary tubular and interstitium, and H) shows moderate cytoplasmic expression in cortical tubular epithelial cells (thin arrow). i) T2DM + thyroidectomy + L thyroxine demonstrates moderate cytoplasmic angiotensin expression, and J) shows moderate expression in medullary tubular and interstitium. Image magnification = 400×, scale bar = 50 µm.
Immunohistochemistry of ET-1
Localization of ET-1 immuno-positive staining in renal cortical and medullary areas of rat in different treated groups. The control group showed a few ET-1 positive cells in cortical tubular epithelium and medullary interstitium (). The T2DM group indicated intense expression of ET-1 in glomerular capillaries, mesangial cells, interstitial macrophages, and lymphocytes with increased expression in cytoplasm and lumen of medullary tubules, interstitial cells and capillaries (). T2DM with thyroidectomy group revealed strong glomerular mesangial and epithelial cells expression of ET-1 with overexpression in medullary tubulo-interstitium (). Moderate expression in tubular epithelial cells and medullary interstitium was demonstrated in the operative sham group (). T2DM + thyroidectomy + L-thyroxine showed moderate intraluminal and medullary interstitium expression of ET-1 (). Statistical study of ET-1stained area percentage illustrated significant differences in ET-1 expression between the T2DM and the T2DM + thyroidectomy groups versus the control. T2DM + thyroidectomy + L-thyroxine group, on the other hand, showed downregulation compared to the T2DM + thyroidectomy group (). There was also a correlation between the histopathological area percentage and the biochemical markers among different experimental groups ().
Figure 5. (a-j) Micrographs represent IHC expression of ET-1 in renal cortical and medullary areas in different treated groups. a) control group demonstrates few expressions in cortical tubular epithelium, and b) it reveals faint expression in tubulo-interstitium. c) T2DM shows intense expression of ET-1 in glomerular capillary (thin blue arrow), increased expression in mesangial cells (blue arrowhead), interstitial macrophages and lymphocytes (arrow heads), and in d) it shows intense expression of ET-1 in cytoplasm and lumen of medullary tubules with mild expression in interstitial cells and capillaries. e) T2DM + thyroidectomy demonstrates strong glomerular mesangial and epithelial cells expression of ET-1 (thin arrow), and in f) it shows overexpression of medullary tubulo-interstitium. g) operative sham group shows moderate expression in tubular epithelial cells, and H) shows moderate expression in medullary tubulointerstitium. i) T2DM + thyroidectomy + L-thyroxine shows moderate intraluminal expression of ET-1., and J) shows moderate expression in medullary interstitium. Image magnification = 400×, scale bar = 50 µm.
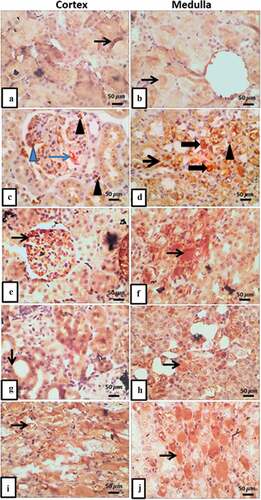
Table 4. Correlation between biochemical markers and histopathological markers among studied groups.
Discussion
In this study, we explored the effect of thyroidectomy on kidney morphology and function in the T2DM rats’ model and the mechanisms involved in the pathogenesis. The effect of L-thyroxine administration on T2DM-induced rats with thyroidectomy was also investigated, as well as its potential role in improving renal function using biochemical, histological and immunohistochemical techniques. The data revealed that thyroidectomy in T2DM-induced rats impaired glucose tolerance, adversely affected the lipid profile, induced nephropathy and deteriorated kidney function. However, the treatment with L-thyroxine improved the glucose, lipids, renal architecture and function. Histological studies illustrated glomerular hypertrophy, tubular degeneration, bowman’s capsule thickening and hyalinization, indicated the development of nephropathy in T2DM with thyroidectomy, which was corrected after the treatment with L-thyroxine. STZ induced DN was confirmed histologically by localization of tubular degeneration and hyaline cast deposition [Citation30]. Immunohistochemical studies demonstrated upregulation in TGF- β1, Ang II, and ET-1 markers in T2DM with thyroidectomy as compared with the control group, which was reversed after the treatment with L-thyroxine. TGF- β1 cytokine is increased in diabetic animals’ glomeruli, and its blockage was associated with attenuation of matrix accumulation and high glucose induced DN [Citation31]. T2DM and T2DM with thyroidectomy groups in our study demonstrated statistically significant elevation in the level of TGF- β1 cytokine expression in renal tissue as compared with the control group. It was also upregulated significantly in the T2DM with thyroidectomy compared to the T2DM group. It was then reversed after the administration of L-thyroxine, where the level of TGF- β1 was significantly downregulated as compared with the T2DM + thyroidectomy group. This was concomitant with the impairment of the kidney function associated with T2DM and T2DM + thyroidectomy, where BUN, serum creatinine, urine urea, urine protein, and urine creatinine were statistically elevated in the T2DM and T2DM + thyroidectomy groups as compared to the control group, indicating the renal impairment associated with both the T2DM and the T2DM + thyroidectomy groups. Moreover, BUN, urine urea, urine protein, and urine creatinine were statistically higher in the T2DM + thyroidectomy compared to the T2DM group, indicating the deteriorating effect of thyroidectomy on the renal function in T2DM model. Then, there was improvement after the administration of L-thyroxine. In a previous study, TGF-β1 signaling pathway demonstrated a significant association with DN and it is also a therapeutic target [Citation32]. This supported our hypothesis that thyroidectomy is associated with aggravation of nephropathy, L-thyroxine could mitigate the renal impairment and TGF- β1 is playing a role in this pathogenesis.
Moreover, the effects of glucose on matrix metabolism may be moderated by TGF- β1, as high glucose level resulted in increase of TGF- β1 mRNA secreted by mesangial cells, and collagen synthesis, which could be inhibited by anti-TGF- β1 antibody [Citation33]. In the current study, the level of glucose, insulin, and insulin resistance marker (HOMA-IR) illustrated a significant increase in the T2DM + thyroidectomy as compared to the control and the T2DM groups. This was concomitant with the significant increase in TGF- β1 expression in the glomerular and interstitial renal tissue. The reverse took place after treatment with L-thyroxine, this could emphasize the role of insulin resistance and TGF- β1 pathway in thyroidectomy mediated renal impairment in T2DM. In other studies, hypothyroidism caused impairment of glucose absorption from the gastrointestinal tract by reducing its motility, delayed gluconeogenesis, and lead to insulin resistance [Citation34]. On the other hand, thyroid hormone treatment improved glucose homeostasis in diabetic rats by decreasing hepatic glucose production and renal reabsorption [Citation35].
Moreover, Ang II expression revealed a significant upregulation in the T2DM and the T2DM + thyroidectomy groups as compared to the control in our study. Then it was downregulated after L-thyroxine treatment, also suggesting its role in renal impairment pathogenesis. Other studies showed that glucose effect on renal cells may also be modulated by increased Ang II production, which causes TGF- β1 mediated matrix production increase and decrease its degradation. Ang II could contribute to DN, it can induce cytokine secretion and matrix accumulation in renal cells [Citation32]. Our study also suggested the involvement of high glucose level, induced TGF- β1 secretion and increased Ang II production in the pathogenesis of renal impairment associated with thyroidectomy in diabetic rats and the improvement after L-thyroxine therapy.
This study also demonstrated adverse effects on the lipid profile, where cholesterol, triglycerides and LDL levels were significantly elevated in T2DM, T2DM + thyroidectomy groups as compared to the control and T2DM + thyroidectomy compared to T2DM, which was improved after L-thyroxine treatment. Moreover, TSH demonstrated a significant elevation in the T2DM + thyroidectomy group as compared to the control and the T2DM groups. T4 also showed a significant reduction in the T2DM + thyroidectomy group as compared to the control and the T2DM groups, and these changes were reversed after treatment with L-thyroxine. Previous studies have shown that patients with hypothyroidism illustrated dyslipidemia and insulin resistance by higher cholesterol, triglyceride, LDL, and HOMA-IR levels compared to the controls. TSH and HOMA-IR levels also demonstrated a significantly positive correlation in the hypothyroidism group [Citation36]. This improved with the treatment of hypothyroidism and demonstrated improvement in insulin sensitivity [Citation37]. Dyslipidemia was also shown to be involved in DN development [Citation38]. Moreover, the lipid lowering medications improved glomerulosclerosis in diabetic model with dyslipidemia [Citation39]. All the data supported the association between thyroidectomy, insulin resistance, dyslipidemia, and nephrotoxicity. Moreover, it also supported the role of L-thyroxine treatment in improving glucose homeostasis, lipid profile and subsequently the renal function.
ET-1 is a strong vasoconstrictor, regulates renal hemodynamics, acid–base balance, salt and water homeostasis, modulates cell proliferation, ECM accumulation, inflammation, and fibrosis, and its expression is elevated in diabetic kidney [Citation40]. ET-1 in our study illustrated a significant upregulation in its expression in the renal parenchyma in the T2DM and the T2DM + thyroidectomy groups as compared to the control, then it was significantly downregulated after the administration of L-thyroxine, suggesting its role in pathogenesis of nephropathy in thyroidectomized T2DM-induced rats. Renal ET-1 production in DN is induced by hyperglycemia as shown in previous study [Citation41]. All the data support the hypothesis that TGF- β1, Ang II and ET-1 markers are involved in the pathogenesis of renal impairment induced by T2DM and aggravated by thyroidectomy. This could be triggered by hyperglycemia, increased insulin resistance and dyslipidemia associated with thyroidectomy and improved with L-thyroxine treatment.
Our data present in vivo evidence of the association between thyroidectomy in T2DM and the deterioration of renal function and the involvement of TGF- β1, Ang II and ET-1 markers in the pathogenesis. The therapeutic role of L-thyroxine through downregulation of TGF- β1, Ang II and ET-1 expression is also an important finding. More future studies will concentrate on validation of the results with various techniques like gene expression and western blotting. Blocking of TGF- β1, Ang II and ET-1 legends will add more confirmation of its involvement in T2DM-induced nephrotoxicity in type 2 diabetic thyroidectomized rats and L-thyroxine as a potential therapy pathogenesis.
Conclusion
This experimental study provides biochemical and histopathological evidence of the role of thyroidectomy associated with T2DM in nephropathy pathogenesis through upregulation of TGF- β1, Ang II and ET-1 expression. In addition, it anticipates the role of L-thyroxine therapy in improving renal function. This could be a guide to use L-thyroxine medication in thyroidectomy patients, especially if associated with T2DM to slow down the development of nephropathy.
Author’s contributions
ZE and NE planned the research design, carried out lab experiments and data collection. SE was assigned to the surgical procedure and the animal manipulation. ZE conducted biochemical analyses. The histopathological evaluations and statistical analysis were carried out by NE. NE and ZE were responsible for the results interpretation. The manuscript was written by NE and was revised by ZE, SG, and HM.
Ethical approval
The animal experiments were carried out according to the guidelines and the principles of laboratory animal care. All rats’ protocols and experimental procedures were authorized by the institutional review board (IRB), Faculty of Medicine, Mansoura university (Ref: R.21.02.1188).
Acknowledgments
The authors are grateful to the Medical Experimental Research Center (MERC) Staff, Medical School, Mansoura University, for their sincere advice and kind help.
Disclosure statement
No potential conflict of interest was reported by the author(s).
Additional information
Funding
References
- Roh E, Noh E, Hwang SY, et al. Increased risk of type 2 Diabetes in patients with thyroid cancer after thyroidectomy: a nationwide cohort study. J Clin Endocrinol Metab. 2022;107:E1047–56. doi: 10.1210/CLINEM/DGAB776
- Lotfy M, Adeghate J, Kalasz H, et al. Chronic complications of Diabetes mellitus: a mini review. Curr Diabetes Rev. 2017;13:3–10. doi: 10.2174/1573399812666151016101622
- Selby NM, Taal MW. An updated overview of diabetic nephropathy: diagnosis, prognosis, treatment goals and latest guidelines. Diab Obes Metab. 2020;22(1):3–15. doi: 10.1111/DOM.14007
- Sagoo MK, Gnudi L. Diabetic nephropathy: an overview. Methods Mol Biol. 2020;2067:3–7. doi: 10.1007/978-1-4939-9841-8_1
- Joo EY, Kim YJ, Go Y, et al. Relationship between perioperative thyroid function and acute kidney injury after thyroidectomy. Sci Rep. 2018;8:13539. doi: 10.1038/S41598-018-31946-W
- Talwalkar P, Deshmukh V, Bhole M. Prevalence of hypothyroidism in patients with type 2 diabetes mellitus and hypertension in India: a cross-sectional observational study. Diabetes Metab Syndr Obes. 2019;12:369–376. doi: 10.2147/DMSO.S181470
- Zhao W, Li X, Liu X, et al. Thyroid function in patients with type 2 Diabetes mellitus and diabetic nephropathy: a single center study. J Thyroid Res. 2018;2018:1–7. doi: 10.1155/2018/9507028
- Han Q, Zhang J, Wang Y, et al. Thyroid hormones and diabetic nephropathy: an essential relationship to recognize. Nephrology (Carlton). 2019;24:160–169. doi: 10.1111/NEP.13388
- Seo C, Kim S, Lee M, et al. THYROID HORMONE REPLACEMENT REDUCES the RISK of CARDIOVASCULAR DISEASES in DIABETIC NEPHROPATHY PATIENTS with SUBCLINICAL HYPOTHYROIDISM. Endocr Pract. 2018;24:265–272. doi: 10.4158/EP-2017-0017
- Chen Y, Wu G, Xu M. The effect of l-thyroxine substitution on oxidative stress in early-stage diabetic nephropathy patients with subclinical hypothyroidism: a randomized double-blind and placebo-controlled study. Int Urol Nephrol. 2017;50:97–103. doi: 10.1007/S11255-017-1756-Y
- Egido J, Rojas-Rivera J, Mas S, et al. Atrasentan for the treatment of diabetic nephropathy. Expert Opin Investig Drugs. 2017;26:741–750. doi: 10.1080/13543784.2017.1325872
- Kim Y, Kleppel MM, Butkowski R, et al. Differential expression of basement membrane collagen chains in diabetic nephropathy. Am J Pathol. 1991;138:413.
- Fernandez-Fernandez B, Ortiz A, Gomez-Guerrero C, et al. Therapeutic approaches to diabetic nephropathy–beyond the RAS. Nat Rev Nephrol. 2014;10:325–346. doi: 10.1038/NRNEPH.2014.74
- Leehey DJ, Singh AK, Alavi N, et al. Role of angiotensin II in diabetic nephropathy. Kidney Int Suppl. 2000;58:S93–8. doi: 10.1046/j.1523-1755.2000.07715.x
- Su W, Cao R, He YC, et al. Crosstalk of hyperglycemia and dyslipidemia in diabetic kidney disease. Kidney Diseases. 2017;3:171. doi: 10.1159/000479874
- Zhang F, Ren X, Zhao M, et al. Angiotensin-(1–7) abrogates angiotensin II-induced proliferation, migration and inflammation in VSMCs through inactivation of ROS-mediated PI3K/Akt and MAPK/ERK signaling pathways. Sci Rep. 2016;6:1–11. doi: 10.1038/srep34621
- Zhao L, Zou Y, Liu F. Transforming growth factor-beta1 in diabetic kidney disease. Front Cell Dev Biol. 2020;8:187. doi: 10.3389/FCELL.2020.00187
- Yanagisawa M, Kurihara H, Kimura S, et al. A novel potent vasoconstrictor peptide produced by vascular endothelial cells. Nature. 1988;332:411–415. doi: 10.1038/332411A0
- Kohan DE, Rossi NF, Inscho EW, et al. Regulation of blood pressure and salt homeostasis by endothelin. Physiol Rev. 2011;91:1–77. doi: 10.1152/PHYSREV.00060.2009
- Amiri F, Paradis P, Reudelhuber TL, et al. Vascular inflammation in absence of blood pressure elevation in transgenic murine model overexpressing endothelin-1 in endothelial cells. J Hypertens. 2008;26:1102–1109. doi: 10.1097/HJH.0B013E3282FC2184
- Zhang L, Xue S, Hou J, et al. Endothelin receptor antagonists for the treatment of diabetic nephropathy: a meta-analysis and systematic review. World J Diabetes. 2020;11:553–566. doi: 10.4239/WJD.V11.I11.553
- Charbonneau A, Unson CG, Lavoie JM. High-fat diet-induced hepatic steatosis reduces glucagon receptor content in rat hepatocytes: potential interaction with acute exercise. J Physiol. 2007;579:255. doi: 10.1113/JPHYSIOL.2006.121954
- Lee JJ, Yi HY, Yang JW, et al. Characterization of streptozotocin-induced diabetic rats and pharmacodynamics of insulin formulations. Biosci Biotechnol Biochem. 2003;67:2396–2401. doi: 10.1271/BBB.67.2396
- Cimen S, AK CS, SM CT. Impact of Polyethylene Glycol and Dextran 70 treatment on Adhesion Formation after subtotal thyroidectomy. Int J Surg Res. 2013;2:8–12. doi: 10.5923/j.surgery.20130202.02
- Jin J, Allemang MT, McHenry CR. Levothyroxine replacement dosage determination after thyroidectomy. Am J Surg. 2013;205:360–364. doi: 10.1016/J.AMJSURG.2012.10.015
- Waynforth HB, Flecknell PA. Experimental and surgical technique in the rat. Scientific Library. 1992;382. QY 58 .W3591.
- Brzóska MM, Moniuszko-Jakoniuk J, Piłat-Marcinkiewicz B, et al. Liver and kidney function and histology in rats exposed to cadmium and ethanol. Alcohol Alcohol. 2003;38:2–10. doi: 10.1093/ALCALC/AGG006
- Roza NAV, Possignolo LF, Palanch AC, et al. Effect of long-term high-fat diet intake on peripheral insulin sensibility, blood pressure, and renal function in female rats. Food Nutr Res. 2016;60:60. doi: 10.3402/FNR.V60.28536
- Ebrahim NA, Leach L. Transendothelial migration of human umbilical mesenchymal stem cells across uterine endothelial monolayers: junctional dynamics and putative mechanisms. Placenta. 2016;48:87–98. doi: 10.1016/J.PLACENTA.2016.10.014
- Kengkoom K, Angkhasirisap W, Kanjanapruthipong T, et al. Streptozotocin induces alpha-2u globulin nephropathy in male rats during diabetic kidney disease. BMC Vet Res. 2021;17:1–9. doi: 10.1186/s12917-021-02814-z
- Russo LM, Del Re E, Brown D, et al. Evidence for a role of transforming growth factor (TGF)-beta1 in the induction of postglomerular albuminuria in diabetic nephropathy: amelioration by soluble TGF-beta type II receptor. Diabetes. 2007;56:380–388. doi: 10.2337/DB06-1018
- Wang L, Wang H, Lan H. TGF-β signaling in diabetic nephropathy: an update. Diabetic Nephropathy. 2022;2:7–16. doi: 10.2478/DINE-2022-0011
- Meng XM, Huang XR, Chung ACK, et al. Smad2 protects against TGF-beta/Smad3-mediated renal fibrosis. J Am Soc Nephrol. 2010;21:1477–1487. doi: 10.1681/ASN.2009121244
- Duntas LH, Orgiazzi J, Brabant G. The interface between thyroid and diabetes mellitus. Clin Endocrinol (Oxf). 2011;75:1–9. doi: 10.1111/J.1365-2265.2011.04029.X
- Teixeira SD, Panveloski‐Costa AC, Carvalho A, et al. Thyroid hormone treatment decreases hepatic glucose production and renal reabsorption of glucose in alloxan-induced diabetic Wistar rats. Physiol Rep. 2016;4:e12961. doi: 10.14814/PHY2.12961
- Ahmed OM, Gabar MA, Ali TM. Impacts of the coexistence of diabetes and hypothyroidism on body weight gain, leptin and various metabolic aspects in albino rats. J Diabetes Complications. 2012;26:491–500. doi: 10.1016/J.JDIACOMP.2012.05.021
- Eom YS, Wilson JR, Bernet VJ. Links between thyroid disorders and glucose homeostasis. Diabetes Metab J. 2022;46:239–256. doi: 10.4093/DMJ.2022.0013
- Kawanami D, Matoba K, Utsunomiya K. Dyslipidemia in diabetic nephropathy. Ren Replace Ther. 2016;2:1–9. doi: 10.1186/S41100-016-0028-0
- Kasiske BL, O’Donnell MP, Cleary MP, et al. Treatment of hyperlipidemia reduces glomerular injury in obese Zucker rats. Kidney Int. 1988;33:667–672. doi: 10.1038/KI.1988.51
- Mahtal N, Lenoir O, Tharaux PL. Glomerular endothelial cell crosstalk with podocytes in diabetic kidney disease. Front Med. 2021; 8. doi: 10.3389/FMED.2021.659013
- Yamauchi T, Ohnaka K, Takayanagi R, et al. Enhanced secretion of endothelin-1 by elevated glucose levels from cultured bovine aortic endothelial cells. FEBS Lett. 1990;267:16–18. doi: 10.1016/0014-5793(90)80276-O