
ABSTRACT
Hepatic encephalopathy (HE) is a severe medical illness often associatedwith liver cirrhosis and characterized by personality changes, intellectual impairment, and decreased consciousness. The exact pathophysiology of HE is debated, but it generally involves neurotoxins, decreased neurotransmission, systemic inflammation, and altered brain energy utilization. The goal of this study is to find out the protective effect of selenium (Se) supplements on the brains of rats with chronic extrahepatic cholestasis caused by bile duct ligation. Thirty albino rats were divided into three groups. Group I: Sham-operated control; group II: bile duct-ligated rats (BDL); and group III: bile duct-ligated rats protected with selenium (BDL-Se), receiving 100 µg/kg/day of selenium orally for six weeks. Following the experimental period, histological and biochemical analyses of liver and brain tissues were performed after sacrifice. Results elucidated that selenium refuced oxidative stress in the brain, indicated by a reduced level of brain malondialdehyde (MDA), an increased level of brain reduced glutathione (GSH), decreased collagen deposition, as well as the intensity of inflammatory infiltrate in liver tissue, the absence of ruptured blood vessels, and degenerated neurons in brain tissue. Additionally, selenium exhibited an anti-inflammatory role by lowering the brain levels of interleukin-1β (IL-1β) and the c-fos gene.
Introduction
Liver cirrhosis is a chronic illness that is typically caused by hepatitis C or excessive alcohol consumption. It is characterized by the formation of regenerating nodules surrounded by fibrous tissue in response to liver damage [Citation1–3]. Hepatic encephalopathy is a primary consequence of liver cirrhosis. Neurological changes in hepatic encephalopathy are believed to stem from declining liver function, resulting in a decrease in the detoxification of ammonium (NH4+) and other chemicals that can enter the brain. HE exhibits a severe and progressive condition characterized by a range of mental abnormalities and motor problems that occur suddenly with the beginning of severe liver dysfunction [Citation4]. It is frequently observed in individuals with advanced liver cirrhosis due to substantial portosystemic shunting and severe hepatocellular dysfunction [Citation5]. Despite the incomplete understanding of the molecular mechanisms causing HE, reports suggest that the complex metabolic processes leading to the neurological symptoms of HE involve NH4+ and glutamine (Gln). Astrocytes in the central nervous system (CNS) are primarily responsible for synthesizing glutamine through glutamine synthetase activity [Citation6]. When the liver doesn’t work right or there is portosystemic shunting, more NH4+ is sent to the brain, which raises the levels of astrocytic Gln. This raises intracellular osmotic pressure, resulting in astrocyte swelling and cytotoxic brain edema [Citation7,Citation8]. Moreover, elevated astrocytic Gln levels may cause the mitochondrial permeability transition pore to become activated and interfere with glutamatergic neurotransmission [Citation9]. NH4+ neurotoxicity involves oxidative and nitrosative stress, mitochondrial dysfunction, modification of cell signaling, neuroinflammation, and changes in neuronal process growth [Citation10,Citation11]. Numerous investigations used brain c-fos expression analysis to understand the neurobiological changes induced in BDL animals. The c-fos gene is classified as an immediate-early gene that is quickly activated by external stimuli and produces proteins essential for subsequent cellular processes [Citation12]. The c-fos gene encodes a protein known as Fos, which, in conjunction with members of the Jun family, participates in connection with the activator-protein-1 (AP-1) binding site on DNA [Citation13–15]. AP-1 complex-containing genes are made when the Fos/Jun complex is activated. These genes make differentiated neuronal products like neurotransmitters. Selenium, a crucial trace element, holds significant value in medical research and is vital for combating free radical-induced cell damage [Citation16]. In a rat model of myocardial infarction, selenium administration demonstrated cardioprotective, anti-inflammatory, and antioxidant effects [Citation17] and decreased renal damage in a rat model of ischemia/reperfusion kidney disease [Citation18]. Selenium preparations also have a protective impact on brain tissue [Citation19]. The data acquired suggests the potential use of selenium formulations in treating Alzheimer’s disease [Citation20–22]. Research on the neuroprotective properties of selenium compounds such as selenoline, selenocysteine, and selenomethionine is expanding quickly. Studies have demonstrated that these chemicals regulate the amounts of heat shock proteins (HSP70), thereby mitigating the harmful effects of free radicals. Additionally, it controls the activity of transcription factors such as c-fos, which is linked to its primary biological role and safeguards neurons from damage [Citation16]. A treatment plan involving selenium could enhance brain cells’ antioxidant ability, improve inflammatory and fibrotic processes, and provide some defense against brain encephalopathy. The goal of this study was to evaluate the potential neuroprotective effects of selenium supplementation in a rat model suffering from chronic extrahepatic cholestasis due to bile duct closure. We will also examine the fundamental processes.
Materials and methods
Animals
30 male albino rats (160–290) g were used in this experiment. These rats were purchased from an animal farm in Giza, Egypt. The Medical Ain Shams Research Institute (MASRI) housed the rats. Before the start of this study, we allowed the rats to adapt for seven days. Throughout the experimental period, the animals had free water and food delivery at a suitable room temperature. The Institutional Animal Ethics Committee for Ain Shams University, Faculty of Medicine, approved all animal procedures in compliance with the National Institute of Health guide for the care and use of laboratory animals (NIH Publication 8th edition, revised 2011). The application approval number was FMASU R317/2023.
Surgical procedures
The bile duct was ligated in accordance with standard procedure [Citation23]. We made an abdominal incision in the midline and completely sterilely opened the peritoneal cavity. When the liver was elevated, both the common bile duct and the hilar side were visible. After dissecting the portal pedicle, we twice ligated the common bile duct with an absorbable chromic catgut and severed it to prevent recanalization. We closed the incision after relocating the abdominal organs and irrigated the peritoneal cavity with normal saline solution.
Experimental design
We randomly assigned the following three groups of rats: Group I (Sham, n = 10): This was a sham-operated control group in which rats received distilled water and were subjected to all surgical procedures without bile duct ligation. Group II (Bile duct ligated rats (BDL), n = 10): Rats in this group were subjected to bile duct ligation for 4 weeks and received distilled water. Group III (Bile duct ligated – selenium (BDL-Se), n = 10): Rats in this group underwent bile duct ligation and were administered 100 µg/kg/day of selenium as dissolved sodium selenite (Na2O3Se, Sigma, St. Louis, MO, USA) was administered by gavage for 2 weeks prior to bile duct ligation and continued receiving selenium for 4 weeks post-ligation [Citation24,Citation25].
Samples collection
Rats were weighed, and the average weight for all groups was calculated at the end of week 6. Following an intraperitoneal injection of sodium phentobarbital at a dose of 40 mg/kg to induce anesthesia in the rats, blood samples were extracted from the abdominal aorta and placed in centrifuge tubes. After allowing the blood to coagulate at room temperature, for 15 minutes, the samples were centrifuged at 3000 rpm. Sera samples were frozen at −80°C until needed for analyzing alkaline phosphatase (ALP), alanine aminotransferase (ALT), and aspartate aminotransferase (AST). The brains were removed, cleaned, and weighed before being split into two hemispheres. The right hemispheres were rapidly frozen at −80°C for analysis of glutamine, ammonia, and oxidative stress markers, including malondialdehyde, and reduced glutathione, in addition to IL-1β and c-fos expression. The left cerebral hemispheres and livers were preserved in 10% formalin for histopathological examination.
Preparation of brain homogenates
The brain tissue samples were cleaned and homogenized in 0.1 M phosphate buffer (pH 7.4) (10% w/v) using a polytron homogenizer at 4°C after being rinsed with ice. The homogenates underwent centrifugation at 10,000 rpm for 20 minutes. Portions of the supernatants were isolated and utilized for biochemical tests.
Biochemical analysis
Measurement of serum liver transaminases and alkaline phosphatase
Serum AST and ALT levels were analyzed with kits provided by Biodiagnostic (Giza, Egypt) following the specified method [Citation26]. Serum ALP was measured using kits supplied by Biodiagnostic (Giza, Egypt) according to the specified method [Citation27].
Measurement of glutamine, ammonia and IL-1β levels in brain homogenate
Rat glutamine ELISA kits (cat# MBS2602839) and rat IL-1β ELISA kits (cat# MBS825017) from MyBioSource in San Diego, CA, were utilized to measure brain glutamine and IL-1β levels following the provided instructions. The optical density (OD) of each sample was assessed at a wavelength of 450 nm. The level of ammonia in the brain was measured using a colorimetric approach with an ammonia assay kit (cat# MET-5086, Cell BioLabs Inc., San Diego, CA, USA) following the manufacturer’s guidelines.
Measurement of MDA and reduced GSH in brain homogenate
Brain malondialdehyde was determined using the specified procedure [Citation28]. By using the OxiSelectTM TBARS Assay Kit (cat# STA-330; Cell Biolabs, San Diego, CA, USA), the quantity of thiobarbituric acid reactive species (TBARS) was measured as an index of lipid peroxidation in accordance with the manufacturer’s instructions. The concentration of the primary reaction product, MDA was quantified using spectrophotometry at a wavelength of 532 nm. Reduced glutathione was analyzed by the colorimetric method [Citation29] using a colorimetric assay kit (Cat # GR 25 11; Bio Diagnostic, Giza, Egypt) in compliance with the manufacturer’s guidelines. At 405 nm, the optical density was observed.
Estimation of gene expression of c-fos gene using real-time quantitative polymerase chain reaction (qPCR) analysis
Following the manufacturer’s instructions, Direct-zol RNA Miniprep Plus (cat# R2072; Zymo Research, Irvine, CA, USA) was used to extract total RNA from brain homogenate. cDNA was synthesized via reverse transcription reaction followed by PCR in a single step using SuperScript™ IV One-Step RT-PCR kit (cat# 12594,100; Thermo Fisher Scientific, Waltham, MA, USA) and the appropriate primer sequences, as shown in according to the manufacturer’s instructions. The beta-actin gene was used as an endogenous reference control. All samples were analyzed using the StepOnePlus™ Real-Time PCR System (cat# 4,376,600; Applied Biosystem, Waltham, MA, USA). The 2−ΔΔCt method was used to measure the level of gene expression.
Table 1. Primer sequences used for qPCR, F: forward primer; R: reverse primer.
Histological examination
Five randomly selected rats per group had their liver tissues cut, preserved in 10% formalin, processed, and prepared into paraffin blocks. Hematoxylin and eosin (H&E) and Masson’s trichrome (MT) stains were used. Fifteen fields were used to measure inflammation and evaluate the amount of fibrosis in each group. Each field of view was scored using the Scheuer (1991) scoring system [Citation30], as shown in . Brain tissues were also sliced, and paraffin blocks were prepared following processing and preservation in 10% formalin. The sections were stained with H&E.
Table 2. Scheuer system for grading and staging chronic hepatitis.
Statistical analysis
To find group differences, a one-way analysis of variance (ANOVA) was performed, and then the LSD post-hoc test was performed. The least significant difference test was utilized to identify significant differences between groups. Statistically significant P values < 0.05 and highly significant P values < 0.01. The study was conducted using SPSS Windows version 20 from SPSS Inc. in Chicago, IL, USA.
Results
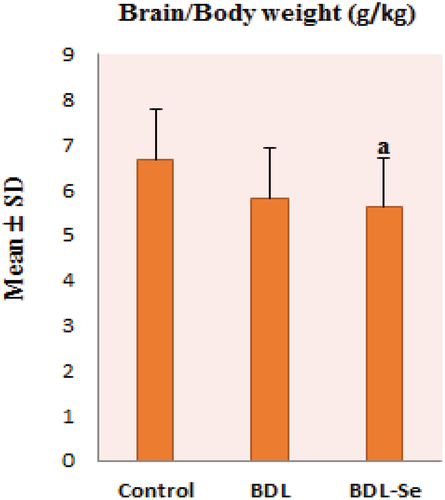
No significant difference was observed in the brain/body weight ratio between the control and the BDL groups. While the difference in ratio between the control and the BDL-Se groups was significant (P < 0.05). Also, no significance in the ratio was noticed between the BDL and the BDL-Se groups, as illustrated in .
Figure 1. Comparison of brain/body weight ratio among the experimental groups. Values are presented as mean ± SD.
To assess the efficacy of bile duct ligation on liver integrity, serum levels of ALT, AST, and ALP were measured. As shown in , serum levels of ALT, AST, and ALP exhibited notable increases in BDL rats compared to the control group. However, selenium supplementation in the BDL-Se group led to significant reductions in all these hepatic enzymes compared to the BDL group, achieving levels comparable to those of the sham-operated controls (P < 0.01).
Table 3. Effect of selenium on serum liver enzymes activity among the studied groups.
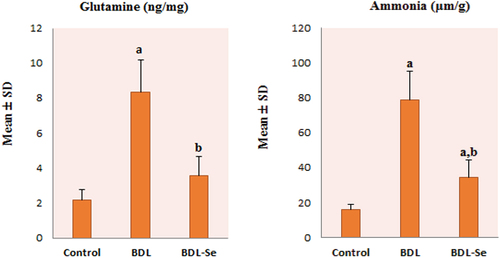
As illustrated in , brain levels of glutamine and ammonia in the BDL group showed a statistically significant increase compared to those of the control group, and these levels were significantly decreased by selenium supplementation in the BDL-Se group compared to the BDL group, achieving levels comparable to those of the control group (P < 0.01).
Figure 2. Comparison of brain glutamine level among the experimental groups. Values are presented as mean ± SD.
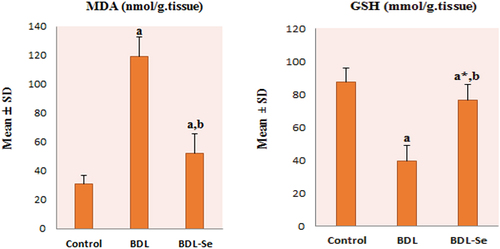
To investigate the effect of selenium supplementation on brain oxidative stress, brain levels of GSH and MDA were measured. As shown in , there was a significant decrease in GSH and a remarkable increase in MDA levels in the brain of the BDL group compared with the control group (all P < 0.01). However, the reduction in GSH and the increase in MDA levels were significantly reversed by selenium supplementation in the BDL-Se group (all P < 0.01).
Figure 3. Comparison of brain MDA and GSH content among the experimental groups. Values are presented as mean ± SD.
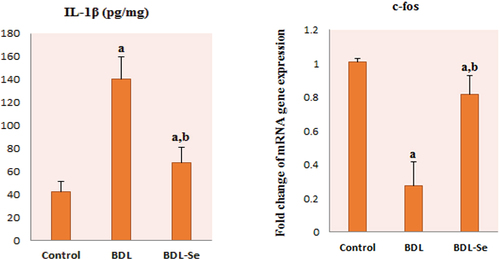
Our results revealed a significant elevation of the proinflammatory marker, IL-1β in the BDL group compared to the control group, whereas selenium supplementation significantly decreased IL-1β in the BDL-Se group compared to the BDL group (P < 0.01). Moreover, c-fos gene expression was significantly decreased in the BDL group compared with its expression in the control group. Conversely, c-fos expression was significantly increased after selenium supplementation in the BDL-Se group (P < 0.01), as illustrated in .
Figure 4. Comparison of brain IL-1β levels and c-fos mRNA relative expression among the experimental groups. Values are presented as mean ± SD.
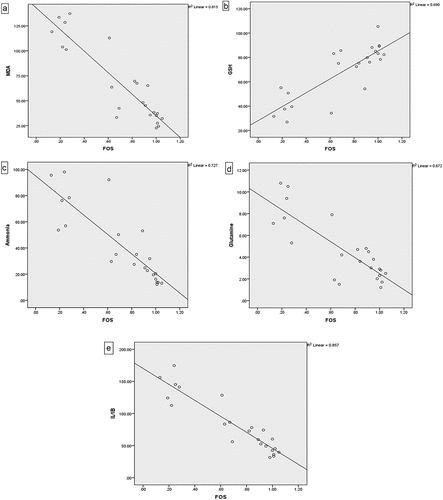
Correlation analysis for all animal groups showed a significant indirect correlation between brain c-fos expression and brain levels of ammonia, glutamine, IL-1β and MDA, as illustrated in .
Figure 5. Correlation between brain c-fos expression and brain levels of: (a) MDA, (b) GSH, (c) Ammonia, (d) Glutamine, and (e) IL-1β.
Liver sections from the control group showed normal liver architecture of classic hepatic lobules with no evident fibrosis (activity grade 0, fibrosis score 0), as illustrated in . BDL rats’ liver showed a markedly expanded edematous portal tract with a markedly dilated congested portal vein, proliferating bile ducts, a moderate portal and peri-portal inflammatory infiltrate, a markedly dilated central vein, and scattered apoptotic hepatocytes in the peri-venular area associated with occasional intra-venous emboli, as illustrated in .
Figure 6. Histopathologic features of liver sections from sham-operated group. (a) Section stained with hematoxylin and eosin shows average central veins (black arrows), average portal tracts (blue arrows), and average hepatocytes (red arrow) (X200). (b) Masson trichrome stained section from the same group shows average collagen distribution around the central vein (black arrows) (X100).
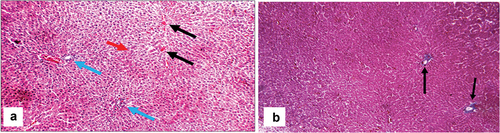
Figure 7. Histopathologic features of liver sections from bile duct-ligated group. (a) Section stained with hematoxylin and eosin (H&E) shows markedly expanded edematous portal tract (blue arrows) with a markedly dilated, congested portal vein (PV), proliferating bile ducts (grey arrows), moderate portal (green arrow), and peri-portal inflammatory infiltrate (yellow arrow) (X200). (b) Another view from the same group shows markedly expanded edematous portal tracts (blue arrows) with markedly dilated PV, irregular hepatic lobule (red arrows), and moderate peri-portal inflammatory infiltrate (green arrows) (H&E, X200). (c) Another view from the same group shows markedly dilated central vein with intra-venous embolus (black arrow) and scattered apoptotic hepatocytes in the peri-venular area (red arrows) (H&E, X 400) (d) Masson trichrome stained section from the same group shows excess collagen (yellow arrows) with nodular formation (black arrows) (X200).
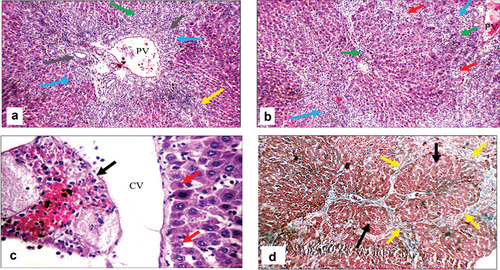
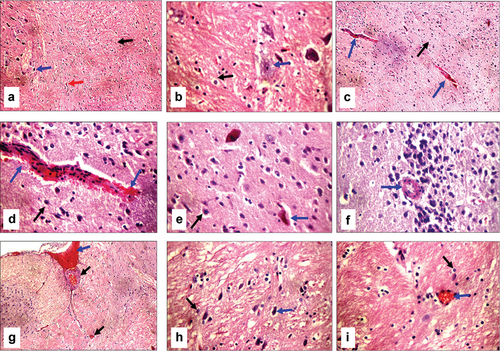
Cirrhotic changes in the form of a fibrous band connecting the central vein with the portal tract were evident in BDL rats, which were confirmed by Masson trichrome special MT stain (activity grade 3, fibrosis score 4), as illustrated in . In BDL-Se rats, there were moderately expanded portal tracts, with a dilated portal vein, proliferating bile ducts, a dilated central vein, a mild portal inflammatory infiltrate, scattered apoptotic hepatocytes in the interface area, mild fibrosis with thin collagen bands, and architectural distortion (activity grade 2, fibrosis score 3), as illustrated in . Proliferating bile ducts were seen in both groups to an almost similar extent. The extent of collagen deposition as well as the intensity of inflammatory infiltrate are much lower in BDL-Se rats compared to the BDL rats. Brain tissue in BDL rats showed ruptured small blood vessels with extravasated red cells as well as scattered degenerated neurons, which were not seen in the control animals. In addition, the hippocampus showed thick-walled blood vessels in BDL rats. BDL-Se rats showed only congested blood vessels with no evidence of ruptured blood vessels or degenerated neurons, as illustrated in .
Figure 8. Histopathologic features of liver sections from bile duct ligated-selenium group. (a) Section stained with hematoxylin and eosin (H&E) shows portal tract with dilated portal vein (PV), mild portal inflammatory infiltrate (yellow arrows) and average hepatocytes (red arrow) (X200). (b) Higher magnification of the previous section shows dilated PV, proliferating bile ducts with average epithelial lining (grey arrow), mild portal inflammatory infiltrate (yellow arrow), and scattered apoptotic hepatocytes in the interface area (red arrows) (H&E, X400). (c) Another section shows an expanded portal tract with mild portal inflammatory infiltrate (yellow arrows), and mild fibrosis with architectural distortion (red arrows) (H&E, X200). (d) Masson trichrome stained section from the same group shows mild fibrosis with architectural distortion (black arrows) (X200).
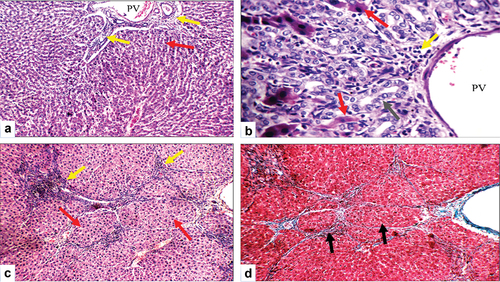
Figure 9. Histopathologic features of brain sections stained with hematoxylin and eosin; (a) Sham operated group shows average astrocytes (black arrow), average neurons (blue arrow), and average blood vessels (red arrow) in fibrillary background (X200). (b) Higher magnification of the previous section shows average astrocytes (black arrow) with average neurons (blue arrow) in a fibrillary background (X400). (c) Bile duct-ligated (BDL) group shows average astrocytes in a fibrillary background (black arrow), and ruptured small blood vessels (blue arrows) (X200). (d) Higher magnification of the previous section shows average astrocytes in a fibrillary background (black arrow), and ruptured small blood vessels with extravasated red cells (blue arrows) (X400). (e) Another view of the BDL group shows average astrocytes in the fibrillary background (black arrow), and scattered degenerated neurons (blue arrow) (X400). (f) Another section of the BDL group shows thick-walled blood vessels in the hippocampus (blue arrow) (X400). (g) Bile duct ligated-selenium (BDL-Se) group shows less dilated congested blood vessels (black arrows) and dilated congested blood sinusoids (blue arrow) (X200). (h) BDL-Se group shows average astrocytes in the fibrillary background (black arrow) and average neurons (blue arrow) (X400). (i) BDL-Se group shows average astrocytes in the fibrillary background (black arrow) and less congested blood vessels (blue arrow) (X400).
Discussion
Hepatic encephalopathy is a primary neurological condition observed in patients with severe liver diseases [Citation31]. Currently, the most extensively studied animal model for researching hepatic encephalopathy is the bile duct ligation in rats [Citation32]. By focusing on the neuroprotection afforded by selenium, in the current study we investigated the possible ameliorating effects of selenium supplementation during brain encephalopathy and explored some of the mechanisms mediating these effects. In the present study, histopathological analysis of the liver showed that bile duct ligation promoted loss of liver integrity, which was confirmed by the presence of excess collagen around a markedly dilated central vein with nodular formation, a markedly dilated congested portal vein, and expanded edematous portal tracts with moderate chronic inflammatory infiltrate, confirming that the bile duct ligation procedure was found to be effective in producing hepatic injury. On the same line, marked elevations of liver enzymes AST, ALT, and ALP in the serum were observed in BDL rats, indicating liver cellular leakage as well as damage to the structural and functional integrity of liver cells. In BDL rats, brain ammonia and glutamine levels were markedly elevated, suggesting that Gln is most likely to be the first metabolite affected by increased plasma ammonia following bile duct ligation. Moreover, ruptured blood vessels and degenerated neurons were seen in the brain tissue. Multiple mechanisms were postulated to explain the development of brain edema and neurological dysfunction caused by hyperammonemic conditions during hepatic encephalopathy. Ammonia either diffuses into the brain from the blood or cerebrospinal fluid, and its excess is toxic to the central nervous system. Since the brain cannot make urea from ammonia, its removal relies mainly on glutamine synthesis [Citation33]. Astrocytes produce a large amount of glutamine when there is hyperammonemia. Neurons use glutamine as a substrate to make the neurotransmitter glutamate. After being released from synaptic vesicles, glutamate builds up to an excitotoxic concentration before being taken up by astrocytes and changed back into glutamine [Citation34]. Several studies have emphasized that mitochondria are major targets of ammonia-induced cytotoxicity, resulting in the excessive generation of reactive oxygen species (ROS) in the brain [Citation35–37]. Furthermore, since the brain is abundant in myelinated nerve fibers rich in phospholipids and polyunsaturated fatty acids, the brain cells become highly vulnerable to ROS-dependent membrane structure damage [Citation38]. The amount of lipid peroxidation in the brain is a reliable predictor of the extent of oxidative damage caused by ROS. In the current work, MDA content in the brains of BDL rats was evaluated, and its level was significantly increased compared to the control group and strongly correlated with brain ammonia level. This may be due to the fact that excessive brain ammonia induces N-methyl D-aspartate (NMDA) receptor activation, which plays a crucial role in the production of free radicals and a reduction in antioxidant enzyme activity [Citation39]. Reduced glutathione is the most abundant antioxidant in the human brain and is capable of protecting the cellular components from the damage caused by ROS [Citation40]. The brains of BDL rats in the current investigation showed a significant drop in GSH content, indicating the existence of oxidative stress and demonstrating the critical function of glutathione in the regulation and mitigation of the harmful effects of oxidative stress. All of these data point to a synergistic interaction between reactive oxygen species, ammonia, astrocyte swelling/brain edema, and degenerative neurons in the context of HE. Particularly important for healthy brain function, selenium is a trace antioxidant and anti-inflammatory element that is vital to human health in general [Citation41,Citation42]. Based on reports, selenium not only functions as a cofactor for several selenium-dependent enzymes, particularly glutathione peroxidase (GPX), but it also acts as a potent antioxidant to protect cells and tissues from damage caused by oxidative stress [Citation43–45]. Interestingly, the results of the present study showed that selenium supplementation mitigated the toxicity of ammonia in the brain of BDL-Se rats through improving oxidative stress, which was evidenced by the decrease in brain MDA content with a corresponding increase in brain GSH, confirming the antioxidant and neuroprotective role of selenium. The results of this experimental study are consistent with those of [Citation46] who assessed the neuroprotective potential of selenium in mouse dorsal ganglion root cells exposed to Se. Similarly, Xiong S et al. noted that since selenium is thought to directly interfere with amyloid and iron neurotoxicity through modulation of GPX activity in primary rat hippocampal neurons, selenium supplementation and the ensuing increase in GPX activity seem to be an appropriate approach for the maintenance of brain function in patients with Alzheimer’s disease (AD) and mild cognitive impairment (MCI) [Citation47]. Previous studies have clearly shown that an increased level of brain ammonia triggers neuroinflammation with microglial activation, which contributes to cognitive and motor impairments that can be corrected with anti-inflammatories [Citation48,Citation49]. Impaired neurotransmission associated with microglia activation and elevated cerebral cytokine synthesis has been demonstrated in various animal models for HE induced by portacaval shunt or bile duct ligation [Citation32,Citation50,Citation51]. The activation of microglia affects neurons in both positive and negative ways in various clinical situations. There are several different functional phenotypes of microglia, from the pro-inflammatory M1 phenotype, which serves as the first line of defense, to the immunosuppressive M2 phenotype. Nitric oxide, or IL-1β, is a hallmark of the M1 phenotype; indicators of the M2 phenotype include YM-1, IL-10, IL-4, and arginase 1 (Arg 1) [Citation52]. It has been suggested that changing the phenotype of microglia from pro-inflammatory, cytotoxic M1 to anti-inflammatory, neuroprotective M2 could be a therapeutic approach for a number of neurodegenerative diseases marked by neuroinflammation, including amyotrophic lateral sclerosis and Parkinson’s disease [Citation53,Citation54]. In order to confirm the anti-inflammatory role of selenium, we evaluated levels of IL-1β, a potent pro-inflammatory cytokine crucial for host-defense responses to infection and injury, in the brains of rats in all groups. Surprisingly, our results showed that selenium supplementation successfully promoted this polarization of microglia to a neuroprotective M2 phenotype in the brain of BDL rats supplemented with selenium, as evidenced by reducing levels of the M1 marker IL-1β, which were significantly elevated in BDL rats’ brains. c-fos gene is one of the immediate early genes (IEGs) that are associated with stimuli-transcription activity in the brain [Citation55]. c-fos was subsequently employed as a marker of cellular activity to identify brain regions involved in stimuli response or connection between different brain areas [Citation56,Citation57]. In the present study, analysis of c-fos expression in brain tissues showed a decreased pattern of its activity following bile duct ligation. We posited that; this reduced c-fos activity might be due to a disturbance in the glutamate/GABA-glutamine cycling within the brain. Our findings supported this hypothesis, revealing a significant inverse correlation between brain glutamine levels and c-fos expression. In alignment with the current study, Trinity P. et al., studied the correlation between c-fos expression and various metabolites in the prefrontal cortex of germ-free mice (GF) [Citation58]. Their study revealed a notable increase in extracellular glutamate that leads to neuronal excitotoxicity mediated by calcium, causing a decrease in cortical neuronal activity. This decrease is indicated by reduced c-fos, as it serves as an indicator of neural activity. Furthermore, a significant negative correlation between brain c-fos levels and the levels of brain ammonia, MDA, glutamine, and IL-1β was observed in the present study. Our hypothesis suggests that the reduced expression of the c-fos gene may be attributed to the oxidative stress state that results from hyperammonemia, resulting in mitochondrial damage. This damage, in turn, leads to impaired oxidative phosphorylation, the suppression of c-fos gene expression, and subsequently, the repression of Fos protein biosynthesis. Surprisingly, our study showed a significant increase in the expression of the c-fos gene following selenium supplementation. Although the precise mechanisms underlying selenium’s influence on c-fos expression in the brain remain unclear, we hypothesize that selenium may modulate c-fos gene expression by ameliorating oxidative stress and reducing neuroinflammation associated with hyperammonemia. This suggests a potential interplay between selenium, oxidative stress, and neuroinflammation in shaping the expression of the c-fos gene. Further research is needed to elucidate the relationship between selenium supplementation and c-fos gene expression in the brain. Rusetskaya et al., outlined how the body’s selenium levels affect the control of intracellular signaling cascades that cause inflammation and apoptosis [Citation59]. Additionally, anti-oxidant enzyme activity can be restored by regularly administering formulations containing selenium as a preventative. In concordance, the inflammatory response as well as the fibrotic changes in the liver tissue in the BDL-Se treated group in our study were far less than in the BDL group confirming the protective effect of selenium on the liver tissue.
Conclusion
These results indicate the possible therapeutic benefit of selenium in reducing the symptoms of hepatic encephalopathy caused by cholestasis and liver cirrhosis. Selenium supplementation may be a potential supplementary therapeutic approach for treating HE and enhancing cognitive performance in affected persons by addressing inflammation and oxidative stress. To clarify the precise processes underlying selenium’s neuroprotective benefits and to confirm its effectiveness in therapeutic settings, more study is necessary. However, the study’s findings offer encouraging information about the possible application of selenium as a treatment agent for HE and associated neurological problems in liver disease patients.
Author contributions
All authors contributed to this study equally. All authors read and approved the final manuscript.
Availability of data and materials
Date available up on request by corresponding author.
Ethics approval
All animal procedures were performed in compliance with the with the National Institute of Health guide for the care and use of laboratory animals (NIH Publication 8th edition, revised 2011) and were approved by the Institutional Animal Ethics Committee for Ain Shams University, Faculty of Medicine. The application approval number was FMASU R317/2023.
Acknowledgments
The authors thank Dr. Sayed Abdel Raheem, assistant professor of histopathology, Faculty of Medicine, Al Azhar University, for his contribution in the histological studies.
Disclosure statement
No potential conflict of interest was reported by the author(s).
Additional information
Funding
References
- Dazıroğlu MEÇ, Yıldıran H. Intestinal dysbiosis and probiotic use: its place in hepatic encephalopathy in cirrhosis. Ann Gastroenterol. 2023;36:141–148. doi: 10.20524/aog.2023.0776
- Chen H-L, Wu S-H, Hsu S-H, et al. Jaundice revisited: recent advances in the diagnosis and treatment of inherited cholestatic liver diseases. J Biomed Sci. 2018;25(1):75. doi: 10.1186/s12929-018-0475-8
- Al-Tubaikh JA. Gastroenterology. In: Al-Tubaikh J, editor. International medical illustration radiology guide. Cham: Springer International Publishing; 2023. p. 1–63. doi: 10.1007/978-3-031-28575-2_1
- Sepehrinezhad A, Stolze Larsen F, Ashayeri Ahmadabad R, et al. The glymphatic system may play a vital role in the pathogenesis of hepatic encephalopathy: a narrative review. Cells. 2023;12(7):979. doi: 10.3390/cells12070979
- Dasarathy S, Mookerjee RP, Rackayova V, et al. Ammonia toxicity: from head to toe? Metab Brain Dis. 2017;32(2):529–538. doi: 10.1007/s11011-016-9938-3
- Hadjihambi A, Harrison IF, Costas-Rodríguez M, et al. Impaired brain glymphatic flow in experimental hepatic encephalopathy. J Hepatol. 2019;70:40–49. doi: 10.1016/j.jhep.2018.08.021
- Sepehrinezhad A, Zarifkar A, Namvar G, et al. Astrocyte swelling in hepatic encephalopathy: molecular perspective of cytotoxic edema. Metab Brain Dis. 2020;35(4):559–578. doi: 10.1007/s11011-020-00549-8
- Weiss N, Jalan R, Thabut D. Understanding hepatic encephalopathy. Intensive care Med. 2018;44(2):231–234. doi: 10.1007/s00134-017-4845-6
- Rama Rao KV, Norenberg MD. Glutamine in the pathogenesis of hepatic encephalopathy: the trojan horse hypothesis revisited. Neurochem Res. 2014;39(3):593–598. doi: 10.1007/s11064-012-0955-2
- Hiba OE, Elgot A, Ahboucha S, et al. Differential regional responsiveness of astroglia in mild hepatic encephalopathy: an immunohistochemical approach in bile duct ligated rat. Acta Histochem. 2016;118(4):338–346. doi: 10.1016/j.acthis.2016.03.003
- Azhari H, Swain MG. Role of peripheral inflammation in hepatic encephalopathy. J Clin Exp Hepatol. 2018;8:281–285. doi: 10.1016/j.jceh.2018.06.008
- Curran T, Morgan JI. Fos: an immediate-early transcription factor in neurons. J Neurobiol. 1995;26:403–412. doi: 10.1002/neu.480260312
- Curran T, Teich NM. Candidate product of the FBJ murine osteosarcoma virus oncogene: characterization of a 55,000-dalton phosphoprotein. J Virol. 1982;42(1):114–122. doi: 10.1128/jvi.42.1.114-122.1982
- Lee WM, Lin C, Curran T. Activation of the transforming potential of the human fos proto-oncogene requires message stabilization and results in increased amounts of partially modified fos protein. Mol Cell Biol. 1988;8(12):5521–5527. doi: 10.1128/MCB.8.12.5521
- Sheng M, Greenberg ME. The regulation and function of c-fos and other immediate early genes in the nervous system. Neuron. 1990;4(4):477–485. doi: 10.1016/0896-6273(90)90106-p
- Belenichev I, Gorchakov N, Samura I, et al. Pharmacological properties of selenium and its preparations: from antioxidant to neuroprotector. Res Results Pharmacol. 2021;7(4):29–40. doi: 10.3897/rrpharmacology.7.73051
- Gunes S, Sahinturk V, Karasati P, et al. Cardioprotective effect of selenium against cyclophosphamide-induced cardiotoxicity in rats. Biol Trace Elem Res. 2017;177(1):107–114. doi: 10.1007/s12011-016-0858-1
- Hasanvand A, Abbaszadeh A, Darabi S, et al. Evaluation of selenium on kidney function following ischemic injury in rats; protective effects and antioxidant activity. J Ren Inj Prev. 2016;6(2):93–98. doi: 10.15171/jrip.2017.18
- Reddy VS, Bukke S, Dutt N, et al. A systematic review and meta-analysis of the circulatory, erythrocellular and CSF selenium levels in alzheimer’s disease: a metal meta-analysis (AMMA study-I). J Trace Elem Med Biol Organ Soc Miner Trace Elem GMS. 2017;42:68–75. doi: 10.1016/j.jtemb.2017.04.005
- Reeves MA, Bellinger FP, Berry MJ. The neuroprotective functions of selenoprotein M and its role in cytosolic calcium regulation. Antioxid Redox Signal. 2010;12:809–818. doi: 10.1089/ars.2009.2883
- Tamtaji OR, Heidari-Soureshjani R, Mirhosseini N, et al. Probiotic and selenium co-supplementation, and the effects on clinical, metabolic and genetic status in alzheimer’s disease: a randomized, double-blind, controlled trial. Clinical Nutrition. 2019;38(6):2569–2575. doi: 10.1016/j.clnu.2018.11.034
- da Silva Leme AGH, Cardoso BR. Selenium and alzheimer’s disease. In: Genetics, neurology, behavior, and diet in dementia: the neuroscience of dementia. Academic Press; 2020. p. 739–748. doi: 10.1016/B978-0-12-815868-5.00047-5
- Tag CG, Sauer-Lehnen S, Weiskirchen S, et al. Bile duct ligation in mice: induction of inflammatory liver injury and fibrosis by obstructive cholestasis. J Vis Exp JoVE. 2015;(96). doi: 10.3791/52438
- El-Boshy ME, Risha EF, Abdelhamid FM, et al. Protective effects of selenium against cadmium induced hematological disturbances, immunosuppressive, oxidative stress and hepatorenal damage in rats. J Trace Elem Med Biol Organ Soc Miner Trace Elem GMS. 2015;29:104–110. doi: 10.1016/j.jtemb.2014.05.009
- Lebda F, El Agaty S, Atef M, et al. Selenium attenuates cholestasis-induced liver injury and fibrosis by alleviating liver oxidative stress and inflammation in rats. Bull Egypt Soc Physiol Sci. 2022;42:131–143. doi: 10.21608/besps.2021.90723.1109
- Reitman S, Frankel S. A colorimetric method for the determination of serum glutamic oxalacetic and glutamic pyruvic transaminases. Am J Clin Pathol. 1957;28(1):56–63. doi: 10.1093/ajcp/28.1.56
- Belfield A, Goldberg DM. Revised assay for serum phenyl phosphatase activity using 4-amino-antipyrine. Enzyme. 1971;12(5):561–573. doi: 10.1159/000459586
- Mihara M, Uchiyama M. Determination of malonaldehyde precursor in tissues by thiobarbituric acid test. Anal Biochem. 1978;86(1):271–278. doi: 10.1016/0003-2697(78)90342-1
- Beutler E, Duron O, Kelly BM. Improved method for the determination of blood glutathione. J Lab Clin Med. 1963;61:882–888.
- Scheuer PJ. Classification of chronic viral hepatitis: a need for reassessment. J Hepatol. 1991;13:372–374. doi: 10.1016/0168-8278(91)90084-o
- Jopowicz A, Tarnacka B. Neurological wilson’s disease signs—hepatic encephalopathy or copper toxicosis? Diagnostics. 2023;13(5):893. doi: 10.3390/diagnostics13050893
- Claeys W, Van Hoecke L, Geerts A, et al. A mouse model of hepatic encephalopathy: bile duct ligation induces brain ammonia overload, glial cell activation and neuroinflammation. Sci Rep. 2022;12(1):17558. doi: 10.1038/s41598-022-22423-6
- Lemberg A, Alejandra Fernández M. Hepatic encephalopathy, ammonia, glutamate, glutamine and oxidative stress. Ann Hepatol. 2009;8:95–102. doi: 10.1016/S1665-2681(19)31785-5
- Zwingmann C, Butterworth R. An update on the role of brain glutamine synthesis and its relation to cell-specific energy metabolism in the hyperammonemic brain: further studies using NMR spectroscopy. Neurochem Int. 2005;47:19–30. doi: 10.1016/j.neuint.2005.04.003
- Felipo V, Butterworth RF. Neurobiology of ammonia. Prog Neurobiol. 2002;67:259–279. doi: 10.1016/s0301-0082(02)00019-9
- Samuelsson C, Hillered L, Zetterling M, et al. Cerebral glutamine and glutamate levels in relation to compromised energy metabolism: a microdialysis study in subarachnoid hemorrhage patients. J Cereb Blood Flow Metab. 2007;27(7):1309–1317. doi: 10.1038/sj.jcbfm.9600433
- Niknahad H, Jamshidzadeh A, Heidari R, et al. Ammonia-induced mitochondrial dysfunction and energy metabolism disturbances in isolated brain and liver mitochondria, and the effect of taurine administration: relevance to hepatic encephalopathy treatment. Clin Exp Hepatol. 2017;3:141–151. doi: 10.5114/ceh.2017.68833
- Halliwell B, Gutteridge JMC. Oxygen radicals and the nervous system. Trends Neurosci. 1985;8:22–26. doi: 10.1016/0166-2236(85)90010-4
- Seyan AS, Hughes RD, Shawcross DL. Changing face of hepatic encephalopathy: role of inflammation and oxidative stress. WJG. 2010;16(27):3347–3357. doi: 10.3748/wjg.v16.i27.3347
- Oeltzschner G, Butz M, Wickrath F, et al. Covert hepatic encephalopathy: elevated total glutathione and absence of brain water content changes. Metab Brain Dis. 2016;31(3):517–527. doi: 10.1007/s11011-015-9760-3
- Solovyev ND. Importance of selenium and selenoprotein for brain function: from antioxidant protection to neuronal signalling. J Inorg Biochem. 2015;153:1–12. doi: 10.1016/j.jinorgbio.2015.09.003
- Oliveira CS, Piccoli BC, Nogara PA, et al. Selenium neuroprotection in neurodegenerative disorders. In: Handbook of neurotoxicity. 2nd ed. Vol. 3. Springer International Publishing; 2023. p. 2489–2523. doi: 10.1007/978-3-031-15080-7_238
- Schweizer U, Bräuer AU, Köhrle J, et al. Selenium and brain function: a poorly recognized liaison. Brain Res Rev. 2004;45:164–178. doi: 10.1016/j.brainresrev.2004.03.004
- Dennouni-Medjati N, Harek Y, Tarik A, et al. Whole blood selenium levels in healthy adults from the west of Algeria. Biol Trace Elem Res. 2012;147(1–3):44–48. doi: 10.1007/s12011-011-9287-3
- Fang K-M, Cheng F-C, Huang Y-L, et al. Trace element, antioxidant activity, and lipid peroxidation levels in brain cortex of gerbils after cerebral ischemic injury. Biol Trace Elem Res. 2013;152(1):66–74. doi: 10.1007/s12011-012-9596-1
- Uğuz AC, Nazıroğlu M. Effects of selenium on calcium signaling and apoptosis in rat dorsal root ganglion neurons induced by oxidative stress. Neurochem Res. 2012;37(8):1631–1638. doi: 10.1007/s11064-012-0758-5
- Xiong S, Markesbery WR, Shao C, et al. Seleno-L-Methionine protects against β-amyloid and iron/hydrogen peroxide-mediated neuron death. Antioxid Redox Signal. 2007;9:457–467. doi: 10.1089/ars.2006.1363
- Rodrigo R, Cauli O, Gomez–Pinedo U, et al. Hyperammonemia induces neuroinflammation that contributes to cognitive impairment in rats with hepatic encephalopathy. Gastroenterology. 2010;139(2):675–684. doi: 10.1053/j.gastro.2010.03.040
- Agusti A, Cauli O, Rodrigo R, et al. p38 MAP kinase is a therapeutic target for hepatic encephalopathy in rats with portacaval shunts. Gut. 2011;60(11):1572–1579. doi: 10.1136/gut.2010.236083
- Zemtsova I, Görg B, Keitel V, et al. Microglia activation in hepatic encephalopathy in rats and humans. Hepatology. 2011;54(1):204–215. doi: 10.1002/hep.24326
- Chen J-R, Wang B-N, Tseng G-F, et al. Morphological changes of cortical pyramidal neurons in hepatic encephalopathy. BMC Neurosci. 2014;15(1):15. doi: 10.1186/1471-2202-15-15
- Tang Y, Le W. Differential roles of M1 and M2 microglia in neurodegenerative diseases. Mol Neurobiol. 2016;53(2):1181–1194. doi: 10.1007/s12035-014-9070-5
- Saitgareeva AR, Bulygin KV, Gareev IF, et al. The role of microglia in the development of neurodegeneration. Neurol Sci. 2020;41(12):3609–3615. doi: 10.1007/s10072-020-04468-5
- Guo S, Wang H, Yin Y. Microglia polarization from M1 to M2 in neurodegenerative diseases. Front Aging Neurosci. 2022;14:14. doi: 10.3389/fnagi.2022.815347
- Hudson AE. Chapter twelve - genetic reporters of neuronal activity: c-Fos and G-CaMP6. In: Eckenhoff R Dmochowski I, editors. Methods in enzymology. Vol. 603. Academic Press; 2018. p. 197–220. doi: 10.1016/bs.mie.2018.01.023
- Campeau S, Akil H, Watson SJ. Lesions of the medial geniculate nuclei specifically block corticosterone release and induction of c-fos mRNA in the forebrain associated with audiogenic stress in rats. J Neurosci. 1997;17:5979–5992. doi: 10.1523/JNEUROSCI.17-15-05979.1997
- Campeau S, Dolan D, Akil H, Watson SJ. c- fos mRNA induction in acute and chronic audiogenic stress: possible role of the orbitofrontal cortex in habituation. Stress. 2002;5(2):121–130. doi: 10.1080/10253890290027895
- Pate T, Anthony DC, Radford-Smith DE. cFOS expression in the prefrontal cortex correlates with altered cerebral metabolism in developing germ-free mice. Front Mol Neurosci. 2023;16. doi: 10.3389/fnmol.2023.1155620
- Rusetskaya NY, Fedotov IV, Koftina VA, et al. Selenium compounds in redox regulation of inflammation and apoptosis. Biomed Khim. 2019;65(3):165–179. doi: 10.18097/PBMC20196503165