
Abstract
The objective of the article is to investigate the vibration characteristic and the long-term service performance of a China Railway High-speed (CRH) train at operation speed of 350 km/h through on-track field tests. The article first introduces the test method and system as well as the field conditions including the main parameters of the test train and track. A CRH electric multiple unit (EMU), called the CRH2C, is chosen for the experiment. A duration test lasting for about 2 months is carried out to acquire the data of vehicle vibration acceleration and the wheel profile wear. Based on the test data, the article presents the vibration behaviours of car body, bogie frame and axle box as well as the lateral hunting stability of the train operating at speed of 350 km/h, and the evolution of the train dynamic performance under long-term operation condition. Results show that the vibration accelerations of vehicle components are in a low level when the train runs on a non-ballasted track at the speed of 350 km/h, indicating that both the ride comfort and the running stability are acceptable. Through wheel re-profiling, it is possible to effectively reduce the vibrations of the axle box, the bogie frame and the car body, and thus the train dynamic performance can be kept in an excellent condition in a long period.
1. Introduction
In the field operation of a high-speed train, all components of the train system will inevitably vibrate under external excitations. Unacceptable levels of vibration directly impact operation safety and ride comfort, which are critical concerns of railway operation agencies. Investigation on train vibration characteristic, especially on the vibration performance over time, is significant to understand the train service status and ensure its long-term operation safety.
Researchers around the world have carried out a number of tests and theoretical studies in order to understand the train vibration characteristics during operation and monitor train dynamical performance. For the field test of railway vehicle vibration, Stow and Andersson [Citation1] systematically introduced the commonly used test methods, test equipment and data acquisition techniques and presented specific implementation cases. Aiming at the ride comfort problems of Shinkansen operating train, Sugahara et al. [Citation2] carried out an on-track operation test of a high-speed train. It focused on whether the controllable suspension damping can effectively restrain the rigid modal at around 1 Hz and the first-order elastic mode at about 8.2 Hz of the car body when the train was in high-speed operation. Konowrocki and Bajer [Citation3] studied train vibration performance at straight line and curves using field test methods, and the test results of the vehicle floor covered the high frequency vibration above 300 Hz. It is shown that the vibration amplitude of the car body on curves was larger than that on straight line. For the Alfa tilting train, Ribeiro et al. [Citation4] experimentally studied the vibration modals of car body and bogie frames and then established the corresponding finite element models that were verified with the test results. In order to monitor the hunting stability of high-speed bogie as well as to identify the factors probably leading to train instability, Gasparetto et al. [Citation5] put forward a running stability monitoring method for high-speed bogies. This method adopted the Random Decrement Technique (RDT) to analyse the lateral acceleration of the bogie frame and then identified the stability characteristics of the vehicle system, which has been applied in ETR500 high-speed train. Zhai et al. [Citation6] conducted a field test of high-speed train–track–bridge dynamic interaction on Beijing–Tianjin high-speed railway, in which the dynamic indices of CRH2 and CRH3 trains passing through a 32-m span bridge at speed of 200–380 km/h were measured. Most of the aforementioned vibration tests are transient performance tests, which can be used for the train performance assessment at that time, but they were inadequate to evaluate the long-term operation performance of a high-speed train.
In recent years, China has substantially promoted high-speed railway construction. In 2008, the first high-speed railway line, namely the Beijing–Tianjin intercity railway, was put into service. Then in 2009, another long-distance high-speed railway, Wuhan–Guangzhou high-speed railway, was opened. In 2011, Beijing–Shanghai high-speed railway with the highest design standard came into service. At that time, the maximum operating speed of these railway lines was 350 km/h, considered to be the world’s highest operation speed in the corresponding period. However, the China Railway High-speed (CRH) has operated within a relatively short period of time so far, and the railway agencies will inevitably be confronted with the need to understand performance over time and maintenance requirements for the vehicles and load-bearing infrastructure in the long run. There is no reported research activity on the on-track field test of long-term service performance for the 350-km/h train.
In order to understand the long-term vibration characteristic of high-speed trains operating on actual railway lines, the Test and Control Group of State Key Laboratory of Traction Power in Southwest Jiaotong University carried out an on-track tracing test on the CRH2C high-speed train [Citation7]. The test train operates on the Wuhan–Guangzhou high-speed railway with passengers under normal conditions. This article illustrates research results based on this on-track test as follows: Section 2 introduces the general test conditions of the high-speed train and track, the vibration test method, and the composition of the test system. Based on the test results, Section 3 analyses the acceleration response characteristics of the vehicle system when CRH2C high-speed train operates at 350 km/h on a non-ballasted track. Section 4 presents the vibration evolution laws of the high-speed train under long-term operation condition, including the evolution of wheel profile wear. Finally, Section 5 concludes.
2. On-track test of high-speed train vibration
2.1. Test conditions
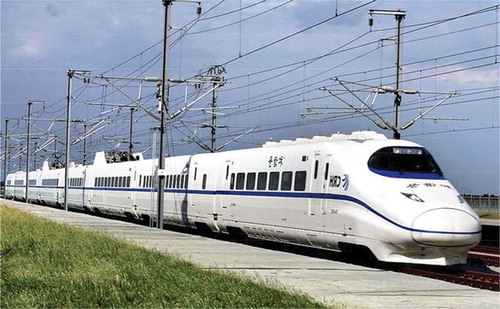
In China, it is a common operation pattern to operate the 200–250 km/h electric multiple units (EMUs) on ballasted tracks and 300–350 km/h EMUs on non-ballasted tracks. Therefore, the research group chose the typical CRH2C EMU () with the maximum running speed of 350 km/h as the tested train and carried out an on-track tracing test to investigate its vibration performance. This EMU consists of eight cars (6M2T), and the first to fourth cars are selected for the test. The main parameters of the tested EMU are listed in .
Table 1. Main parameters of the CRH2C high-speed train.
Figure 1. Tested train: the CRH2C high-speed EMU.
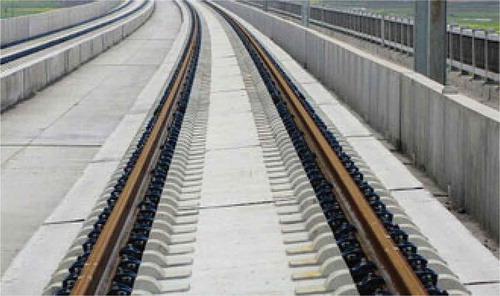
The test line was the Wuhan–Guangzhou high-speed railway with the double-block non-ballasted track structure of China Railway Track System I (CRST-I) in . lists the main parameters of the track.
Table 2. Main parameters of the CRTS-I double-block non-ballasted track.
Figure 2. The CRTS-I double-block non-ballasted track on the Wuhan–Guangzhou high-speed railway.
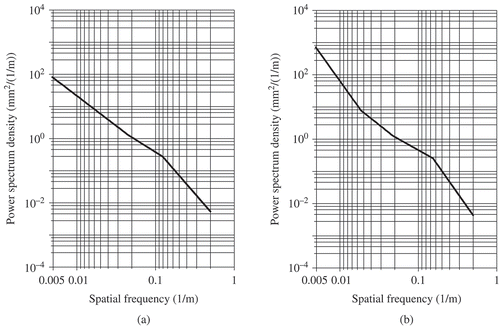
As it is known, the non-ballasted tracks effectively improve the geometric smoothness and the structural stability. Specifically, the high geometry quality of the non-ballasted track structures such as the one on the Wuhan–Guangzhou high-speed railway line is essential to achieve good ride comfort of a high-speed train. The track spectrum of China’s 300–350 km/h railway lines with non-ballasted track structures is given here.
Based on the measured data of the high-speed track geometries through a track inspection train, the average spectrum of track irregularity can be obtained by piecewise fitting with a power function, which is expressed as [Citation8]
where the unit of S(f) is mm2/(1/m); f is spatial frequency (1/m); A and n are fitting coefficients.
Four sections are used to describe the entire spatial frequency range of the spectrum. The frequencies at each point connecting the adjacent two sections are listed in . gives the fitting coefficients of Equation (1) for each section.
Table 3. Spatial frequencies at points connecting the adjacent two sections (unit: 1/m).
Table 4. Fitting coefficients in Equation (1) for the average spectrum of Chinese high-speed railway non-ballasted track.
As examples, the typical track spectra of rail alignment irregularity and rail vertical irregularity are displayed in . Compared with the German high-speed track spectrum, the power spectrum densities shown in are distinctly smaller, indicating higher geometry quality of the non-ballasted tracks in China’s high-speed railways.
Figure 3. Track spectra of (a) rail alignment irregularity and (b) rail vertical irregularity for the Chinese high-speed railway non-ballasted track.
2.2. Test methods for high-speed EMU vibration
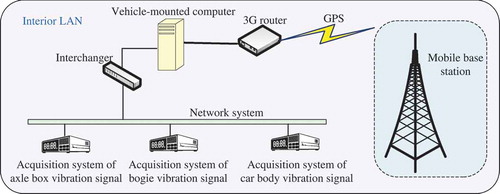
In order to acquire the train vibration data, the detection system was established by the integrated networking approach, including the data acquisition subsystem, the data transmission and the data storage devices. In , the system consists of the vehicle-mounted computer, 3G router, Global Positioning System (GPS) module, interchanger and data acquisition unit. As the terminal control unit, the vehicle-mounted computer controls the entire test system through the local area network (LAN) in the vehicle. The data acquisition unit acquires the vibration signals from sensors and sends data to the vehicle-mounted computer by the network and interchanger. GPS module is used to measure the train speed and feedback the operation time, and send this information to the vehicle-mounted computer by a 3G router.
Figure 4. Vibration measuring system of high-speed train.
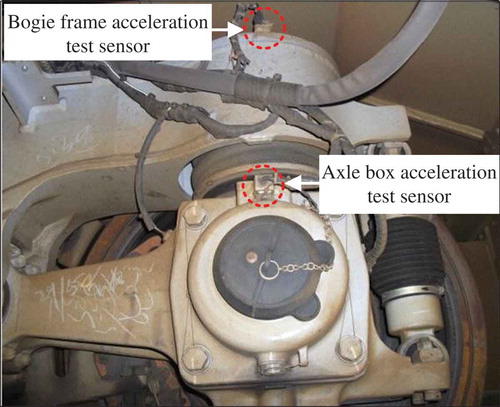
The data acquisition unit was connected with the sensors mounted on the tested components of the vehicles. Taking the trailer car as an example, and show the on-site photos of different sensors installed on the corresponding components. Car body acceleration sensor is installed on the lower surface of car body floor (), and the frame acceleration sensor is fixed on the top surface of bogie frame near the primary suspension (), the axle box acceleration sensor is installed on the upper side of the axle box end cover (). In order to obtain the vehicle vibration characteristics in a wide frequency range, the sampling frequency of the axle box acceleration sensor is set to be 5000 Hz while others are 2000 Hz.
Figure 5. Arrangement of vibration measuring sensor for car body.
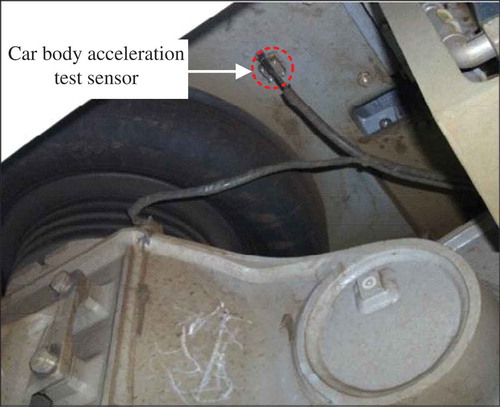
Figure 6. Arrangements of vibration measuring sensors for bogie frame and axle box.
3. Vibration characteristic and running stability of high-speed vehicle
3.1. Vibration characteristics of high-speed vehicle system
The vibration status of the main components in high-speed EMU system can be obtained by the on-track test on the actual line in operation. The dynamic performance of the high-speed vehicle, such as the ride comfort and the running stability, can then be evaluated. As examples, a group of typical results of vibration accelerations of the car body, the bogie frame and the axle box measured at train speed of 350 km/h is discussed.
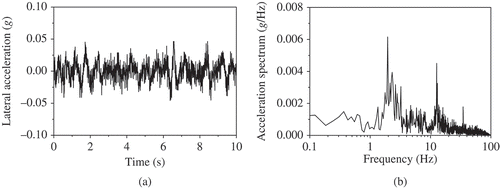
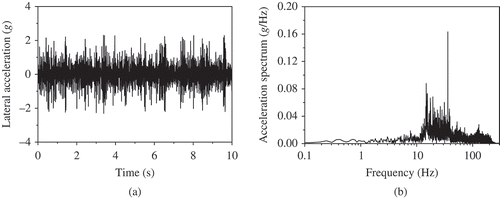
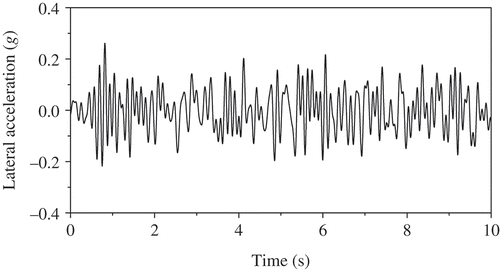
and show the test results of the vertical and the lateral acceleration responses of the car body, respectively. Both the results in time and frequency domains are displayed in the figures. As shown in (a), the peak value of the car body vertical acceleration is less than 0.075 g (g = 9.8 m/s2). It is indicated in (b) that there are three distinct dominant frequencies in the vertical vibration of the car body. The first main frequency is near 1 Hz, which represents the natural vibration frequency of the car body’s vertical suspension. The second main frequency is about 10 Hz, close to the first-order natural vibration frequency of the car body vertical bending. The third main frequency is 34 Hz, which reflects the forced vibration induced by the excitations from the wheel, such as the first-order out-of-round of the wheel, wheelset dynamical unbalance, local defects in wheel profile and other possible factors. shows that the lateral vibration acceleration of the car body is usually less than 0.05 g. There also exist three distinct dominant frequencies. The first main frequency is 1.9 Hz, which is determined by the natural vibration frequency of suspension system. The second one is 13 Hz, corresponding to the natural frequency of the car body torsional vibration. The third one is 34 Hz, which indicates that the forced vibration induced by wheel perimeter also affects the car body’s lateral vibration. In short, the car body works at a low vibration level when the train runs at high speed. Both its vertical and lateral accelerations are far less than the limit of 2.5 m/s2 defined by the Code for Testing of High-Speed Electric Multiple Unit on Completion of Construction [Citation9]. It indicates that the high-speed train can be in service with excellent ride comfort. A significant reason is the high geometry quality of the non-ballasted track on the Wuhan–Guangzhou high-speed railway line.
Figure 7. Test results of car body vertical acceleration at train speed of 350 km/h: (a) time history and (b) frequency spectrum.
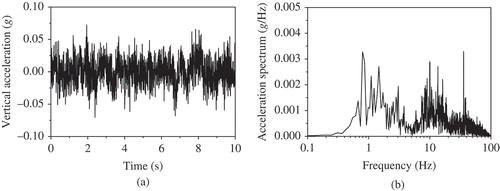
Figure 8. Test results of car body lateral acceleration at train speed of 350 km/h: (a) time history and (b) frequency spectrum.
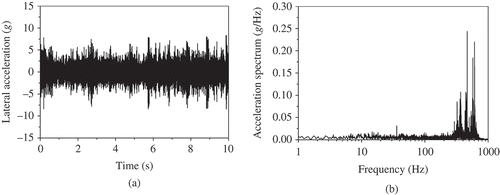
and are the measured results of the vertical and the lateral vibration accelerations for the bogie frame, respectively. It can be found in that the bogie frame vibrates more violently than the car body in vertical direction. Its vertical vibration acceleration varies within the range of ±2.5 g. In the frequency domain, the vibration energy distributes mainly in the range of 15–35 Hz which contains the low-order elastic modal frequencies of the bogie frame. Especially, the forced vibration induced by the wheel perimeter dominates a large component at 34 Hz. indicates that the maximum value of the lateral acceleration in bogie frame is also less than 2.5 g, and its main frequencies are similar to those of the vertical vibration.
Figure 9. Test results of bogie frame vertical acceleration at train speed of 350 km/h: (a) time history and (b) frequency spectrum.
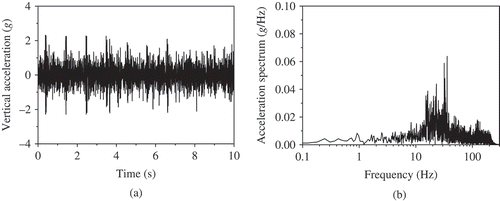
Figure 10. Test results of bogie frame lateral acceleration at train speed of 350 km/h: (a) time history and (b) frequency spectrum.
The time history of the axle box vertical acceleration and its corresponding frequency spectrum are shown in , and those of the axle box lateral acceleration are displayed in . It can be seen from that during full-speed operation the axle box vibrates strongly and the peak value of its vertical acceleration is approximately 13 g. Due to the large contact stiffness between the wheel and the rail, the high-frequency contact vibration in wheel–rail interface excited by the track irregularity is liable to be transmitted to the axle box. The vertical vibration distributes in a wide frequency range below 700 Hz, which covers two distinct dominant frequency ranges. The first one is the frequency range of 30–50 Hz, which is mainly related to the vibrations induced by wheel perimeter and the elastic vibration of the bogie frame. The second one is the high frequency range of 350–500 Hz, which reflects the high-frequency Hertzian contact vibration occurring in the wheel–rail interface, as well as the elastic vibration of the wheelset. As shown in , the axle box lateral vibration is weaker than its vertical vibration (). The lateral vibration energy mainly distributes in the frequency range of 290–650 Hz. The vibration acceleration below 290 Hz is much lower, and there is a very small peak value at 34 Hz, which indicates that the periodic excitation caused by wheel perimeter also affects the axle box lateral vibration.
Figure 11. Test results of axle box vertical acceleration at train speed of 350 km/h: (a) time history and (b) frequency spectrum.
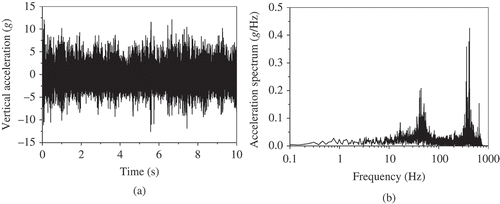
Figure 12. Test results of axle box lateral acceleration at train speed of 350 km/h: (a) time history and (b) frequency spectrum.
The aforementioned on-track test results demonstrate that when the vibration is transmitted upwards from the wheel–rail interface, both the vertical and the lateral vibration amplitudes of the axle box, the bogie frame and the car body decrease successively. The primary and secondary suspension systems effectively attenuate the vibrations. The vibration attenuation ratio from the axle box to the bogie frame is in 1/3–1/5, while that from the bogie frame to the car body is in around 1/10 level. The high-frequency vibrations of the bogie frames and the car body above 50 Hz are effectively suppressed.
3.2. Evaluation of high-speed vehicle running stability
The stability of a high-speed vehicle running on an actual track can be evaluated using the tested response of lateral vibration acceleration of the bogie frame mentioned earlier. The basic principle is, by monitoring the vibration acceleration responses of the bogie frame, to evaluate whether a continuous lateral oscillation of the bogie can decay or not. The evaluation method of vehicle running stability is explicitly given in the Code for Testing of High-Speed Electric Multiple Unit on Completion of Construction [Citation9] and UIC 515 [Citation10]. By applying 10 Hz low-pass filtering to the measured lateral acceleration signal of the bogie frame, the vehicle running stability could be evaluated through determining whether there are six or more successive peaks of the acceleration responses whose value exceeds 8–10 m/s2. If it is the case, the vehicle is regarded as losing its stability.
The acquired acceleration waveform shown in is obtained by applying a 10 Hz low-pass filtering to the time history of the bogie frame lateral acceleration in (a). After filtering, the maximum acceleration is far less than 8 m/s2, which indicates that this type of high-speed EMU has the excellent hunting stability running at the speed of 350 km/h based on the evaluation method.
Figure 13. Lateral acceleration time history of bogie frame after 10 Hz low-pass filtering.
4. Wheel profile wear and train vibration performance under long-term operation
Generally, a newly produced high-speed train can run stably, safely and comfortably at the initial stage on a new railway line because of the good conditions of both the vehicle equipment and the track geometry. However, it is also an important issue to explore whether the high-speed EMU dynamic performance will be changed by the deterioration of track geometries, wear of wheel and rail profiles as well as the aging of vehicle equipment under long-term operation condition. Therefore, the long-term tracing test for EMUs is carried out. In this section, the EMU service performance between 120,000 and 240,000 km service distance is analysed, focusing on the evolution of the wheel profile wear and the train vibration performance at operation speed of 350 km/h.
4.1. Wheel profile evolution of high-speed train
The wheel wear is investigated first. The most worn wheel in the test train is chosen for analysis. compares the worn wheel profiles for different travelling distances. shows the wear distribution along the wheel width for different travelling distances. It can be learnt from both the figures that the main wear region on the wheel tread concentrates on the adjacent area ranging from −20 to 20 mm around the nominal rolling circle. This region is the main contact region between the wheel and the rail. With the increase of the travelling distance, the wheel wear in this region aggravates gradually. The maximum wear increases from 0.34 to 0.72 mm when the running distance changes from 83,000 to 192,000 km, as shown in . The region of the wheel profile near the nominal rolling circle presents an obvious concave shape, which substantially impacts the wheel–rail contact geometry and eventually affects the dynamic performance of high-speed EMU in service.
Figure 14. Comparison of measured wheel profiles for different travelling distances.
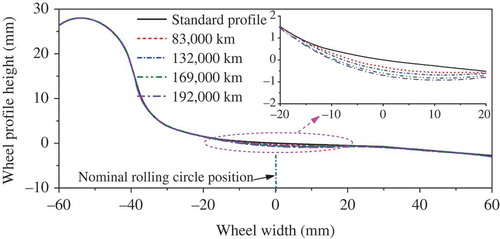
Figure 15. Comparison of measured wheel wear depth for different travelling distances.
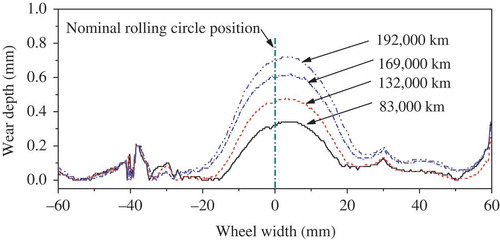
It should be noticed that the wheel wear has reached the limit regulated by Railway Electric Multiple Units Operation and Maintaining Regulation [Citation11] after travelling about 210,000 km, and the wheel tread of the tested EMU is required to be re-profiled at that time.
4.2. Long-term vibration performance of high-speed train
What will happen to the vibration performance of a high-speed train in long-term operation conditions? Whether will the vehicle ride comfort and the running stability deteriorate? How effective will the wheel re-profiling be in improving the dynamic behaviour of the high-speed vehicle system? These are very important questions not yet well explained and should be answered based on the long-term data collection of on-track detection technology.
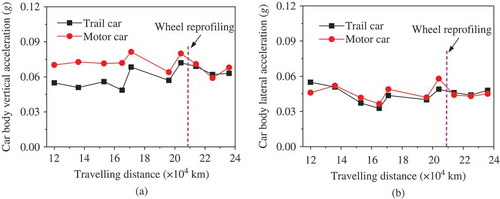
Based on the long-term test data, the vibration property evolutions of motor car and trail car at the speed of 350 km/h are analysed. reflects the varying pattern of car body vibration acceleration with the increasing travelling distance. In general, the car body vibration acceleration shows little change, which means that the ride comfort do not deteriorate in a substantial way over the test period. The maximum value of car body vertical acceleration in the motor car is 0.081 g, a bit higher than that in trail car (0.072 g). The maximum values of car body lateral accelerations in the motor car and trail car are 0.058 g and 0.055 g, respectively, which are almost the same. After the wheel re-profiling, the wheel–rail contact geometry is improved and influence of the excitation induced by the wheel wear is reduced. Therefore, the car body vibration acceleration decreases to some extent. Additionally, the Sperling index that represents the ride comfort is analysed. The maximum values of the vertical and lateral Sperling indices of the trail car are 2.08 and 1.98, respectively, while those of the motor car are 2.1 and 2.07. Therefore, the ride comfort of the EMU train reaches the “excellence” range.
Figure 16. Evolution of (a) vertical and (b) lateral car body accelerations versus travelling distance (v = 350 km/h).
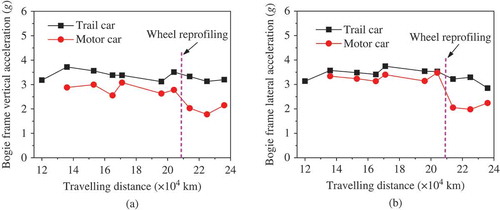
The vibration acceleration evolutions of the bogie frames in EMU are shown in . The maximum values of both the vertical and the lateral vibration accelerations are within 1.5–4 g, and they vary slightly as the travelling distance increases. The vertical and lateral accelerations of the trail car bogie frame are a bit larger than the corresponding values of the motor car. After wheel re-profiling, the vibration acceleration of the bogie frame decreases, especially for the motor car bogie frame. For example, the average values of the vertical and lateral accelerations of the motor car bogie frame decrease by 29% and 36%, respectively, after the wheel re-profiling.
Figure 17. Evolution of (a) vertical and (b) lateral bogie frame accelerations versus travelling distance (v = 350 km/h).
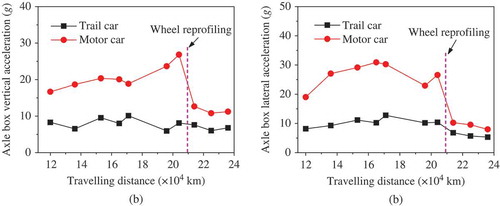
describes the variation tendency of the axle box vibration acceleration with the increasing travelling distance. It can be seen that the maximum values of the vertical and lateral vibration accelerations for the motor car axle box are 27 g and 31 g, respectively, while those for the trail car axle box are 10 g and 12 g. Comparing with the trail car, the motor car axle box vibrates more strongly. This is because the wheelset of the motor car needs to transmit the traction force, and simultaneously it is also affected by the vibrations of motor, gear box and other devices synthetically. The vibration level of the motor car axle box can be effectively reduced by wheel re-profiling. For instance, the average values of the vertical and lateral vibration accelerations for the motor car axle box are 21 g and 26.6 g, respectively, before the wheel re-profiling, while these values decrease to 11.6 g and 9.3 g after the wheel re-profiling, where the reduction percentages are about 44% and 65%, respectively.
Figure 18. Evolution of (a) vertical and (b) lateral axle box accelerations versus travelling distance (v = 350 km/h).
In summary, the CRH2C EMU has the excellent dynamic performance under the long-term operation conditions when it runs on the non-ballasted track at the speed of 350 km/h.
5. Conclusions
By carrying out an on-track test on dynamic performance of the CRH2C high-speed EMU running on the non-ballasted track, both the vibration characteristics and the vibration performance of the train at the speed of 350 km/h are obtained.
The car body is dominated by the low-frequency vibration. Its dominant frequencies of the vertical vibration mainly include the natural frequency of suspension system at about 1 Hz, the natural frequency of the car body elastic vibration around 10 Hz and the forced vibration at 34 Hz induced by wheel perimeter. The dominant frequencies of the car body lateral acceleration mainly contains the natural frequency of suspension system at 1.9 Hz, the natural frequency of the car body torsional vibration at about 13 Hz and the forced vibration at 34 Hz.
The vibration energy of the EMU bogie frame largely concentrates on the low-frequency range of 15–35 Hz. After the low-pass filtering of 10 Hz, the lateral vibration acceleration of the bogie frame fully satisfies the evaluation criterion of running stability.
The dominant frequencies of the axle box vertical vibration distribute in the low-frequency range of 30–50 Hz and high-frequency range of 350–500 Hz, while the energy of the axle box lateral vibration mainly exist in 290–650 Hz. The high-frequency vibration is primarily related to the wheelset elastic vibration.
Vibration acceleration amplitudes of the EMU components decrease upwards successively. The vibration attenuation ratio from the axle box to the bogie frame is within 1/3–1/5, while that from the bogie frame to the car body is in around 1/10 level. Comparing with the axle box, the high-frequency vibrations of the bogie frame and the car body above 50 Hz are effectively suppressed.
In the wheel width direction, the main wear region of the EMU wheel profile is located in the range of ±20 mm relative to the position of the nominal rolling circle. The maximum wear depth of the wheel profile exceeds 0.7 mm, which reaches the limit value when the EMU travelling distance is up to 210,000 km. After the wheel re-profiling at that moment, the vibration accelerations of components decrease at different degree. Especially the vertical and lateral vibration accelerations of the motor car axle box have the most significant reduction, which decreased by 44% and 65%, respectively.
When the CRH2C EMU runs at the speed of 350 km/h for a specific period, both the vertical and lateral ride comfort can maintain at excellent levels without noticeable deterioration. Simultaneously, the lateral acceleration amplitude of the bogie frame fluctuates in a relative small range with the increasing travelling distance, which indicates the high-speed EMU can maintain its lateral running stability on the CRTS-I double-block non-ballasted track.
Acknowledgements
The authors would like to thank all the students involving in the on-track test from State Key Laboratory of Traction Power at Chengdu, China.
Additional information
Funding
References
- Stow J, Andersson E. Field testing and instrumentation of railway vehicles. In: Iwnicki S, editor. Handbook of railway vehicle dynamics. London: Taylor & Francis; 2006. p. 423–456.
- Sugahara Y, Kazato A, Koganei R, Sampei M, Nakaura S. Suppression of vertical bending and rigid-body-mode vibration in railway vehicle carbody by primary and secondary suspension control: results of simulations and running tests using Shinkansen vehicle. Proc Inst Mech Eng, Part F: J Rail Rapid Transit. 2009;223:517–531. doi:10.1243/09544097JRRT265.
- Konowrocki R, Bajer C. Vibration due to the passage of a railway vehicle on straight and curved track. In: XXIII Symposium – Vibrations in Physical Systems. Poznań: Agencja Reklamova COMPRINT; 2008. p. 199–204.
- Ribeiro D, Calçada R, Delgado R, Brehm M, Zabel V. Finite-element model calibration of a railway vehicle based on experimental modal parameters. Vehicle Syst Dyn. 2013;51:821–856. doi:10.1080/00423114.2013.778416.
- Gasparetto L, Alfi S, Bruni S. Data-driven condition-based monitoring of high-speed railway bogies. Int J Rail Transp. 2013;1:42–56. doi:10.1080/23248378.2013.790137.
- Zhai W, Wang S, Zhang N, Gao M, Xia H, Cai C, Zhao C. High-speed train–track–bridge dynamic interactions – Part II: experimental validation and engineering application. Int J Rail Transp. 2013;1:25–41. doi:10.1080/23248378.2013.791497.
- Zhai WM. Vehicle-track coupled dynamics [in Chinese]. 4th ed. Beijing: Science Press; Forthcoming 2015.
- Kang X, Liu XB, Li HY, Yang F, Gao JM, Zhai WM. PSD of ballastless track irregularities of high-speed railway [in Chinese]. Sci Sin Tech. 2014;44:687–696. doi:10.1360/N092014-00088.
- The Bureau of Transportation. Code for testing of high-speed electric multiple unit on completion of construction [in Chinese]. Beijing: Ministry of Railways of the People’s Republic of China; 2008.
- UIC Kodex 515. Reisezugwagen Laufwerke (1), 2. Ausgabe. Paris: UIC; 1984.
- TG/CL 127-2013. Railway electric multiple units operation and maintaining regulation [in Chinese]. Beijing: China Railway Corporation; 2013.