Abstract
An expression for sizing loose rock riprap placed around bridge piers is derived based on an evaluation of moments that resist and promote overturning of a single rock particle, on an elementary potential flow theory which provides models of velocities around piers of various cross-sectional shapes, and on widely accepted empirical relations and coefficients used to calculate shear stresses acting on rock riprap and the critical values of shear stress at which rock is moved. Minimum diameters of stable rock riprap given by the analytical relation for circular columns compare favorably with measured values collected in three experimental studies carried out by others. Theoretical shape factors, which are multiplied times the stable rock size needed for a circular column of the same width, were found for piers having square ends and for piers having sharp ends with interior nose angles of 60°, 90°, and 120°. A safety factor that provides a suitable margin of error needed for design is found by comparing calculated and measured rock sizes for both round-nosed and square-nosed pier experimental data. Comparison of predictions from the developed equation to those from other formula shows that the approach clearly delivers more desirable design estimates of stable riprap diameter. Notwithstanding its simplicity, the relation provides sound theoretical insights to the important parameters affecting stability of loose rock riprap used to protect bridge piers.
Introduction
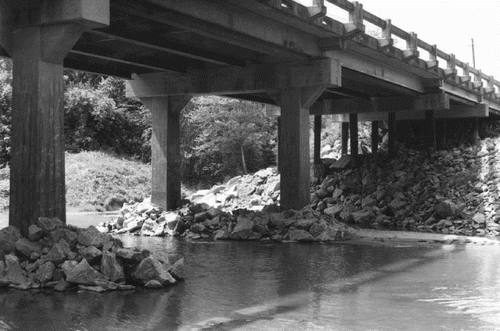
The most widely used method today for protecting bridge piers against local scour consists of placing loose stones on the surrounding streambed (Parker et al. Citation1998, p. 4; Lagasse et al. Citation2007, p. 14), as shown in . However, the practice is far from being new. Although Ancient Romans used crib-like cofferdams to place pozzolanic concrete footings below water, their pumps were not adequate to sink foundations to any considerable depth. For this reason, they often surrounded piers with rock riprap (De Camp Citation1974, p. 205), making up for weaknesses by building both foundations and piers extremely large. However, as Gest (Citation1930, p. 159) explains, this practice aggravated the danger by diminishing the waterway areas, thereby increasing water velocities during floods and the potential for erosion. As a result, the method was not always successful, as noted by the Roman architect and engineer Marcus Vitruvius Pollio (commonly known as Vitruvius) who reported that “it was not enough to dump loose rock about the foundations because the current was likely to burrow beneath and undermine the heaviest structure” (Kirby et al. Citation1956, p. 69).
Figure 1. Riprap mounded around two bridge piers to prevent scour.
In spite of Vitruvius’ reservations about its use, on-site studies of seven modern bridges, at which loose rock riprap had been installed as a pier scour countermeasure, led Nece Citation(1974) to conclude that the method generally works well, with little loss or subsidence of the placed stones if the riprap is sized and installed properly. However, the technique is not without its drawbacks. In addition to Nece Citation(1974), both Klingeman Citation(1973) and Piésold (Citation1991, p. 243) note that under some circumstances placement of a riprap blanket around a bridge pier promotes erosion around the edges of the armored zone, which can cause the riprap covering to fail if the channel deepens enough in the unprotected areas between piers. Chiew Citation(2004) found if enough loose riprap was placed around a pier in degrading channels it would eventually develop into a stable protective mound as the surrounding streambed lowered and the bed shear stresses were reduced.
Based on small-scale experimental studies, Parola Citation(1993), Chiew (Citation1995, Citation1997), Chiew and Lim Citation(2000), and Unger and Hager Citation(2006) all describe various ways in which riprap protection at bridge piers can fail. Melville and Coleman (Citation2000, p. 350) summarize the findings of several studies by identifying the following four pier riprap failure mechanisms:
(1) Shear failure caused by stones not being able to resist the hydrodynamic forces imparted by the streamflow. | |||||
(2) Winnowing failure caused by erosion of underlying soils through the porous protective layer from the effects of flow turbulence and seepage. | |||||
(3) Edge failure caused by erosion at the periphery of the riprap apron which does not extend far enough horizontally to prevent scour and which is not capable of deploying and armoring the slopes of the resulting scour hole. | |||||
(4) Bed-form undermining caused by dunes migrating past the protective layer and eroding beneath the edge of the apron, which, as for edge failure, is not capable of armoring the exposed slopes leading to the dune troughs. | |||||
Satisfactory filters that prevent winnowing of soils, along with rock covers of sufficient extent and thickness that armor surrounding stream beds automatically as they erode, are essential design elements needed for a successful riprap armoring system. However, here the center of interest is the size of rock needed to prevent shear failure. Based largely on potential flow theory, a rational expression is developed for calculating the representative diameter of stable loose stone placed around bridge piers. Stability is determined from the ratio of static moments resisting and promoting overturning of a single rock particle, which defines a safety factor. Flow velocities and the shear stresses they produce are found from a combination of empirical relations and theoretical solutions of two-dimensional flow fields. The resulting expression for stable rock diameter is then tested and compared with existing formulae using small-scale experimental data obtained from three previous studies carried out by others.
Experimental data
Experimental data collected in small-scale laboratory channels by Quazi and Peterson Citation(1973), Rothwell and Bohan Citation(1974), and Parola Citation(1993) are used to evaluate the riprap sizing formula developed here, and to compare it with formulae developed by others. In each of the three experimental studies, protective covers of loose rock riprap were placed around cylindrical columns representing bridge piers. The laboratory channels all had rectangular cross-sections of constant shape with solid beds, and the riprap was modeled using crushed, angular gravel. All tests were carried out with gravel placed in horizontal layers that surrounded the model piers completely. Although differences in thickness and lateral extent of the riprap layers, and the duration of experiments, leads to some inconsistencies between data, the assemblage comprises a valid and useful means of testing the theoretical formulations that are developed, and for comparing results of expressions developed by others for sizing loose rock riprap to protect bridge piers.
All of the experiments were carried out using a procedure in which applied hydraulic loads were increased by small amounts until failure occurred. The hydraulic loads were varied by changing flow rates, adjusting downstream water levels, or by some combination of flow rate and water level changes. Failure (that is, riprap displacement) occurred at some applied load, which, because of the incremental increases, was always larger than the true failure load. How much larger depends on the size of the load increments. Presumably, the researchers made sure that their load increments were small so that any differences between the true and the reported failure conditions were insignificant. Information collected from experiments using cylindrical piers having circular cross sections or cross sections with semi-circular upstream and downstream ends is summarized in . Those data from experiments using square-nosed piers having rectangular cross-section are presented in . Tabulated data include the following items: pier width b, pier length ℓ, median diameter of the rock mixture D 50, the approach flow depth y a located a short distance upstream from the pier, and the depth-averaged approach flow velocity V a.
Table 1. Experimental riprap data for round-nosed model piers aligned with approach flow.
Table 2. Experimental riprap data for square-nosed model piers aligned with approach flow.
Rock particle stability
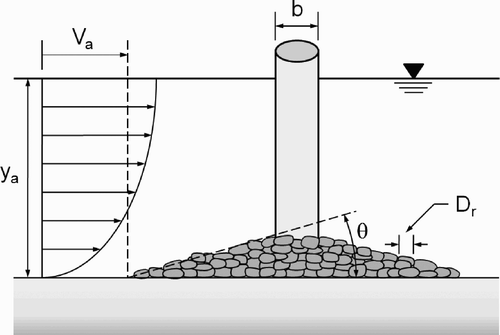
The general problem of protecting a pier with riprap and the related variables is illustrated in . Although shown mounded around a pier, Engels (Citation1929, p. 92–93), based on laboratory experiments carried out more than a century ago, found that rock riprap placed in a level cover layer that is flush with or below the streambed provides more reliable protection.
Figure 2. Illustration of the general pier riprap design problem.
The ratio of static moments resisting and promoting overturning of a single rock particle on the side of a riprap mound defines the stability safety factor f s. For small longitudinal channel and water-surface slopes, Froehlich (Citation2012, Citation2013) calculates f s as follows:
Derivation of EquationEquation (1) departs from the conventional approach, which is described by Stevens and Simons Citation(1971), Stevens et al. Citation(1976), and Julien (Citation1998, p. 121–126), because the buoyant force is not subtracted from the gravitational force to obtain the submerged weight of a particle, which is considered to be a de-stabilizing force. Instead, the buoyant force is treated separately, and it is split into distinct components that resist and promote overturning, similar to the conventional treatment of submerged particle weight. A consistent stability factor, which has an upper limit of S
r, results when gravitational and buoyant forces are taken into account in this manner. As a result, the upper bound of f
s increases in a logically consistent manner as ρ decreases in comparison to ρr (for example, if the surrounding fluid were air instead of water).
A relation for τ needed to calculate the size rock that will resist overturning moments is provided by Manning's formula (Chow Citation1959, p. 98), which is uncomplicated and accepted widely. Bed shear stress for flows in wide channels is then found as
The shape and angularity of rock are also factors that affect particle stability and flow resistance. Coarse, angular rock, usually made by crushing or blasting, or from scree, is more resistant to hydrodynamic forces than round river rock. Effect of rock angularity is accounted for by specified values of the mass angle of repose ϕr, which is larger for angular rock than rounded rock (Simons & Sentürk Citation1977, p. 442). Froehlich Citation(2011), based on data from 74 stockpiles of dumped natural and crushed rock, found that ϕr depends primarily on rock particle angularity and, to lesser extents, on the gradation and the median particle diameter of a stone mixture. Considering rock particle angularity alone, Froehlich Citation(2011) shows that
Potential flow around bridge piers
Calculation of ηo by EquationEquation (8) requires an appropriate velocity in the vicinity of a pier. Here V is estimated using theoretical expressions for two-dimensional, incompressible, inviscid, irrotational flow (that is, potential flow) about solid bodies. For some simple body shapes, such as circles, comparatively uncomplicated analytical solutions are possible. While such solutions have always been of interest as illustrative examples of potential flow, they are also of practical use because they provide theoretical insights into the principal factors that affect hydrodynamic processes. However, for completely general bodies even potential flow solutions are not easy, and one often needs to rely on numerical solutions of the governing partial differential equations.
From elementary potential flow theory (White Citation1994, Chapter 8) for plane flow in x−y coordinates where the effects of molecular and turbulent viscosity are neglected, a stream function ψ exists such that
Circular cylinder in unbounded uniform flow
A classic problem in potential flow theory is that of steady flow around a fixed circular cylinder placed in an unbounded uniform flow having an approach velocity V a in the positive x direction. The stream function for this case is (Milne-Thomson Citation1960, p. 154)
The maximum theoretical velocity along the boundary of a circular cylinder occurs where δ=90°, and is twice the uniform flow velocity. Breusers and Raudkivi Citation(1991) and Hoffmans and Verheij (Citation1997, p. 125) developed relations for the size of riprap needed to protect bridge piers based on V=2×V
a. However, from EquationEquation (11), fluid speed drops comparatively quickly along the δ=90° radius, becoming V=10/9×V
a a distance b from the cylinder surface. Recognizing that the average velocity acting over a rock placed adjacent to a pier will be less than the maximum value at the boundary of a circular cylinder given by potential flow theory, Graziano and Jones Citation(1990) use V=1.5×V
a to size pier riprap.
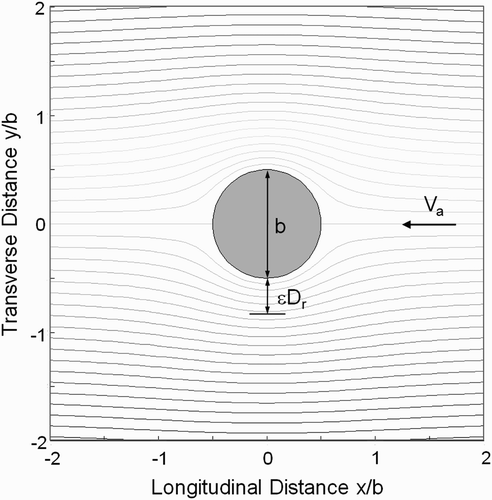
A circular cylinder in an unbounded uniform flow is used as an elementary bridge pier against which solutions for piers under other conditions and of other shapes will be compared. The potential flow stream function gives the average velocity within a distance (r−b/2) adjacent to a circular cylinder as V¯=[ψ (r)−ψ (b/2)]/(r−b/2). The maximum average velocity within a distance r=ϵ D r adjacent to a column of circular cross-section in a uniform flow as shown in occurs along the δ=90° radius and is calculated as
Figure 3. Streamlines around a single unbounded circular column in a uniform flow of velocity V a. Average velocity V¯ is calculated over a distance ϵ D r as shown.
Combining EquationEquations (1), Equation(7)
, Equation(8)
, and Equation(12)
gives, after some rearrangement, the following analytical expression for the stable value of D
r at the base of the circular pier:
For θ=0° (that is, for a horizontal bed), β=90°, and the factor K
r given by EquationEquation (14) reduces to
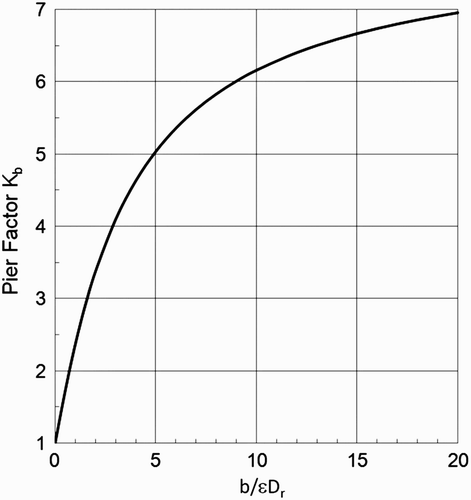
Figure 4. Pier factor K b as a function of b/ϵ D r.
Comparison of calculated and measured stable diameters at round-nosed piers
To test EquationEquation (13) for circular cylindrical piers, calculated values of D
r/y
a are compared with measured values obtained from the assembled experimental data. Although the model pier in tests carried out by Quazi and Petersen (1973) was not circular, instead having semi-circular upstream and downstream ends and a length-to-width ratio of 2.5, flow patterns around the nose, where riprap size is critical, are close to those for circular piers as long as the pier and the flow are aligned. For this reason, these measurements are included in the comparison.
Using the widely accepted coefficients (a value that applies to low turbulence levels such as those in the experimental studies) and k
n
=0.145, and setting f
s=1 and ϵ=1, values of D
r/y
a given by EquationEquation (13)
for round-nosed piers are compared with measured values in . With f
s=1, the calculated values are intended to provide the expected value of D
r that is just stable. The root mean square error of the predicted values of D
r/y
a is 0.0264, and the coefficient of determination of the relation is 0.841. The fit is notably good with errors randomly distributed over the entire range of values, as shows.
Figure 5. Comparison of calculated and measured values of relative diameters of stable rock riprap placed around columns of circular cross-section in small-scale experiments.
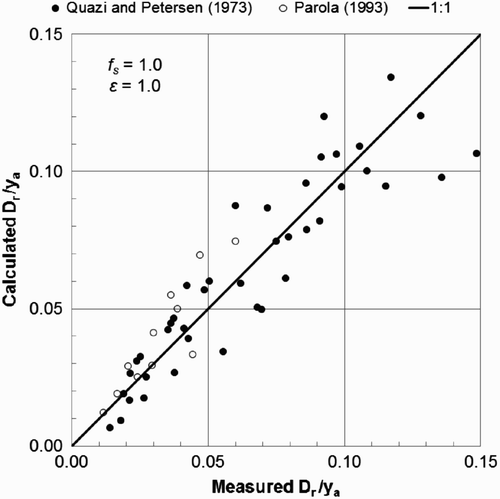
The ability of EquationEquation (13) to predict stable rock sizes as well as it does is not unexpected. The potential flow theory provides a reasonable approximation of the flow field around cylinders away from the boundary layer. Combining this flow solution with widely used empirical relations for critical shear stress and flow resistance that are well documented and thoroughly tested yields a good estimate of stable riprap diameter for the model pier. Although minor improvement of the predictions can be gained by adjusting the values of
, k
n
, and ϵ slightly, the widely accepted measures of τco* and k
n
, are relied upon, along with a value of ϵ that can be reasoned easily.
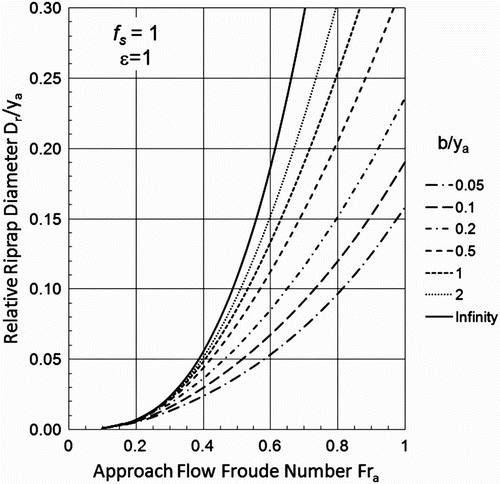
In spite of its simplicity, EquationEquation (13) provides insights to important parameters that affect riprap stability at bridge piers. For example, the ratio of pier width to approach flow depth b/y
a in small-scale experimental studies generally can be varied within only a small range. For this reason, the influence of large and small values of the ratio on rock stability is difficult to explain based on empirical studies alone. The effect of pier width on rock diameter is shown theoretically by writing EquationEquation (15)
in terms of the ratios D
r/y
a and b/y
a as follows:
For a fixed value of V
a, EquationEquation (17) shows that D
r increases with b, reaching a maximum for extremely wide piers where the largest average velocity acting on rock particles adjacent to the piers will approach twice the approach flow velocity. Solutions for D
r/y
a as a function of Fr
a and for a range of b/y
a given by EquationEquation (13)
with f
s=1 and ϵ=1 are shown in . Because of the presence of the ratio D
r/y
a in EquationEquation (17)
, solution of EquationEquation (13)
requires iteration, but the influence of Froude number is damped significantly when the value of b/y
a is small. The stable rock diameter approaches the value needed in uniform flow without a pier as b/y
a→0, exactly as it should.
Figure 6. Minimum relative stable riprap diameter D r/y a as a function of approach flow Froude number Fr a and relative pier width b/y a.
Supplementary potential flow solutions
Further application of potential flow solutions allows additional conditions that affect riprap stability to be taken into account. In the following sections, analytical expressions are developed that evaluate the influences of lateral velocity gradients of the approach flow and the presence of nearby piers.
Single cylinder in slight cross-flow shear
If the flow approaches a single column with a small constant vorticity or shear such that ∂ v/∂ x−∂ u/∂ y=ω, then, if v=0 everywhere, the transverse velocity gradient ∂ u/∂ y=−ω. The stream function for this situation is given by Milne-Thomson (Citation1960, p. 184) as
The shear flow adjustment factor K ω is graphed as a function of Ω for several values of the ratio b/D r in . When the cross-flow gradient or vorticity ω=0 (that is, when the approach flow is uniform and aligned with the pier), then K ω=1, as expected. As b increases, the effect of shear flow on riprap size increases as well, which one would reason intuitively since the maximum increase in velocity at the side of the pier would also be larger. Cross-flow shear may be particularly significant at piers located in river bends, or at bridge piers near river banks where large lateral velocity gradients are likely to be present.
Figure 7. Cross-flow shear factor K ω as a function of cross-flow shear parameter Ω=ω b/V a and relative pier width b/D r.
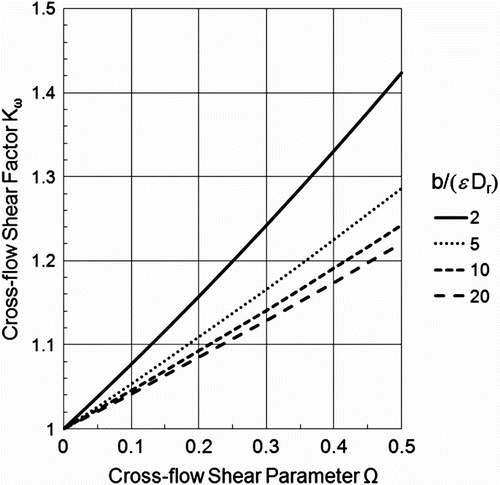
Modern bridge hydraulic engineering design relies on inexpensive, readily available, and extremely powerful computing capabilities along with advanced software applications to evaluate complex hydraulic conditions at bridge sites. For example, the Federal Highway Administration's two-dimensional depth-averaged flow and sediment transport model FST2DH (Froehlich Citation2003) provides highly detailed descriptions of flow fields from which velocity gradients and vorticity can be determined easily.
Equally spaced cylinders in uniform flow
Bridges spanning large floodplains are sometimes built with many equally spaced piers formed from cylindrical column bents. If the piers are located close together, velocities near the leading columns will be greater than around a single cylinder in a uniform flow because water will need to pass through slightly smaller areas. An approximate stream function for an infinite row of circular cylinders of diameter b, spaced a distance p between centers, and aligned perpendicular to a uniform flow is given by Streeter (Citation1948, p. 117) as
The following expression for the diameter of stable rock riprap for equally spaced circular piers placed normal to a uniform approach flow is found by combining EquationEquations (1), Equation(7)
, Equation(8)
, and Equation(24)
:
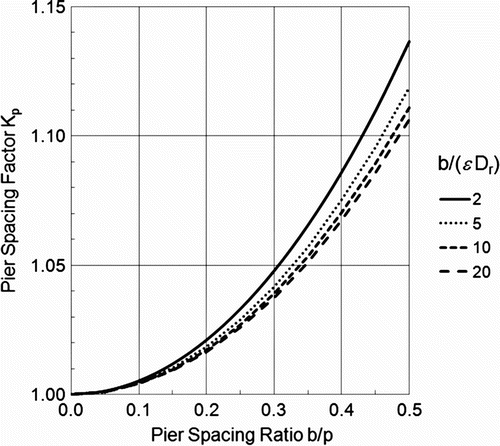
is a factor that accounts for the effect of adjacent pier proximity. The pier-spacing adjustment factor K p is graphed in as a function of b/p for several values of the ratio b/ϵ D r. When the spacing p is large in comparison to pier diameter (that is, as b/p→0) the factor K p approaches one, as expected. However, even when piers are rather close together the influence of spacing is not particularly great. For example, if the spacing between pier centers p=2b, giving b/p=0.5 (that is, piers that are very close together), the minimum stable rock diameter increases by less than 15%.
Figure 8. Pier-spacing factor K p as a function of the pier-spacing ratio b/p and relative pier width b/D r.
Pier shape factors
Particle stability at cylindrical piers having cross-section shapes other than circular is the next factor to consider. Piers having rectangular cross-sections with noses that are either square (square-nosed) or pointed (sharp-nosed) are common. Because normalized rock diameters needed to create stable riprap covers given by EquationEquation (13) depend on the cubed value of the average velocity acting over a distance ϵ D
r adjacent to a pier, adjustment coefficients that account for piers having cross-section shapes other than circles can be found as
Potential flow conformal mapping solutions
Conformal transformations that map the unit disk or half-plane onto the interior of a bounded or unbounded polygon in the complex plane, which represents the pier cross-section in the physical flow domain, are used to solve Laplace's equation for the stream function. The calculations are carried out numerically using SCPACK, a computer program developed by Trefethen Citation(1980) that applies the Schwarz-Christoffel transformation to map the unit disk to two-dimensional regions with irregular or unbounded (but not curved or multiply connected) geometries, which may contain vertices at infinity.
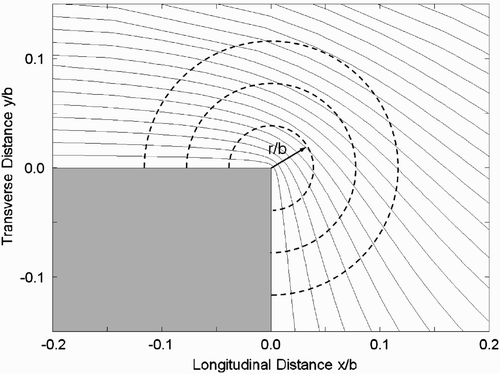
Streamlines around the upper half of an unbounded sharp-nosed pier with a 90° interior nose angle (which produces a 45° half angle) and a total pier length-to-width ratio ℓ/b=2 calculated numerically are shown in . For all polygonal pier shapes considered, whether their front ends are square or pointed, the maximum velocities occur at their upstream corners, where the velocity goes to infinity according to the potential flow theory. To find the maximum average velocity acting over a distance ϵ D r within the ideal flow field adjacent to a corner, stream functions were calculated at a finite number of points along circular arcs of radii r centered at the pier's corner, as shown in . When divided by the arc radius, the difference in the maximum stream function found along an arc, that is, ψ (r)max, and the value of ψ at the pier corner gives the maximum average velocity within a distance r adjacent to the corner.
Figure 9. Streamlines around the upper half of an unbounded sharp-nosed pier with a 90° interior nose angle and a length-to-width ratio ℓ/b=2 that is aligned with the approach flow.
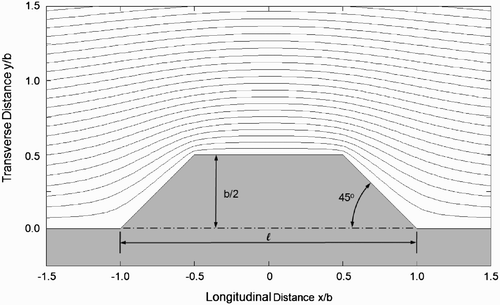
Figure 10. Streamlines around the corner of an unbounded infinitely long square-nosed pier showing circular arcs centered at the upstream corner along which the maximum stream functions are found by conformal mapping solutions of the potential flow field.
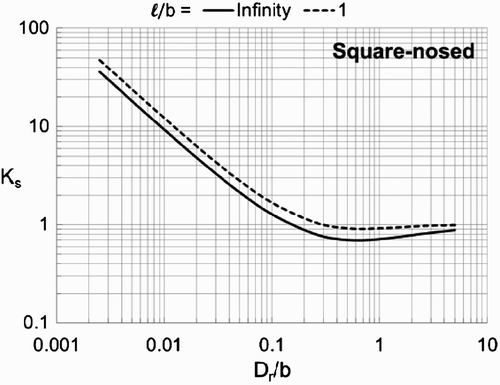
Square-nosed piers
Shape factors given by EquationEquation (27) using numerically calculated average velocities adjacent to unbounded square-nosed piers with ℓ/b=1 (that is, a square column) and infinity, both of which are aligned with a uniform approach flow, are shown in as a function of the normalized distance ϵ D
r/b from the corner. As ϵ D
r/b→∞, the shape factor K
s→1, just as it should since V¯
s→V
a. Because V¯
s→∞ at the corner as ϵ D
r→0, the factor K
s becomes much larger than unity for ϵ D
r/b<0.1. However, as ϵ D
r/b increases, the shape factors for both piers fall below unity, reaching minimums of about 0.9 for the square column and about 0.7 for the square-nosed pier of infinite length. These findings contradict the general notion that adjustment factors for square-nosed piers are constant and always greater than one (Parola Citation1993; Lagasse et al. Citation2006, p. 95–96; Lagasse et al. Citation2009, p. DG11.6). After considering the results of previous studies, Melville and Coleman (Citation2000, p. 355) concluded that neither pier shape nor alignment of a pier with the approach flow are significant factors affecting riprap stability. However, pier shape and approach flow angle can both have large influences on stable particle diameter, as will be shown.
Figure 11. Theoretical shape factor K s as a function of relative distance from the pier corner ϵ D r/b for unbounded square-nosed piers aligned with the flow with length-to-width ratios ℓ/b of infinity and one.
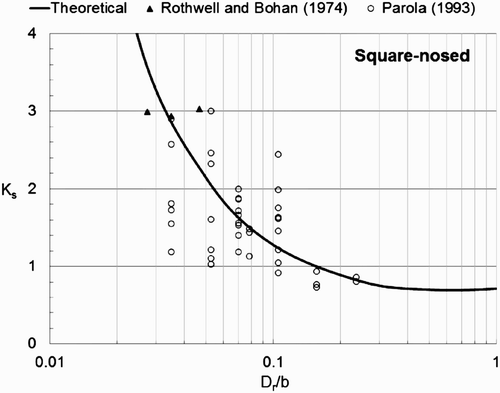
The 42 experimental measurements on stable rock sizes at square-nosed piers, three from Rothwell and Bohan Citation(1974) and 39 from Parola Citation(1993), are used to test the theoretical shape factor relations shown in . Measured shape factors, which were found by dividing the measured stable particle diameter by the value of D
r given by EquationEquation (13) for a circular column of the same width, are compared in with the theoretical relation for infinitely long unbounded square-nosed piers aligned with the approaching streamflow. The graphical relation provides a notably good fit to the data points, which are randomly scattered about the curve for values of K
s ranging from 0.7 to 3.
Figure 12. Theoretical relation for square-nosed pier K s graphed with measured values from small-scale experiments.
Dependence of K s on the ratio ϵ D r/b as shown in and helps explain the contradictions in views regarding the influence of pier shape on riprap stability. Because D r/b<0.2 for most experimental studies, the need for larger sized stones at square-nosed piers is a likely conclusion. However, tests carried out with larger values of D r/b might well lead to the finding that the influence of pier shape is negligible. Values of D r/b>0.3 at archetype piers occur commonly.
Sharp-nosed piers
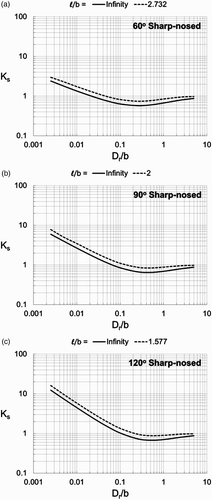
Computations similar to those that were carried out for square-nosed piers were used to produce the graphical relations shown in for sharp-nosed piers having interior nose angles of 60°, 90°, and 120°. The general pattern is the same as for square-nosed piers: K s is significantly greater than one for small values of D r/b, decreasing to a minimum that is less than one for D r/b between 0.1 and 1, and then increasing toward unity as D r/b approaches infinity. As clearly shown in , K s increases as the pier nose becomes more blunt (that is, less sharp) for a particular value of D r/b.
Figure 13. Theoretical shape factors K s as a function of relative distance from the pier corner ϵ D r/b for unbounded piers having sharp ends with interior nose angles of (a) 60°, (b) 90°, and (c) 120° for length-to-width ratios ℓ/b of infinity and one.
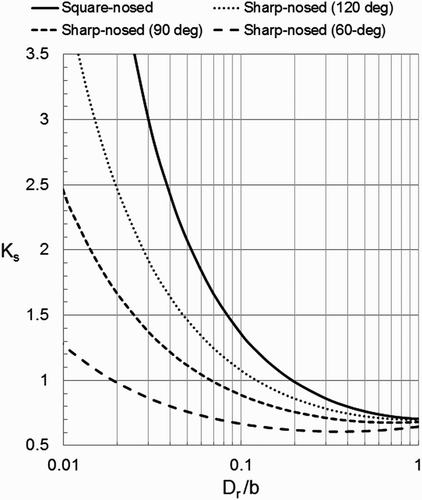
Mathematical approximations
The theoretical K s relation for square-nosed piers with ℓ/b=∞ shown in provides a notably good fit to the experimental data that are displayed in the graph. For this reason, the graphical relations established for both square-nosed and sharp-nosed piers with ℓ/b=∞ will be used to evaluate K s for piers of all length-to-width ratios. To simplify application of the factor, the following mathematical approximations of the graphical relations for K s have been developed:
Figure 14. Shape factor K s from mathematical approximations of the theoretical graphical relations as a function of relative distance from the pier corner ϵ D r/b for infinitely long unbounded piers aligned with a uniform flow.
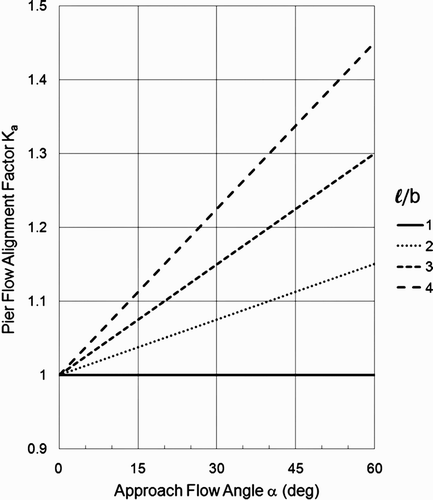
Approach flow alignment
For other than circular columns, maximum velocities adjacent to piers will be larger when they are not aligned with approaching streamflow. Additionally, turbulence of the flow is likely to increase at non-aligned piers, which will increase the range of time-varying shear stresses acting on a rock particle at the pier base, thereby making it less stable. Consequently, larger riprap will be needed to protect against erosion.
Although conformal mapping can also be used to analyze flow patterns around polygons representing non-aligned bridge piers, an adjustment factor K α presented by Choi et al. Citation(2002), which is based on small-scale laboratory experiments on non-aligned round-nosed piers having length-to-width (ℓ/b) ratios greater than one, is used here as an alternative. The graphical relation for K α given by Choi et al. Citation(2002), which represents accurately their experimental data, is matched closely by the following mathematical expression:
Figure 15. Pier flow alignment factor K a given by the mathematical approximation of the graphical relation presented by Choi et al. Citation(2002) as a function of the approach flow angle α and the pier length-to-width ratio ℓ/b.
Combined effects
The combined effects of cross-flow gradients, pier spacing, and pier shape are not evaluated here theoretically. However, since neither of the factors K ω or K p is likely to be considerably greater than one, errors caused by their multiplicative influence will be minimal. For this reason, the following expression is used to calculate the minimum stable rock riprap diameter at bridge piers:
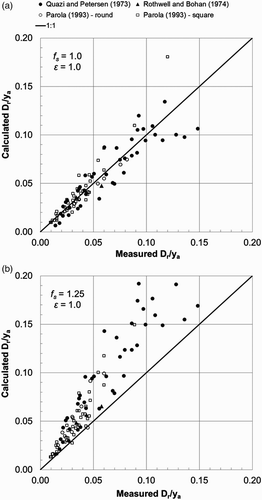
Selection of safety factor
The formula for sizing rock riprap to protect bridge piers predicts the experimental data well using widely accepted coefficients for calculating the critical shear stress and the flow resistance of the rock. Nonetheless, an adequate safety factor f
s, which is the ratio of resisting moments to overturning moments acting on a riprap particle of diameter D
r, is needed in EquationEquation (14) for K
r to account for uncertainty of the relation, imperfections in materials, flaws in construction, and rock cover degradation over time. Suitable safety factors depend on the accuracy of design load calculations (that is, calculated water velocities and depths, and the shear stresses that they produce on the riprap surrounding a pier), on the consequences of failure, and on the cost of over-designing the protective cover to achieve the desired factor of safety.
Values of D
r/y
a given by EquationEquation (30) with f
s=1.0 and 1.25 are plotted in against measured values from both round-nosed and square-nosed pier experiments. The good predictive ability of EquationEquation (30)
with f
s=1.0 is shown in , in which scatter about the 1:1 line is random for the entire range of D
r/y
a. With f
s=1.25, the 1:1 line in provides a clear lower bound to all except two of the measurements, which fall slightly below the line. Recalling from EquationEquation (1)
that f
s≤S
r=ρr/ρ, selection of an appropriate value of the safety factor depends in part on the mass densities of the riprap material and the ambient fluid. Based on the visual display of data in , setting f
s=1.25 appears to be a good choice when applying EquationEquation (30)
to size loose rock riprap placed in water, for which specific gravity S
r ≈ 2.65. Larger safety margins are produced with f
s>1.25.
Figure 16. Comparison of calculated and measured values of relative diameters of stable rock riprap placed around both round-nosed and square-nosed piers in small-scale experiments with (a) f s=1.0 and (b) f s=1.25.
Comparison to other formulae
Several formulae for sizing stable rock riprap at bridge piers are summarized and compared by Melville and Coleman (Citation2000, p. 348–356), Lagasse et al. (Citation2006, p. 95–97), and Lagasse et al. (Citation2007, p. 15), all of whom find that there is a wide range of predicted sizes for any given flow condition. Predictions of D
r given by a few of these formulae for round-nosed and square-nosed bridge piers aligned with approaching streamflow are compared now with estimates given by EquationEquation (30).
Each of the expressions included in the comparison can be written in the general form
Table 3. Summary of existing formulae for sizing stable rock riprap used to protect round-nosed and square-nosed cylindrical column bridge piers.
For all of the pier riprap formulae included in the comparison, K r=K/(S r−1)κ/2, where K dimensionless coefficient, which is different for each expression. The factor K b=1 for most of the formulae, which implies that the calculated rock diameter has no dependance on pier width. Only Parola Citation(1993), Chiew Citation(1995), and Yoon and Yoon Citation(1997) take into account pier width explicitly. The effect of pier shape is addressed only by Parola Citation(1993) and Lagasse et al. Citation(2009), who specify K s for shapes other than round-nosed.
The formulae of Quazi and Petersen (1973) and Chiew Citation(1995) predict values of D
r/y
a for critical conditions, which are compared with values given by EquationEquation (30) with f
s=1. The remaining formulae provide design estimates that incorporate a factor of safety, which assures a stable rock size. Values of D
r/y
a given by these relations are compared with the predictions of EquationEquation (30)
with f
s=1.25.
Comparison of predictions for round-nosed piers
Ratios of calculated to measured critical values of D r/y a (that is, values of D r/y a that provide minimally stable rock size) for round-nosed pier data only are compared in the box-and-whisker diagrams shown in . A box-and-whisker diagram provides a convenient way of depicting graphically the prediction error (that is, the predicted value minus the measured value) through their five-number summaries: the smallest observation (sample minimum, not including outliers), lower quartile (Q1), median (Q2), upper quartile (Q3), and largest observation (sample maximum, not including outliers). Outliers are those measurements not within 1.5×IQR of the lower and upper quartiles, where IQR=Q3−Q1=inter−quartile range. The minimum and maximum outliers are also shown in the diagram, along with the average. Spacing between different parts of the boxes helps indicate the degree of dispersion (spread) and skew (asymmetry) of the prediction errors.
Figure 17. Box-and-whisker diagrams comparing the ratios of calculated and measured expected relative diameters of stable rock riprap given by various formulae for the round-nosed pier experimental data.
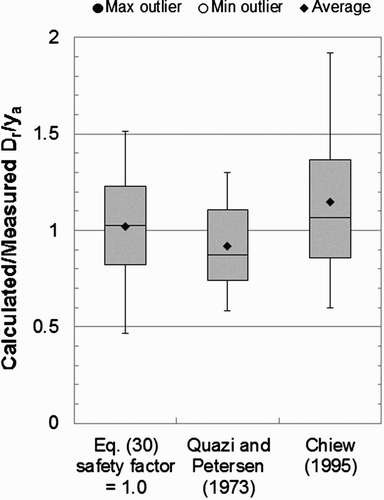
From the box-and-whisker diagrams in , the theoretical predictions given by EquationEquation (30) are shown to be consistently accurate (the IQR extends from about 0.8 to 1.2), with median and average values both near one, and with little skew. However, the IQR of predictions from the Quazi and Petersen (1973) formula, which is based on a multiple-regression fit to their data, is smallest. Chiew's Citation(1995) equation generally over-predicts the critical particle size, the IQR of its estimates is the largest of the three formulae compared, and the maximum predicted value of D
r/y
a is nearly two, which is significantly larger than the maximums given by the other equations.
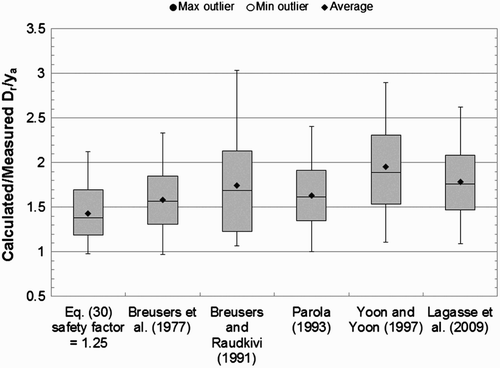
Formulae that provide values intended for design include those of Breusers et al. Citation(1977), Breusers and Raudkivi Citation(1991), Yoon and Yoon Citation(1997), Lagasse et al. Citation(2009), and EquationEquation (30) with f
s=1.25. The box-and-whisker diagrams in show that all of the formulae predict values of D
r that are stable (that is, predict values of D
r/y
a>1), except for one measurement that EquationEquation (30)
and Bruesers et al. (1973) estimate as slightly less than one. However, it is the magnitude of the average and median values of D
r/y
a, along with the maximums and the presence of outliers, which distinguish prediction quality for design. Estimates given by EquationEquation (30)
have the smallest median and average, the narrowest IQR, and the lowest maximum value, which show that the equation consistently provides the smallest stable riprap size. For these reasons, EquationEquation (30)
clearly delivers more desirable design estimates than the other formulae.
Figure 18. Box-and-whisker diagrams comparing the ratios of calculated and measured design relative diameters of stable rock riprap given by various formulae for the round-nosed pier experimental data.
Comparison of predictions for square-nosed piers
Ratios of calculated to measured values of D
r/y
a for square-nosed pier data are compared in the box-and-whisker diagrams shown in . Only Parola Citation(1993) and Lagasse et al. Citation(2009) provide K
s for square-nosed piers, which are constant values that are given in . As the theoretical evaluation for square-nosed and sharp-nosed piers has shown, K
s is not constant, possessing instead considerable variation dependent on the ratio D
r/b. For this reason, it is no surprise that the predicted median and average design values of D
r/y
a given by EquationEquation (30) with f
s=1.25 are significantly less than design estimates given by the Parola Citation(1993) and Lagasse et al. Citation(2009) equations. The comparison therefore shows that EquationEquation (30)
also provides design estimates of riprap size that are both reliable and more suitable than those given by other formulae.
Figure 19. Box-and-whisker diagrams comparing the ratios of calculated and measured relative diameters of stable rock riprap given by various formulae for the square-nosed pier experimental data.
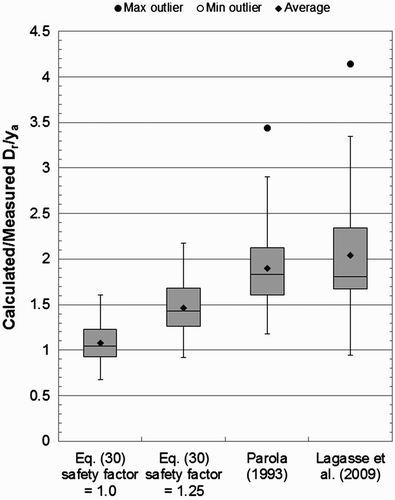
Also shown in is the box-and-whisker diagram of predictions given by EquationEquation (30) with f
s=1.0. The estimates are well-balanced, with the median and average values both close to one. The D
r/y
a prediction IQR is notably small, extending from about 0.9 to 1.2.
Example application
A brief example follows that illustrates the use of the procedure developed in this paper to determine the size of stable rock riprap needed to halt scour around a 0.914 m wide, 7.315 m long, sharp-nosed bridge pier that has a 90° interior nose angle. Angular rock riprap with S r=2.65 is to be placed in the form of a horizontal apron surrounding the pier at the current streambed level. Hydraulic analysis using the two-dimensional depth-averaged flow and sediment transport model FST2DH (Froehlich Citation2003) shows that for the design flood, y a=5.58 m, V a=3.11 m/s, and α=5°. The two-dimensional depth-averaged flow solution also shows that a slight cross-flow shear will exist for which ω=0.15. Just one pier, which is located at the center of the main channel, supports the bridge deck. A safety factor f s=1.25 is to be used for sizing the riprap, and ϵ=1.
Because the riprap will form a horizontal surface after placement, θ=0°, giving β=0°, which allows K
r to be calculated from EquationEquation (16) as follows:
With Fr
a=V
a/√gy
a=3.11/√9.81×5.58=0.420, the initial estimate of D
r/y
a is found from EquationEquation (30) as
Summary and conclusions
An expression that provides the minimum diameter for stable loose rock riprap placed around cylindrical column bridge piers is derived based on an evaluation of moments resisting and promoting overturning of a single rock particle, on an elementary inviscid flow theory that provides models of velocities around piers of various cross-sectional shapes, and on widely accepted empirical relations and coefficients used to calculate shear stresses acting on rock riprap particles and the critical values of shear stress at which particles are moved. The theoretical formulation helps to understand the influences of pier width, cross-flow shear, pier spacing, and pier shape, which are often difficult to discover from the results of small-scale physical model experiments alone.
Stable riprap diameters calculated by the theoretical relation developed here for circular columns compare favorably with measured values collected in several experimental studies carried out by others. Because the approach taken predicts stable rock sizes remarkably well for a single cylindrical column, the analysis was extended to account for cross-flow shear, the effect of nearby piers, and both square-nosed and sharp-nosed pier shapes. However, the theoretically derived coefficients that help explain the additional effects should not be stretched to extreme conditions until experiments are carried out to confirm their use.
Theoretical shape factors, which are multiplied times the stable rock size needed for a circular column of the same width, were found for piers having square ends and for piers having sharp ends with interior nose angles of 60°, 90°, and 120° based on potential flow models of velocities. The shape factors are not constant: they approach one for a large-diameter stone, and increase in value as rocks become small in comparison to pier widths.
The theoretical shape factor relation for square-nosed piers was tested using available experimental measurements. The relation for infinitely long piers, which was found to provide a particularly good fit to the data, was adopted for practical calculation of shape factors for both square-nosed and sharp-nosed pier. Comparison of calculated and measured rock sizes for both round-nosed and square-nosed pier experiment data suggests that a safety factor f s=1.25 provides an appropriate margin of error needed for design.
Comparison of predictions from EquationEquation (30) to those from other formulae shows that the equation clearly delivers more desirable design estimates of the stable riprap diameter. Notwithstanding its simplicity, the relation provides sound theoretical insights to the important parameters affecting stability of loose rock riprap used to protect bridge piers.
Notes on contributor
Dr Froehlich is a consulting engineer who specializes in complex and computationally intensive analyses of water resource projects. His technical interests include flood risk management, bridge hydraulics and scour, river training works, stream channel rehabilitation, urban stormwater drainage systems, dam failures, and surface-water hydrology.
Notation
| The following symbols are used in this paper: | ||
| b | = |
pier width; |
| D r | = |
representative rock riprap particle diameter, usually D 50 of the riprap mixture; |
| D 50 | = |
diameter of median particle size of a riprap mixture; |
| f s | = |
riprap safety factor that represents the ratio of moments resisting overturning to moments promoting overturning of a single rock particle; |
| Fr a | = |
V a/ √gy a Froude number of the flow approach- ing a bridge pier; |
| g | = |
gravitational acceleration; |
| IQR | = |
interquartile range; |
| k n | = |
rock riprap flow resistance coefficient; |
| k u | = |
Manning formula units coefficient; |
| K | = |
pier riprap formula coefficient; |
| K b | = |
rock riprap sizing factor that accounts for pier width; |
| K b1, K b2 | = |
rock riprap sizing factors that account for pier width in Chiew's Citation(1995) formula; |
| K p | = |
rock riprap sizing factor that accounts for transverse pier spacing; |
| K r | = |
rock riprap sizing factor that accounts for rock properties slope effects; |
| K s | = |
rock riprap sizing factor that accounts for pier shape, particularly the shape of the upstream end or nose of the pier; |
| K α | = |
rock riprap sizing factor that accounts for pier alignment with the approach flow; |
| K ω | = |
rock riprap sizing factor that accounts for cross-flow shear; |
| ℓ | = |
pier length; |
| n | = |
Manning formula roughness coefficient; |
| p | = |
transverse pier-spacing distance; |
| Q1 | = |
lower quartile; |
| Q3 | = |
upper quartile; |
| r | = |
radial distance; |
| S r | = |
rock riprap specific gravity; |
| u | = |
velocity in x direction; |
| v | = |
velocity in y direction; |
| V | = |
depth-averaged velocity; |
| V a | = |
depth-averaged approach flow velocity, or uniform flow velocity; |
| V¯ | = |
average velocity over a distance ϵ D r adjacent to a bridge pier |
| W | = |
channel width; |
| x | = |
longitudinal coordinate; |
| y | = |
transverse coordinate; water depth; |
| y a | = |
approach flow depth; |
| z | = |
complex number; |
| α | = |
mass angle of repose of falling apron stone. |
| β | = |
angle of particle movement along a slope with respect to horizontal; |
| δ | = |
angular coordinate; |
| ϵ | = |
rock diameter multiplication factor used to determine the distance adjacent to a bridge pier over which an average velocity is found; |
| η | = |
particle stability number for general bank slope and water-surface slope conditions; |
| ηo | = |
particle stability number for horizontal beds and small water-surface slopes; |
| θ | = |
riprap mound side-slope angle; |
| κ | = |
general pier riprap formula Froude number exponent; |
| ρ | = |
water mass density; |
| ρr | = |
rock riprap mass density; |
| τ | = |
hydrodynamic shear stress acting on a riprap-covered surface; |
| τ* | = |
τ/(√S r−1ρ gD r) dimensionless shear stress; |
|
| = |
Shields’ parameter (that is, dimensionless critical shear stress) for rock riprap on a horizontal bed; |
| ϕr | = |
rock riprap mass angle of repose; |
| ψ | = |
stream function; |
| ω | = |
vorticity or cross-flow shear; |
| Ω | = |
ω b/V a dimensionless measure of cross-flow shear or vorticity; |
References
- Anderson , A G . 1961 . “ Sedimentation ” . In Handbook of fluid dynamics. Section 18 , Edited by: Streeter , V L . 18.1 – 18.39 . New York, NY : McGraw Hill; .
- Breusers , H NC , Nicollet , G and Shen , H W . 1977 . Local scour around cylindrical piers . J Hydraul Res. , 15 ( 3 ) : 211 – 252 . (doi:10.1080/00221687709499645)
- Breusers , H NC and Raudkivi , A J . 1991 . “ Scouring ” . Rotterdam , , Netherlands : A. A. Balkema .
- Chiew , Y- M . 1995 . Mechanics of riprap failure at bridge piers . J Hydraul Eng. , 121 ( 9 ) : 635 – 643 . (doi:10.1061/(ASCE)0733-9429(1995)121:9(635))
- Chiew , Y- M . 1997 . Discussion of ‘Mechanics of riprap failure at bridge piers’ by . J Hydraul Eng. , 123 ( 5 ) : 481 – 482 . (doi:10.1061/(ASCE)0733-9429(1997)123:5(482))
- Chiew , Y- M . 2004 . Local scour and riprap stability at bridge piers in a degrading channel . J Hydraul Eng. , 130 ( 3 ) : 218 – 226 . (doi:10.1061/(ASCE)0733-9429(2004)130:3(218))
- Chiew , Y- M and Lim , F- H . 2000 . Failure behavior of riprap layer at bridge piers under live-bed conditions . J Hydraul Eng. , 126 ( 1 ) : 43 – 55 . (doi:10.1061/(ASCE)0733-9429(2000)126:1(43))
- Choi , G W , Ahn , S J , Hahm , C H , Kim , K H and Jeong , S M . Riprap equation for protecting the local scour at bridge piers . Proceedings of the 5th International Conference on Hydroscience and Engineering; . Warsaw , , Poland : Warsaw University of Technology . 2002 Sep 18–21;
- Chow , V T . 1959 . Open-channel hydraulics , New York, NY : McGraw-Hill .
- Dargahi , B . 1989 . The turbulent flow field around a circular cylinder . Exp Fluid. , 8 ( 1–2 ) : 123 – 456 . (doi:10.1007/BF00203058)
- De Camp , L S . 1974 . “ The ancient engineers ” . New York, NY : Ballantine Books .
- Engels , H . 1929 . “ The hydraulic laboratory of the Technical University of Dresden ” . In Hydraulic laboratory practice. Chapter 5 , Edited by: Freeman , J R . 83 – 109 . New York, NY : American Society of Mechanical Engineers; .
- Froehlich , D C . 2003 . “ User's manual for FESWMS FST2DH – Two-dimensional depth-averaged flow and sediment transport model – Release 3 ” . Washington, DC : Federal Highway Administration (Publication no. FHWA-RD-03-053 .
- Froehlich , D C . 2011 . Mass angle of repose of open-graded rock riprap . J Irrig Drain Eng. , 137 ( 7 ) : 454 – 461 . (doi:10.1061/(ASCE)IR.1943-4774.0000316)
- Froehlich , D C . The rap on river banks: protecting river banks with loose rock riprap. In: . River flow 2012. Proceedings of the IAHR International Conference on Fluvial Hydraulics; . Edited by: Murillo Muñoz , R E . pp. 1317 – 1324 . San Jose, Costa Rica. Boca Raton (FL) : CRC Press; . 2012 Sep 5–7;
- Froehlich , D C . 2013 . Sizing loose rock riprap to protect stream banks . River Res Appl. , 29 ( 2 ) : 219 – 235 . (doi:10.1002/rra.1587)
- Gest , A P . 1930 . “ Engineering ” . New York, NY : Longmans, Green .
- Graf , W H and Yulistiyanto , B . 1998 . Experiments on flow around a cylinder: the velocity and vorticity fields . J Hydraul Res. , 36 ( 4 ) : 637 – 653 . (doi:10.1080/00221689809498613)
- Graziano , F and Jones , J S . 1990 . Design of riprap to protect bridge piers from local scour . Public Roads. , 54 ( 2 ) : 193 – 199 .
- Hoffmans , G JCM and Verheij , H J . 1997 . “ Scour manual ” . Rotterdam : A.A. Balkema .
- Julien , P Y . 1998 . “ Erosion and sedimentation ” . Cambridge : Cambridge University Press .
- Kirby , R S , Withington , S , Darling , A B and Kilgour , F G . 1956 . “ Engineering in history ” . New York, NY : McGraw-Hill .
- Klingeman , P C . 1973 . Hydrologic evaluations in bridge pier scour design . J Hydraul. , 99 ( HY12 ) : 2175 – 2184 .
- Lagasse , P F , Clopper , P E , Pagan-Ortiz , J E , Zevenbergen , L W , Arneson , L A , Schall , J D and Girard , L G . 2009 . “ Bridge scour and stream instability countermeasures ” . In , 3 , Washington, DC : Federal Highway Administration (Publication no. NHI-00-112, Hydraulic Engineering Circular No. 23 .
- Lagasse , P F , Clopper , P E , Zevenbergen , L W and Ruff , J F . 2006 . “ Riprap design criteria, recommended specifications, and quality control ” . Washington, DC : Transportation Research Board of the National Academies (NCHRP Report 568 .
- Lagasse , P F , Clopper , P E , Zevenbergen , L W and Girard , L G . 2007 . “ Countermeasures to protect bridge piers from scour ” . Washington, DC : Transportation Research Board of the National Academies (NCHRP Report 593 .
- Maynord , S T . 1991 . Flow resistance of riprap . J Hydraul Eng. , 117 ( 6 ) : 687 – 696 . (doi:10.1061/(ASCE)0733-9429(1991)117:6(687))
- Melville , B W and Coleman , S E . 2000 . “ Bridge scour ” . Highlands Ranch, CO : Water Resources .
- Milne-Thomson , L M . 1960 . “ Theoretical hydrodynamics ” . New York, NY : Macmillan .
- Nece , R E . 1974 . “ Effectiveness of bridge pier riprap practice in Washington State. Final Report ” . Portland, OR : U.S. Department of Transportation, Federal Highway Administration .
- Parker , G , Toro-Escobar , C and Voigt , R L . 1998 . “ Countermeasures to protect bridge piers from scour – ” . Vol. 2. , 24-7 Washington, DC : Transportation Research Board, National Academy of Sciences (NCHRP Report .
- Parola , A C . 1993 . Stability of riprap at bridge piers . J Hydraul Eng. , 119 ( 10 ) : 1080 – 1093 . (doi:10.1061/(ASCE)0733-9429(1993)119:10(1080))
- Piésold , D DA . 1991 . “ Civil engineering practice: engineering success by analysis of failure ” . London : McGraw-Hill .
- Quazi , M E and Peterson , A W . 1973 . “ A method for bridge pier rip-rap design. Proceedings of the First Canadian Hydraulics Conference ” . 96 – 106 . Edmonton, AB : University of Alberta; .
- Raudkivi , A J and Ettema , R . 1982 . Clear-water scour at cylindrical piers . J Hydraul Eng. , 109 ( 3 ) : 338 – 350 . (doi:10.1061/(ASCE)0733-9429(1983)109:3(338))
- Rothwell , E D and Bohan , J P . 1974 . “ Investigation of scour and protection around bridge piers ” . In Report Prepared for the Louisiana Department of Highways , Vicksburg, MS : U.S. Army Engineer Waterways Experiment Station .
- Simons , D B and Şentürk , F . 1977 . “ Sediment transport technology ” . Fort Collins, CO : Water Resources .
- Stevens , M A and Simons , D B . 1971 . “ Stability analysis for coarse granular material on slopes ” . In River mechanics. Chapter 17 , Edited by: Shen , H W . 17.1 – 17.43 . Fort Collins, CO : Water Resources; .
- Stevens , M A , Simons , D B and Lewis , G L . 1976 . Safety factors for riprap protection . J Hydraul Div. , 102 ( HY5 ) : 637 – 655 .
- Streeter , V L . 1948 . Fluid dynamics , New York, NY : McGraw-Hill .
- Trefethen , L N . 1980 . Numerical computation of the Schwarz-Christoffel transformation . SIAM J Sci Statist Comput. , 1 ( 1 ) : 82 – 102 . (doi:10.1137/0901004)
- Unger , J and Hager , W H . 2006 . Riprap failure at circular bridge piers . J Hydraul Eng. , 132 ( 4 ) : 354 – 362 . (doi:10.1061/(ASCE)0733-9429(2006)132:4(354))
- Unger , J and Hager , W H . 2007 . Down-flow and horseshoe vortex characteristics of sediment embedded bridge piers . Exp Fluids. , 42 ( 1 ) : 1 – 19 . (doi:10.1007/s00348-006-0209-7)
- Vanoni , V A . 1977 . “ Sedimentation engineering – ASCE manuals and reports on engineering practice no. 54 ” . New York, NY : American Society of Civil Engineers .
- White , F M . 1994 . “ Fluid mechanics ” . In , 3 , New York, NY : McGraw-Hill .
- Yoon , T H and Yoon , S B . Design of riprap to protect scour around circular piers . Proceedings of 27th Congress of the International Association for Hydraulic Research . Vol. A; , pp. 178 – 183 . San Francisco, CA : American Society of Civil Engineers; . 1997 Aug 10–15;