
 ?Mathematical formulae have been encoded as MathML and are displayed in this HTML version using MathJax in order to improve their display. Uncheck the box to turn MathJax off. This feature requires Javascript. Click on a formula to zoom.
Abstract
Sharing rides in on-demand systems allow passengers to reduce their fares and service providers to increase revenue, though at the cost of adding uncertainty to the system. Notably, the uncertainty of ride-pooling systems stems not only from travel times but also from unique features of sharing, such as the dependency on other passengers' arrival time at their pick up points. In this work, we theoretically and experimentally analyse how late arrivals at pick up locations impact shared rides' performance. We find that the total delay is equally distributed among sharing passengers. However, delay composition gradually shifts from on-board delay only for the first passenger to waiting delay at the origin for the last passenger. Sadly, trips with more passengers are more adversely impacted. Strategic behaviour analysis reveals Nash equilibria that might emerge. We analyse the system-wide effects and find that when lateness increases passengers refrain from sharing and eventually opt-out.
1. Introduction
On-demand transport systems in which rides are shared have a great potential to become an important feature of urban mobility. All involved parties may potentially benefit from shared rides. Users can expect lower fares, as the cost of the trip is now partially divided over users; operators can increase their revenue, as vehicles are carrying more than one passenger at a time; and society benefits from a reduction in the number of vehicles, and thereby decreasing congestion and pollution.
Users, however, encounter additional travel and waiting times, which have to be compensated by reduced fares in order to make such systems attractive. Notably, the actual realisation of the shared trip might substantially differ from the planned one. Besides the uncertainty stemming from variability in traffic travel times, which affects all car traffic, ride-pooling has unique features that potentially induce additional sources of uncertainty, pertaining to co-riders. In this study, we investigate how riders' uncertain arrival times at pick up points, possibly late, affect other passengers with whom they are sharing, and its consequences for the overall system. Delayed shared rides have a number of negative impacts: not only does the system become less reliable, as schedules are not being fulfilled, but it also becomes less efficient, as it takes longer to transport a given passenger demand.
As an example, let us consider a ride shared by three passengers (Figure ). In such a ride, passenger i, before reaching her/his destination , visits the origins of passengers being picked up later
and destinations of passengers picked up earlier
, as shown in Figure . When the last passenger reaches her/his destination, the vehicle is empty and may serve another shared ride. To pool various travel requests into a single shared ride, the vehicle will likely deviate from shortest, direct path, which induces extra travel time, yet this is not the only source of delay. Notably, in a pooled ride, the arrival time at the destination is also dependant on the arrival times of fellow riders to their pick up points; if any of them is late, the vehicle will have to wait (up to a certain point). This will have a twofold impact on co-travellers: (i) prolonging waiting time of passengers that have not been picked up yet, and (ii) causing in-vehicle delay for those on-board.
Figure 1. An illustrative itinerary of a vehicle serving a shared ride for three passengers, that are first picked up at their origins and then dropped off at their destinations.
Here, we focus on rides offered through a ride-hailing platform where at least two travellers share the same vehicle, which we simply denote shared rides. However, the proposed theoretical framework and findings can be generalised onto any ride where delay of one traveller impacts her/his co-travellers, e.g. ridesharing, where one of travellers is also a driver, or on-demand transit with individual pick-ups (see Shaheen (Citation2016) for a review of terminology). In this study, we investigate how late arrivals impact individual passengers' sharing rides as well as the ride-pooling system performance as a whole. To measure this, we first concentrate on the itinerary of a particular shared ride, with a predetermined sequence of pick ups and drop offs, in order to understand the dynamics that emerge between the different users assigned to a single vehicle. We make the analyses assuming that all pick ups take place before the drop offs (so-called sequential shared rides), but we also show show the consequences of relaxing this assumption for non-sequential rides. We explore rides of various numbers of passengers (which we call the degree of the trip) and analyse the different implications for each passenger depending on their relative position within the itinerary.
We study two models: in the first one each passenger's arrival is random, whereas in the second one passengers decide strategically on their lateness. In the random model, we describe the expected outcomes of the system for each passenger, and analyse how these outcomes depend on their position within the pick up sequence and on the degree of the trip. We run Monte-Carlo simulations, which underpin the proposed theoretical analysis, and allow to visualise our findings illustratively. To the best of our knowledge, there is no publicly available information on passengers' arrival time distribution for ride-pooling services. Therefore, we resort to assuming a theoretical, lognormal distribution to describe passengers' arrival time. However, the proposed method can be applied to any empirically observed distributions, and we obtain generic findings on how late arrivals impact the performance of shared rides services.
Our findings indicate that mean delay increases with the degree of the trip, yet remains constant with respect to the relative position in the pick up sequence. Each additional sharing passenger contributes to the expected delay; however, we find the relation to be sub-linear, i.e. weaker for rides of higher degree. While the total delay with respect to the original arrival time is the same for each sharing passenger, they have different compositions. Passengers picked up early are unlikely to wait at the origin, and are likely to get delayed on-board the vehicle at other passengers' pick up points. Contrary, later picked up passengers will wait mainly at the origin, and their in-vehicle time will be less delayed. Naturally, the results are sensitive to the distribution of passenger arrival and its parameterisation. Yet notably, higher variance in the arrival process penalises rides of higher degrees more gravely.
Following on the simulation findings for random arrivals, we turn to analysing the strategic behaviour of passengers. If passengers aim at punctual arrival at the destination, their strategies are in line with the strategies of the system's operator. However, if the passengers' valuation of waiting time is high enough, the system may tend to the opposite equilibrium, where passengers arrive late to maximise their utility. Such a strategy, being optimal for some individuals, yields negative externalities for the co-travellers and the system's performance as a whole, and shall be mitigated by system providers. Policy makers need to be aware that active measures are required to prevent this user equilibrium.
Finally, we utilise these findings to conclude on implications over the system's performance. In our case study consisting of 3000 trips in Amsterdam, we simulate how the system deteriorates with passengers' increasingly late arrivals. The initially effective ride-pooling system is quickly affected when passengers start to arrive late. The impact is first visible for rides of higher degree, whose share quickly drops to zero. As lateness increases, passengers decide to choose non-shared, private rides, leading to higher costs for both passengers and the service provider, yielding a sub-optimal (yet stable) solution.
The paper is structured as follows. In the remaining of this section we complement the introduction by reviewing recent findings on shared rides, their performance and the behaviour of passengers sharing rides. Next, we assert the motivation and contribution of this work. In Section 2 we present the proposed method for quantifying the reliability of shared rides in the presence of late arrival at pick up points. Section 3 applies the proposed method in a series of numerical simulations. We discuss our findings and draw conclusions in Section 4.
1.1. Related studies
On-demand mobility platforms dynamically match supply and demand in a two-sided market, enabling flexible on-demand transport services. Given the significant market share of ride-hailing services and their instant operations, shared ridesFootnote 1 are potentially becoming both practically available and attractive for both sides of this two-sided market (Welch, Gehrke, and Widita Citation2020). The premise of shared rides is that passengers can reduce their fares and service providers can increase revenues. Furthermore, shared rides are expected to align with policy objectives, such as increasing accessibility and reducing congestion. Notwithstanding, the potential of shared rides is yet to be realised in large-scale operations.
The problem of matching travel requests into shared rides is increasingly addressed in the literature: for an up-to-date and extensive (and broader) review we refer the reader to Wang and Yang (Citation2019), Narayanan, Chaniotakis, and Antoniou (Citation2020). We here specifically refer to two recent contributions that we leverage on in this study. To pool the trip requests into shared rides served by vehicles we use the real-time, scalable algorithm of Alonso-Mora et al. (Citation2017). To make sure the trips are pooled into shared rides that are attractive to passengers, we apply the method of Kucharski and Cats (Citation2020).
Despite algorithmic readiness, the market of shared rides is still fairly limited as reflected in the low percentage of shared rides in real-world operations. For instance, (Li et al. Citation2019) study the case of Chengdu, China, finding that only 6% of ride-hailing trips are shared. This can be attributed to the extra delay (about 10 min on average), detour (about 1.55 km on average), and degraded travel time reliability caused by ride-sharing. They apply the so-called 95th buffer index to quantify travel time reliability, and find out that the reliability of shared rides is worse than that of private rides, because of delays and detours. In particular, they find that sharing a ride increases the time buffer index (which means the need to budget extra travel time) by 37–61% to ensure an on-time arrival. This concurs with the findings of a study among over 500 users of a ride-sharing service in Italy, where service reliability and its implications for time planning was one of the users' main concerns (Gargiulo et al. Citation2015). While this downside of shared rides has been often recognised since early futuristic studies on pooled rides (Horowitz and Sheth Citation1977), it hitherto has not been directly addressed, and the underlying dynamics remain unknown.
While shared on-demand services offer a flexible mean of public transport, their reliability is expected to have a critical impact on their attractiveness. In the absence of timetables, there is no well-established notion of reliability. Reliability in the context of shared rides has been addressed by few studies so far: Bansal et al. (Citation2019) investigate how the difference between the stated and actual pick up times affects passengers' choices and how a service provider can leverage on this information to increase its ridership; Alonso-González et al. (Citation2020b) analyse and quantify the Value of Reliability (VoR) of on-demand services using a stated preference survey, arguing that flexibility induces an extra risk related to service reliability and availability; the results of Kim, Rasouli, and Timmermans (Citation2017) underscore the importance of reliability for successful market adoption; Liu et al. (Citation2018) explores how collected travel time information may improve reliability of shared autonomous taxis; Pimenta et al. (Citation2017) study reliability of travel times for a shared system that works over a line; Liu et al. (Citation2019) focus on changes induced by traffic conditions; Tu et al. (Citation2019) explored empirical data from Chengdu to assess trade-off between reliability and time-savings for ride-pooling; Javanshour, Dia, and Duncan (Citation2019) explore the impact of demand uncertainty and Fielbaum and Alonso-Mora (Citation2020) study how travel times change due to the en-route updating of routes when new requests arrive.
The problem of node delays in sequential schedules has a resemblance to problems addressed in the context of supply-chain management. In that context, the system's performance depends on the realisation of an uncertain and stochastic process of customers' arrivals (Heilporn, Cordeau, and Laporte Citation2011), which can lead to instances of cascading failure or ripple effects (Dolgui, Ivanov, and Sokolov Citation2018). This leads to the need for designing optimal service levels that account for the propagation of supply-and-demand-side uncertainties in supply-chains (Rezapour, Allen, and Mistree Citation2015).
1.2. Motivation and contribution of this study
Key questions regarding shared rides' reliability have not been answered yet. For instance, it is not clear if (and how) reliability changes with the number of passengers sharing a trip and with the sequence of pick ups and drop offs. Moreover, it is unknown how a single late passenger impacts the shared-ride performance for all her/his fellow passengers. It is also unclear the long-term consequences for the ride-pooling system, i.e. how travel strategies will change when passengers learn others' behaviours, how the system's performance will be impacted, and how passengers will react to a likely lower perceived utility.
While some of the sources of delay are present in other modes of transport as well (such as congestion, present in both public and private transport, or late vehicle arrival, present in public transport), others are unique to shared rides systems. Results from other studies may be transferred regarding the former, while the latter calls for a dedicated research. Contrary to public transport, vehicles serving shared requests may wait for passengers at pick up locations. While travel time delay is additive and each additional segment of a route sequence adds to the total delay, the delay at nodes is not cumulative. Instead it is driven by the most delayed passenger who dominates other delays, that typically cancel out, as well as early arrivals, before the scheduled time. Since the primary objective of shared rides is to maximise occupancy, if the impact of unreliability is stronger for rides of higher degree then this is of profound practical importance. Those novel aspects calls for dedicated methods and analyses. In this paper, we focus on those phenomena unique for shared rides (dependency on other travellers arrivals), and provide generic methods that can be extended to cover for the other said sources of unreliability.
After posing those questions, we analytically examine their answers and consequences. Inevitably, passengers will learn the system dynamics and adapt their strategies to maximise their individual utilities. Whether their optimal strategies will be optimal also for the system and for co-travellers may have far-reaching ramifications for service performance and operations. Overlooking reliability aspects in the analysis of shared rides systems may result in overestimating their potential, i.e. the actual performance may be significantly worse than the one implied by an analysis that assumes punctuality.
While high-fidelity large datasets on ride-hailing trips are widely available for public use (NYC, Chicago, Chengdu, etc.) none of them reports pick up waiting times. Therefore, we do not know if passengers and/or vehicles arrive on time or delayed. Therefore, we employ theoretical distributions inspired by studies on late arrivals in public transport. As soon as actual waiting times become available our generic method may be applied accordingly.
In the following, we provide theoretical findings regarding the distributions of waiting times and total delays, as well as the impact over the system as a whole due to its loss of attractiveness. Different implications are obtained when lateness is assumed to be either random or strategically decided. These findings are then tested and verified using numerical simulations.
2. Method
In this section, we first introduce a shared ride as it is scheduled and then discuss how it may get delayed due to late arrivals. We decompose the lateness of a single passenger into waiting at the origin and in-vehicle components. Then, we introduce recursive formulas to trace how delay propagates across the sequence of pick ups. We discuss two cases of delay, namely when the vehicle waits for the passenger and vice-versa. We introduce it for the so-called sequential shared rides (where pick-ups always precede drop offs) and then provide generalisation for non-sequential shared rides. Subsequently, we introduce strategic behaviours, where we assume that passengers do consider the other passengers' delay and interact in the form of a strategic game. Finally, we propose a method to assess system-wide impacts.
2.1. Lateness of a ride and associated passengers
Consider the following ride sharing situation: Passengers are offered a shared ride r. Index i represents in which order the passengers are picked up (Figure ). For now, we assume that all the pick ups take place before the drop offs, and we show at the end of this section what happens when this assumption is dropped. Each passenger has a scheduled pick up at the origin at time
and a scheduled drop off at the destination at time
, which makes a travel time
. Nevertheless, all these times might differ from the actual realisations of the trip due to passengers lateness:
Definition 2.1
Consider a passenger i that is supposed to be picked up at , but arrives at the pick up point at
, as illustrated in Figure .
Figure 2. Scheduled and realised ride travel time , delayed due to origin
and in-vehicle
delays.
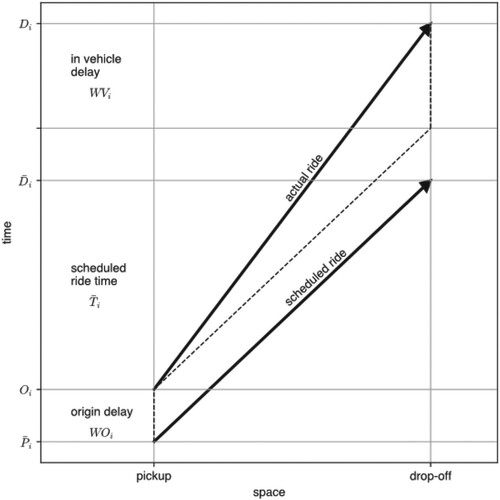
The lateness of this passenger is
(1)
(1)
These late arrivals induce delays in all the co-travellers. Let us denote the delay of passenger i, which is composed of two elements:
(2)
(2) where
is the waiting time at the origin, and
is time spent over the vehicle waiting for others. Waiting time at the origin is the difference between the actual pick up time
, that might be late if preceding passengers were late, and the actual arrival time of the passenger at the pick up location
, that might differ from the planned one if passenger i is late. Note that waiting time would be zero if nobody was late. Denoting
, we can express:
(3)
(3) To find expressions for
and for
, it is useful to define
as the accumulated delay of the vehicle right after picking up passenger i. We can define
, and note that
. In general, the accumulated delay only increases with passenger i if his delay is larger than the vehicle's. This can be expressed as a recursive function, with the following:
(4)
(4) yielding a closed-form formulation for
:
(5)
(5) The actual pick up times are then given by the latest between passenger's and vehicle's arrival at the pick up point:
(6)
(6) The max operator in Equation (Equation5
(5)
(5) ) suggests that the passengers' late arrival will likely lead to waiting times that increase with i (as more events will take place at consecutively traversed nodes, and the outcome will be driven by the latest of them). Consequently, the delay is a strictly non-decreasing function of i, due to the accumulation of lateness as the vehicle serves the shared ride.
For the sake of simplicity, we assume that passengers do not arrive at the pick up location earlier than scheduled. As long as the vehicle arrives at the first pick up as scheduled, subsequent pick ups cannot be served earlier than scheduled. Moreover, as we demonstrate below, the total ride delay is driven by the latest passenger, so early arrivals are unlikely to have an impact on it in rides of a high degree.
In the setting that we consider, passenger i may get delayed on-board only due to late arrival of passengers that come after (j>i). However, for this to happen, it is required that the lateness of the passenger being picked up exceeds the one accumulated by the vehicle, otherwise a late arrival has no impact (due to the max formulation in Equation (Equation5(5)
(5) )). When all these delays on-board the vehicle are added, what we obtain is the total vehicles' lateness, i.e.
, where N is the number of users (degree of the trip). Hence:
(7)
(7) Equation (Equation7
(7)
(7) ) implies that, for a given N,
decreases with i because
increases.
Putting everything together, we can conclude one of the main aspects of these dynamics. We define the delay with respect to the original arrival time, given by the delay of the actual trip
and the passenger's lateness:
(8)
(8) A careful analysis of the possible cases in Equations (Equation3
(3)
(3) ) and (Equation6
(6)
(6) ) (for details see the Appendix 1), reveals that:
(9)
(9) All passengers face the same delay when compared with the original departure time that coincides with the maximum lateness among the N passengers. The intuition behind Equation (Equation9
(9)
(9) ) is as follows: the arrival of each passenger to her/his final destination depends only on how late is the respective vehicle. However, not all the passengers are in the same situation: while the passengers picked up first will (likely) have to wait for the subsequent passengers on-board the vehicle, the passengers picked up later are expected to wait for the vehicle at their pick-up location. Note that this distinction might be important, as waiting time is usually considered less convenient than in-vehicle time, with higher associated costs, so users picked up later might be worse off.
The arrival delay for passenger i is , excluding her/his own lateness (we provide alternative formulations of delay, depending on the strategy in section 2.3). From Equation (Equation9
(9)
(9) ) we conclude that:
(10)
(10) Which, combined with Equation (Equation5
(5)
(5) ) provides the general expression for passengers' delay:
(11)
(11) We can synthesise the dynamic as follows: each time the vehicle arrives at a pick up point, either the respective passenger has to wait for it, or the vehicle has to wait for the passenger. The latter is the troublesome case, caused by a passenger that is too late in comparison with the vehicle, increasing its accumulated delay, prolonging the on-board delay for the preceding passengers and the waiting time for the proceeding passengers, until a new passenger presents a higher lateness.
2.2. Random passengers' arrival
Assume now that passengers' lateness follows some random distribution, i.e. , where F is the cumulative distributive function. For the sake of simplicity, let us assume that all
follow the same distribution (
) and that they are independent. We assume that
takes values that are greater or equal to zero (i.e.passengers never arrive early).
In this setting, we can further exploit Equations (Equation9(9)
(9) )–(Equation10
(10)
(10) ) to conclude on system dynamics that:
For a given shared ride degree N, the delay of each passenger
follows the same distribution. This can be concluded directly from Equation (Equation10
Sharing the ride with more passengers will increase the expected delay for all of them. This can be attributed to the fact that the delay depends on the maximum lateness among the passengers, which is likely to increase with N (as it is the maximum value over a larger number of draws from a random distribution).
Nevertheless, the marginal increase in the expected value of the delay decreases with each new passenger (derived in the Appendix 2).
2.3. Strategic passengers' arrival
Equation (Equation10(10)
(10) ) reveals that the arrival time at the destination, for each passenger depends on her/his arrival time at the pick up point. This motivates us to consider not only random lateness, but also analyse the case in which each passenger decides how late s/he is going to arrive at the pick up location. This can be modelled as a game, where:
Players are: passengers
The strategy of each passenger is to decide how late s/he is going to be
The disutility of each passenger is her/his total waiting time, expressed as a weighted sum of waiting at the origin and over the vehicle, plus
The disutility of the vehicle is its total lateness, which (according to Equation (Equation5
The analysis from previous sections allows us to obtain explicit expressions for the disutility of each passenger: Waiting time at the origin is given by the difference between her/his own lateness and the accumulated lateness of the vehicle , yielding
(14)
(14)
Waiting in the vehicle then becomes:
(15)
(15) And delay with respect to the original travel time is:
(16)
(16) where
.
Equations (Equation14(14)
(14) )–(Equation15
(15)
(15) ) imply that the terms in Equation (Equation12
(12)
(12) ) that deal with the waiting time decrease with
(the more delayed you are, the less you have to wait for others), while the third term in Equation (Equation12
(12)
(12) ) increases with
due to Equation (Equation16
(16)
(16) ) (the more delayed you are, the later you will arrive at your destination). We can study how these counter forces relate by means of the so-called best response function
, that selects the best strategy that player i can choose for a given strategy profile of the other players. According to Equations (Equation14
(14)
(14) ) –(Equation16
(16)
(16) ):
On the one hand,
On the other hand,
Therefore, we can conclude that under these assumptions, passengers always want to be exactly as late as the most delayed co-traveller:
(17)
(17) The only way Equation (Equation17
(17)
(17) ) can be fulfilled for every i is that
, for any
. That is to say, the set of pure Nash equilibria Footnote
2
are those strategy profiles in which all travellers are uniformly delayed. However, not all the equilibria are equally good: in each equilibrium, the players face no waiting time, but they are delayed with respect to their original arrival by
, so it is better if everybody is punctual; from the vehicle's point of view (which represents the impact over the whole system, as the vehicle is meant to serve other requests later), the larger the lateness of the passengers, the higher the disutility.
Which equilibrium is more likely to emerge? To study this, let us assume now that users cannot know exactly what the other travellers are doing, but they receive the information with some random noise η. We assume that it is a single noise for all the other players, i.e. i will select the best response according to the strategy profile . We assume that η presents a continuous distribution and that
. To simplify the analysis, we also consider that
. Recalling that
(Equation (Equation8
(8)
(8) )), the disutility can be written now as:
(18)
(18)
Which can be re-written including the noise and using Equation (Equation16(16)
(16) ) as
(19)
(19) The best response function is now obtained by minimizing the expected value (with respect to η) of the disutility. A careful analysis of the first-order conditions (in the Appendix 3) reveals that
is the best response to
iff
is a solution to the following equation in s:
(20)
(20) If s solving Equation (Equation20
(20)
(20) ) is larger than T, then the best response is
. Analogously, if the best solution is negative, then the best response is
.
Equation (Equation20(20)
(20) ) reveals a number of interesting properties. If
, i.e. if one minute of waiting is equally bad as one minute of late arrival, then Equation (Equation17
(17)
(17) ) holds (because
). If
(much larger than), then the right side of Equation (Equation20
(20)
(20) ) approximates 1 and
must be close or equal to its maximum value T; that is to say, if waiting is much more annoying than arriving late, users will prefer to be late just due to the misinformation (noise). If
, the right side of Equation (Equation20
(20)
(20) ) approximates 0 and
must be close or equal to its minimum value 0, i.e. it is better to be punctual because there is a chance that this hastens the arrival. What about the equilibria? The analysis is divided into cases:
If
If
If
Therefore, the two extreme equilibria are the most likely ones, depending on how users value their punctual arrivals at the destination and the time lost waiting for the vehicle or other users. When arriving punctually is a priority, users will be on time at their pick up points (the best equilibrium), just because there is a chance that the other users are punctual as well; in the opposite case, nobody will take the risk of having to wait, so everybody is as late as possible, which is the worst possible equilibrium. These results remain true when , if both are greater than
or both are lower than
.
2.4. System-wide impact of late arrival
As we demonstrate, late arrivals have a significant impact on travel experience. Shared-rides are likely to be delayed and the actual arrival time becomes unreliable. This will likely have an impact on passengers choices, which in turn affects the system as a whole.
We use a recently proposed demand-driven, off-line method to match trips into attractive shared-rides (Kucharski and Cats Citation2020). In this method, each passenger is treated as a rational decision-maker that maximises her/his utility when making travel decisions. In particular, the passenger opts for a shared ride only if the delays and detours, imposed due to sharing, are compensated with a discounted fare of a shared ride (de Ruijter et al. Citation2020); consequently, the detours and delays of shared rides are driven by the behaviour of the travellers and their willingness to share. This method allows us to incorporate the delays identified in the previous sections in the matching algorithm. In particular, the utility of the shared ride, typically composed of (among others) travel and waiting time, is now updated with the expected delay due to the late arrival of other passengers (as in Equation (Equation18(18)
(18) )). This is likely to impact the sharing utility and thus, passengers' decisions: whether to share or not and with whom to share.
We assume that the delay increases sub-linearly with the degree of the trip, based on previous sections' findings. This increase is crucial for the system's performance, making unreliable travel times impact the system's performance twofold. First, late arrivals increase the chance that a passenger opts for a non-shared ride. Second, rides of lower degrees will become more dominant in passengers' decisions. We analyse how varying levels of lateness impact, in such settings, the KPIs (key performance indicators) of shared rides, namely: number of shared rides in the solution, passenger-hours, and number of rides of a higher degree.
2.5. Generalisation to non-sequential shared-rides
So far, our analysis has assumed that the vehicle picks up all the passengers before dropping off any, in the so-called sequential shared-rides. However, this might be a too restrictive requirement, so we now examine the case where this assumption is relaxed. We still look into a single ride of a vehicle. For this analysis, the precise meaning of a ‘single ride’ implies that the vehicle has not updated its itinerary due to lateness, so this can apply either for vehicles that serve a given set of requests before accepting new ones, or for vehicles that are constantly being assigned to new users, that need to take lateness into account.
The crux of the analysis in this generalised case is that lateness still occurs only at the pick up points, when passengers arrive after the vehicle does. For a passenger i, denote and
their pick up and drop off order within the vehicle's itinerary, respectively. As in the original case, i will have to wait at her/his pick up point if and only if the vehicle carries an accumulated delay larger than the one of i:
(21)
(21) Similarly, passenger i waits on-board the vehicle only if the passengers picked up while s/he is on-board present a higher delay than the accumulated delay of the vehicle right after picking up i. An analogous analysis as in subsection 2.1 yields:
(22)
(22) The delay with respect to the original arrival time
does not include now the passengers that are picked up after i, i.e.:
(23)
(23) Recall that Equation (Equation9
(9)
(9) ) reveals that
does not depend on i in the original sequential case. This conclusion is no longer valid when the assumption is dropped; however, two passengers
and
will still face the same delay with respect to their original arrival times if the sets
and
are equal, i.e. if no one is picked up between the drop offs of
and
. That is to say, results from previous sections can be seen as the analysis over sub-segments of the vehicle's itinerary, whenever there is a stream of consecutive drop offs (which is why we keep the assumption in the upcoming sections). When this is not the case, and someone is picked up after
's drop off but before
's, then
might face a longer delay, i.e.
. Finally, the vehicle's total delay still depends on all the users of the ride, given by
.
3. Numerical simulations
In order to analyse the relevance of the theoretical results explained in the previous section, we conduct Monte-carlo simulations. We simulate 2000 realisations of a shared ride, each time independently drawing the delay of each passenger according to a given distribution, as in Section 2.2. We assume that each passenger has a probability p of being late, and when they are late, follows the positive part of a lognormal distribution (Figure ). The two parameters that define the system are p (which is fixed at 0.3 throughout the experiments) and
, the standard deviation of
. We start with fixed
and use it as a variable in Sections 3.3 and 3.5.
Figure 3. Lognormal distribution of passengers' lateness, we control the probability that this random variable is larger than zero (30% of the cases) and the delay variability ().
The number of users with whom the trip will be shared can range from one to ten. In order to focus on the analysis of passengers' arrival times, we assume that the total detour is independent of the ride degree. It is assumed that, at first, all passengers are picked up, and then they are dropped off in any order. We assume that travel times are either fixed or perfectly predicted at the matching phase.
A general overview of how delays affect users' and the vehicle's travelling times can be obtained from Figures , in which we summarise the results that emerge when the scenario is simulated 2000 times, for a fixed ride of four passengers. The code to reproduce the experiments and visualize the results is available at public repository (https://github.com/rafalkucharskiPK/ExMAS)
Figure 4. An itinerary of a ride shared by four passengers and its realisations. The scheduled times of consecutive pick ups and drop offs are marked with black lines. The curves represent results from 2000 Monte-carlo simulations, dashed blue for passengers' (late) arrival at consecutive pick up points, and green solid for the vehicle's departure (first at pick up points and then at drop offs).
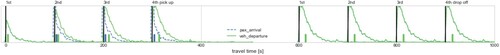
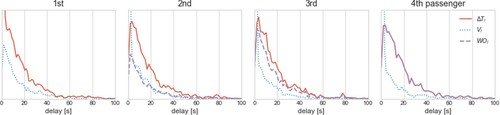
Figure 5. Distribution of the vehicle's waiting time (blue, dotted), passengers' waiting time (purple, dashed), and total delay (red, solid line), simulated for four consecutive picked up passengers.
First, Figure shows the distribution of passenger arrivals (blue dashed) and vehicle departures (green solid), which occurs when both the vehicle and the passenger are in the respective pick up point. The first four curves are pick ups, and the last four are drop offs. In the pick ups, for a single realisation, if the corresponding blue dashed line lies to the left of the green solid one, it means that the user had to wait for the vehicle. Note that this happens more often for the passengers picked up in the last places, i.e. the latter passengers wait at the origin more often than the earlier-on ones, due to the accumulated delay. In addition, the black lines represent the scheduled pick up and drop off times, so the drop off curves verify that the difference between the expected and the real drop offs does not change with the pick up position (as predicted by Equation (Equation9(9)
(9) )).
Figure shows, for each consecutive passenger, its waiting time at the origin (purple dashed), the time spent waiting by the vehicle (blue dotted), and the passengers' total delay (red solid). Note that vehicle's wait tends to disappear towards the last passenger, because it is positive only if this passenger has the largest lateness. The total delay
is partially explained by the users' waiting time, and its share increases from the first passenger, in which the user does not have to wait for the vehicle, until the last passenger, for whom the delay is fully explained by the waiting time, which is induced by the late arrivals of the earlier passengers. It can be observed that the total delay has the same distribution for all the passengers as the red curves are similar but not equal.
3.1. Impact of the degree of the trip
We have theoretically shown in the previous section that passengers become more delayed when there are more passengers. To show this numerically, we analyse how the vehicle's total delay changes with N (). As predicted by the theoretical formulations, the larger is the number of sharing travellers, the more relevant is the lateness, but this increase becomes less significant when N is greater. In Table we report the relative increments of the 85th percentile of the delay (i.e.
, where
stands for the 85th percentile of x), to find that the relation is not linear, as growth rate decreases with i and eventually stabilises when the degree goes beyond six.
Figure 6. Average delay varying with the number of co-riders (trip degree).
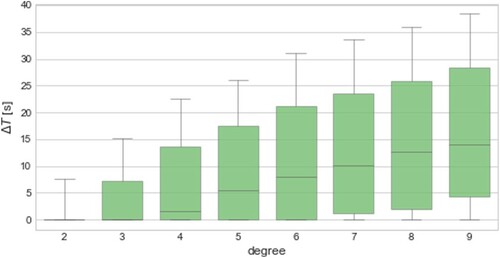
Table 1. Relative increase of the 85th percentile of the ride delay for rides of increasing degree.
3.2. Changes with the pick up position of the passenger
We now investigate how users' experience changes depending on their pick up positions. We now consider a ride with a fixed degree (10 passengers) from the perspective of consecutively picked up passengers. We run Monte-Carlo simulations and examine in Figure the outcomes in terms of: a) waiting time at the origin b) waiting time while boarding the vehicle
and c) total delay
(recall that this is equal to the sum of the two previous ones).
Figure 7. Distribution of delays (box-plots of 2000 Monte-Carlo runs) for consecutive passengers in a ride shared by ten of them. While total delay is stable (c), the origin waiting time (a) increases for subsequent passengers and in-vehicle waiting time (b) decreases.
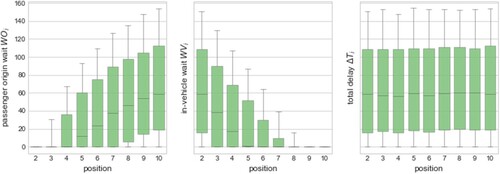
As predicted by our theoretical formulation, the total delay follows the same distribution (Figure (c)). It is in fact driven by the latest arriving passenger, who will contribute equally to the each passenger's, regardless of the position. Similarly, the total vehicle delay is the sum of delays at consecutive nodes (Figure (b)), yet due to its cumulative nature, mainly early passengers will contribute to this delay. Passengers picked up at final positions have a small probability of being delayed more than all the preceding ones. This explains the negative trend exhibited in (Figure (b)). The opposite trend is visible for the passengers' waiting time at the origin (Figure (a)), where the first passenger has a null probability of waiting, which then gradually grows for each consecutive passenger.
The observed trends regarding the delay composition can be of high importance. In particular, considering that behavioural findings suggest that waiting time is perceived differently than in-vehicle time (e.g. in the context of public transport, Fan, Guthrie, and Levinson Citation2016; Yap, Cats, and van Arem Citation2020), a topic that needs further understanding in the context of shared rides.
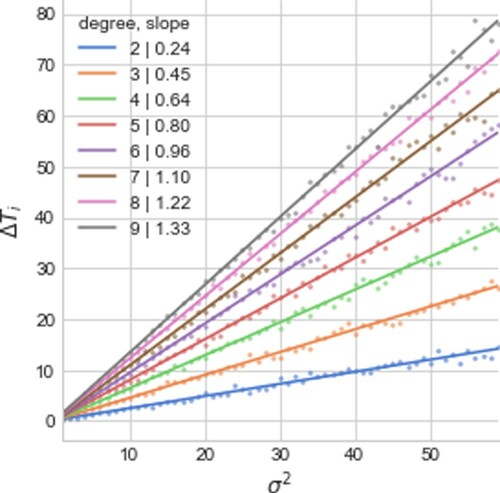
3.3. Varying lateness
In this section, we study the impact of the variance () of the lognormal distribution, i.e. the extent to which passengers are late. For this, we show in Figure the change in the total vehicle's delay
. Of course, this delay increases when lateness does, yet notably, the change is more relevant for rides of higher degree: an almost linear growth can be observed within each trip degree, but the slope is much steeper as the number of users increases. These different slopes are not innocuous: if the variability is low, shared rides of higher degree remain within an acceptable delay, but if the process is more random, then higher degree rides may become non-viable.
Figure 8. Vehicle's delay plotted against the variance of the lateness in passengers' arrival, for various ride degrees. Trends are linear for each degree, but the sensitivity (slope) is greater for rides of higher degree.
3.4. Strategic arrival
Instead of delving into the possible strategies that each passenger can choose when the lateness is decided, let us show results from a simpler case: each passenger decides only between being punctual and being late, and if s/he is late then is random.
We analyse this situation through a ride shared by five passengers, each one selecting whether to be punctual or not. We focus on the second passenger of the shared ride, and examine the outcomes of the strategy selected by her/him, subject to other passengers' strategies. We describe the outcomes using three variables representing the disutility functions in this game, as explained in Equations (Equation12(12)
(12) )–(Equation13
(13)
(13) ). Figure (a) reveals the arrival time at destination (related to
), Figure (b) shows her/his total travelling time (dealing with
and
), and Figure (c) shows the vehicle's disutility given by its delay
.
Figure 9. Three outcomes of alternative strategies (being punctual - right bar, and being late - left bar), for a passenger picked up second in a ride shared by five passengers, depending on how many co-travellers are late: arrival time (a), travel-time (b) and vehicle delay (c).
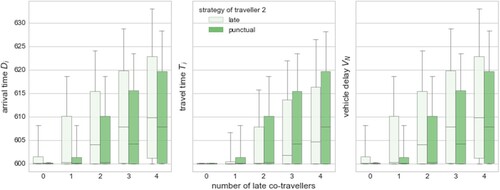
In general, the more passengers deciding to be late, the more negatively it impacts both the system (represented by the disutility of the vehicle) and other passengers. However, the outcomes of individual strategies on their own experience are not obvious. As discussed in Section 2.3, if the passengers aim to arrive at the destination as soon as possible, the strategy of being punctual is dominant regardless of the strategies adopted by the co-travellers (Figure (a)). Notwithstanding, if the passengers aim to minimise their own travel time (elapsed time between their arrival at the pick up point and the drop off at destination
), results are different, and the passenger is better-off being late (Figure (b)). Yet, such a strategy is likely to deteriorate the system's performance (Figure (c)), since being late contributes to the total vehicle's delay.
3.5. The consequences of late passenger arrivals for sharing
We study now the impact of late arrival, which has been quantified in the previous sections, on the global performance of shared rides system. We simulate how 3000 passengers are matched into attractive shared rides in Amsterdam we use an open-source ExMAS algorithmFootnote
3
from Kucharski and Cats (Citation2020)). We aim to explore how do the late arrivals and vehicle delays impact the shareability of the ride-pooling system and the time costs of the users. We first assume that travel times are as scheduled (no lateness), and then gradually increase the magnitude of late arrival (). We reproduce the phenomena visualised in Figure and update the expected travel and waiting time accordingly as a function of ride degree and variability
. For each new variability level, we re-calculate the utilities according to these values. Utilities are then used by passengers to make travel decisions – choosing between a private ride and a shared ride – presumably different when variability is included.
The results indicate that the impact of lateness is significant. From a state in which almost half of the passengers are willing to share a ride, lateness can lead to all passengers refraining from sharing (Figure ). We observe it as a gradual increase in the total number of rides and a decreasing number of shared rides in the solution (Figure (a)). The trend, however, is non-linear: a mild increase in variability barely impacts the composition of shared rides, yet after a certain threshold is reached, passengers gradually resign and shift towards private (non-shared) ride. Consequently, a similar trend may be observed in the total travel costs (passenger-hours) which remain stable until it grows rapidly when a certain threshold is reached (Figure (b)). Notably, the threshold for rides of higher degree is reached earlier. While for of 10 the number of shared rides remains almost intact, the number of rides of higher degree drops almost to zero.
Figure 10. Impact of varying lateness of passengers on matching of 3000 passengers into attractive shared-rides. The percentage of travellers opting for shared vs. private rides (a), total travellers costs (b), number of high degree rides (three or more travellers) in the solution (c).
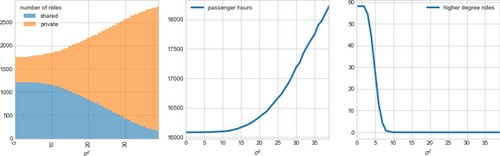
This suggests that there are two system-wide effects of variability, which are reached at two different thresholds of variability. First, when passengers start avoiding rides of high degree, and second, when they avoid shared rides at all.
4. Discussion and conclusions
We have analysed a unique feature of service uncertainty associated with ride-pooling services, namely how passengers' non-punctual arrival at the pick up points impacts the system's performance. We considered a setting in which, instead of focusing on travel times, we look at the passengers' arrival times at their pick up points as the source of unreliability. We proposed a theoretical framework to quantify the impact of late passengers, and investigated the cases in which lateness is either random or strategically decided. We distinguish between two components of passengers' delay. First, a passenger may be delayed at her/his own origin, if the vehicle is delayed and the passenger has to wait for it. Second, in-vehicle time may be delayed as other passengers arrive late, and the vehicle needs to wait for them while other passengers are on-board. While the former one may also be observed in public transport, the latter phenomenon is specific to ride sharing.
We formulate the delay as a recursive function and find the following:
the total vehicle delay is commanded by the latest passenger (i.e. that arrives with the highest delay at her/his own pick up point),
passengers' waiting time at the origin is determined by the latest passenger picked up prior,
the on-board delay of a passenger is determined by the latest passenger picked up en-route.
If we further assume that passengers arrive following a random distribution, then each additional passenger is likely to increase the delay of other passengers. However, the marginal impact of each additional passenger will decrease. Until the level of eight passengers, we observed a clear increasing trend. Surprisingly, in this setting, the total travel time delay follows the same distribution for all sharing passengers that are dropped off consecutively, as long as the ride degree is the same. However, the composition of this delay is different: passengers being picked up earlier will wait for others over the vehicle, whereas those picked up later will wait at the pick up point for the vehicle (that has already accumulated some delay) to arrive. Those passengers that perceive waiting time at the origin in a very negative way, may start avoiding rides in which they are picked up at a later stage.
We then turned to consider that passengers are strategic individual decision-makers, resulting in interesting collective patterns. The system will benefit from passengers deciding to arrive punctually, and other passengers will also benefit if others arrive punctually. This allows us to hypothesise on the stable point of such an evolutionary game, namely that all passengers will decide to arrive punctually if they aim to arrive as early as possible at their destination. However, if passengers aim to minimise their own travel time, they are likely to pursue the strategy of arriving late at their origin, which will result in a significant drop in the system-wide performance.
The system-wide impact of late arrival is negative. Even mild lateness of passengers is likely to shift out other users from high degree rides, crucial to achieve higher occupancy rates and thus gain efficiency and economies of scale in ride-pooling systems. High unreliability of arrival will eventually divert passengers towards private and more reliable services.
Notably, we found that the negative impacts are more pronounced for rides of higher degrees. Rides shared by many passengers, even without considering reliability, are troublesome because they impose a greater detour that needs to be compensated with a discounted fare. Sadly, our findings are unfortunate for rides of a higher degree. The average trip delay increases with the number of passengers. This happens because each additional passenger, possibly late, might impose an additional delay (in addition to the extra detour). Moreover, the impact of a higher lateness' variability exacerbates with each additional passenger. In particular, if we assume that the variance of passengers' late arrival is s instead of 10s, the average delay grows from 3s to 10s for rides of degree two. The same increase in
implies, in the case of rides of degree four, an augment from 10s to 40s, which is likely to be declined by passengers.
These theoretical findings shall further be empirically underpinned using data on actual passengers' arrival. Policy or practice implications of those findings are relevant for both transport authorities and ride-pooling service providers. Transport authorities may take passengers' inclination for late arrival into consideration in the assessment of service reliability as well as in the allocation of curbside capacity. Service providers may devise incentive schemes to encourage passengers to arrive punctually so that passengers internalise the negative externalities of their late arrival. Specifically the findings from strategic behaviour may be used to efficiently control the arrival process and thus improve the system performance. The exact specification and assessment of such policies should be subject to further research. In particular, the mobility traces, with information on the actual origin waiting time, are needed for passengers and vehicles to estimate and calibrate the model specifications. While the proposed method focuses on the origin arrival process, unreliable vehicles' arrival times, as well as traffic-dependant travel times, are an inherent part of the complete process. The proposed method can be extended to accommodate other sources of uncertainty. In particular, the travel time may be assumed non-deterministic, which can be included in the method by adding the extra travelling time to the accumulated lateness of the vehicle in Equation (Equation4
(4)
(4) ). If travelling times happen to be much larger than the expected ones, passengers' delays become irrelevant because they would have to wait for the vehicle anyhow. Likewise, the vehicle's arrival at the first node may be assumed delayed (
): To address this aspect, vehicles may be treated as if they were the first passenger who arrives randomly, with the remainder of the method remaining intact.
Passengers' preferences in the context of shared rides are increasingly understood thanks to recent behavioural studies (e.g.Alonso-González et al. Citation2020a). Revealed clusters of latent aptitudes towards sharing calls for a personalised approach to service provision. Passengers vary in terms of their value of time, willingness to share, trips' purposes, and time elasticity. This heterogeneity should be accounted for to ensure the value proposition of tailored, attractive services. Service providers can collect and process behavioural data to infer users' actual arrival strategy. This opens a way to pool passengers into rides based on their arrival strategy, where punctual passengers may be pooled together in different groups than late ones, benefiting both groups and the system as a whole.
Finally, our analysis was performed in the context of an offline planned system, and conclusions may change if applied to online, in a real-time setting. For example, if some new passengers will be picked up while others have already arrived at destinations, our results will be valid for sub-segments of the trip (in which the assumption of pick ups before drop offs is valid). Nevertheless, our method is generalisable, and may be used, for instance, in the trip-to-vehicle matching process. The dispatcher can make a decision on assigning the incoming requests to available vehicles taking into account also, for example, the accumulated delay for passengers already on-board and the expected delay due to the new incoming requests. Such an approach may be embedded in the recently proposed real-time method of Fielbaum and Alonso-Mora (Citation2020).
Acknowledgments
Part of this research was supported by the CriticalMaaS project (grant number 804469), which is financed by the European Research Council and the Amsterdam Institute of Advanced Metropolitan Solutions. Another part was supported by Didi Udian Technology (Shenzhen) Co. Ltd.
Disclosure statement
No potential conflict of interest was reported by the authors.
Additional information
Funding
Notes
1 Other authors refer to this concept as pooled rides or ride-splitting. See Shaheen (Citation2016) for a review of terms and definitions.
2 A pure Nash equilibrium is a set of strategies (one per player), such that no player can unilaterally increase her/his utility by changing her/his strategy, i.e. where every player is selecting the best response
References
- Alonso-González, María J , Sascha Hoogendoorn-Lanser , N. van Oort , Oded Cats , and Serge Hoogendoorn . 2020a. “Drivers and Barriers in Adopting Mobility As a Service (MaaS)–A Latent Class Cluster Analysis of Attitudes.” Transportation Research Part A: Policy and Practice 132: 378–401.
- Alonso-González, María J. , Niels van Oort , Oded Cats , Sascha Hoogendoorn-Lanser , and Serge Hoogendoorn . 2020b. “Value of Time and Reliability for Urban Pooled on-demand Services.” Transportation Research Part C: Emerging Technologies 115: 102621.
- Alonso-Mora, Javier , Samitha Samaranayake , Alex Wallar , Emilio Frazzoli , and Daniela Rus . 2017. “On-demand High-capacity Ride-sharing Via Dynamic Trip-vehicle Assignment.” Proceedings of the National Academy of Sciences 114 (3): 462–467.
- Bansal, Prateek , Yang Liu , Ricardo Daziano , and Samitha Samaranayake . 2019. “Can Mobility-on-Demand Services do Better After Discerning Reliability Preferences of Riders?” arXiv preprint arXiv:1904.07987 .
- Dolgui, Alexandre , Dmitry Ivanov , and Boris Sokolov . 2018. “Ripple Effect in the Supply Chain: An Analysis and Recent Literature.” International Journal of Production Research 56 (1–2): 414–430. https://doi.org/https://doi.org/10.1080/00207543.2017.1387680.
- Fan, Yingling , Andrew Guthrie , and David Levinson . 2016. “Waiting Time Perceptions At Transit Stops and Stations: Effects of Basic Amenities, Gender, and Security.” Transportation Research Part A: Policy and Practice 88: 251–264.
- Fielbaum, Andres , and Javier Alonso-Mora . 2020. “Unreliability in Ridesharing Systems: Measuring Changes in Users' Times Due to New Requests.” Submitted .
- Gargiulo, Eleonora , Roberta Giannantonio , Elena Guercio , Claudio Borean , and Giovanni Zenezini . 2015. “Dynamic Ride Sharing Service: are Users Ready to Adopt it?.” Procedia Manufacturing 3: 777–784.
- Heilporn, Géraldine , Jean-François Cordeau , and Gilbert Laporte . 2011. “An Integer L-shaped Algorithm for the Dial-a-Ride Problem with Stochastic Customer Delays.” Discrete Applied Mathematics 159 (9): 883–895.
- Horowitz, Abraham D. , and Jagdish N. Sheth . 1977. “Ride Sharing to Work: An Attitudinal Analysis.” Forecasting Passenger and Freight Travel. Transportation Research Record. Transportation Research Board (637): 1–8. https://trid.trb.org/view/73083 .
- Javanshour, Farid , Hussein Dia , and Gordon Duncan . 2019. “Exploring the Performance of Autonomous Mobility on-demand Systems Under Demand Uncertainty.” Transportmetrica A: Transport Science 15 (2): 698–721.
- Kim, Jinhee , Soora Rasouli , and Harry Timmermans . 2017. “Satisfaction and Uncertainty in Car-sharing Decisions: An Integration of Hybrid Choice and Random Regret-based Models.” Transportation Research Part A: Policy and Practice 95: 13–33.
- Kucharski, Rafał , and Oded Cats . 2020. “Exact Matching of Attractive Shared Rides (ExMAS) for System-wide Strategic Evaluations.” Transportation Research Part B: Methodological 139: 285–310.
- Li, Wenxiang , Ziyuan Pu , Ye Li , and Xuegang Jeff Ban . 2019. “Characterization of Ridesplitting Based on Observed Data: A Case Study of Chengdu, China.” Transportation Research Part C: Emerging Technologies 100: 330–353.
- Liu, Zhiguang , Tomio Miwa , Weiliang Zeng , Michael G. H. Bell , and Takayuki Morikawa . 2018. “Shared Autonomous Taxi System and Utilization of Collected Travel-time Information.” Journal of Advanced Transportation 2018.
- Liu, Zhiguang , Tomio Miwa , Weiliang Zeng , Michael G. H. Bell , and Takayuki Morikawa . 2019. “Dynamic Shared Autonomous Taxi System Considering on-time Arrival Reliability.” Transportation Research Part C: Emerging Technologies 103: 281–297.
- Narayanan, Santhanakrishnan , Emmanouil Chaniotakis , and Constantinos Antoniou . 2020. “Shared Autonomous Vehicle Services: A Comprehensive Review.” Transportation Research Part C: Emerging Technologies 111: 255–293.
- Pimenta, Victor , Alain Quilliot , Hélène Toussaint , and Daniele Vigo . 2017. “Models and Algorithms for Reliability-oriented Dial-a-Ride with Autonomous Electric Vehicles.” European Journal of Operational Research 257 (2): 601–613.
- Rezapour, Shabnam , Janet K. Allen , and Farrokh Mistree . 2015. “Uncertainty Propagation in a Supply Chain Or Supply Network.” Transportation Research Part E: Logistics and Transportation Review 73: 185–206. http://www.sciencedirect.com/science/article/pii/S136655451400177X .
- Ruijter, Arjan de , Oded Cats , Javier Alonso-Mora , and Serge Hoogendoorn . 2020. “Ride-Sharing Efficiency and Level of Service Under Alternative Demand, Behavioral and Pricing Settings.” Transportation Research Record . https://scholar.google.com/scholar_lookup?title=Ride-sharing%20efficiency%20and%20level%20of%20service%20under%20alternative%20demand%2C%20behavioral%20and%20pricing%20settings&publication_year=2020&author=A.%20de%20Ruijter&author=C.%20Oded&author=A.-M.%20Javier&author=H.%20Serge.
- Shaheen, Susan A. 2016. “Mobility and the Sharing Economy.” Transport Policy 51 (Supplement C): 141–142.
- Tu, Meiting , Ye Li , Wenxiang Li , Minchao Tu , Olivier Orfila , and Dominique Gruyer . 2019. “Improving Ridesplitting Services Using Optimization Procedures on a Shareability Network: A Case Study of Chengdu.” Technological Forecasting and Social Change 149: 119733.
- Wang, Hai , and Hai Yang . 2019. “Ridesourcing Systems: A Framework and Review.” Transportation Research Part B: Methodological 129: 122–155.
- Welch, Timothy F , Steven R Gehrke , and Alyas Widita . 2020. “Shared-use Mobility Competition: a Trip-level Analysis of Taxi, Bikeshare, and Transit Mode Choice in Washington, DC.” Transportmetrica A: Transport Science 16 (1): 43–55.
- Yap, Menno , Oded Cats , and Bart van Arem . 2020. “Crowding Valuation in Urban Tram and Bus Transportation Based on Smart Card Data.” Transportmetrica A: Transport Science 16 (1): 23–42.
Appendices
Appendix 1. Proof that
We need to prove that . Let us separate the analysis in two cases, depending on whether passenger i waits for the vehicle at the pick up point.
Case 1:
: If the passenger does not wait at the pick up point, it means that his lateness is larger than the one accumulated by the vehicle so far. Hence, using Equation (Equation15
(15)
(15) ), we conclude that:
Hence, by means of Equation (Equation7
(7)
(7) ):
Which proves the result.
Case 2:
: Equation (Equation3
(3)
(3) ) implies that
, and then
Due to Equation (Equation6
(6)
(6) ). Furthermore, we know that
because Therefore:
Which proves the result.
Appendix 2. Proof that total delay increases with the number of passengers, at decreasing rates
For this proof, we first need to note that we are comparing the outcome of two different random variables. Strictly speaking, what we are going to show is that if we denote the cdf of
, then:
In fact:
Where we are using independence in the last equality. As
, it follows directly that
. For the decreasing rates, note that
which is greater or equal than zero.
Appendix 3. First-order conditions for the best response when passengers decide strategically with noise
Taking expected values and rearranging terms on Equation (Equation19(19)
(19) ):
Denoting f the probability density function of η, this can be re-written as:
The integral is split into:
By means of the fundamental theorem of calculus, the derivative of the expected value of the utility with respect to
is:
This is an increasing function of
, meaning that the function we are aiming to minimise is convex, so the first-order conditions are sufficient. If this function reaches zero for some
, that
is the best response. The final expression equals zero iff
If the derivative does not reach zero, it means that it is either always positive or always negative. In the former case, the disutility increases with
so the best response is zero. In the latter, the disutility decreases and the best response is T.