
Abstract
In this investigation, we have shown that the combination of deep learning, including natural language processing, and conformal prediction results in highly predictive and efficient temporal test set sentiment estimates for 12 categories of Amazon product reviews using either in-category predictions, i.e. the model and the test set are from the same review category or cross-category predictions, i.e. using a model of another review category for predicting the test set. The similar results from in- and cross-category predictions indicate high degree of generalizability across product review categories. The investigation also shows that the combination of deep learning and conformal prediction gracefully handles class imbalances without explicit class balancing measures.
1. Introduction
Sentiment analysis investigates consumers’ opinion, or sentiment, toward certain products or entities and is one of the fastest growing research areas in computer science. For recent papers and reviews, see, for instance, (Liu, Citation2010; Mäntylä et al., Citation2018; Pang & Lee, Citation2008; Redhu et al., Citation2018; Yaakub et al., Citation2019). Sentiment analysis aims to automatically determine the expressive direction (sentiment) of user product reviews (Luo et al., Citation2016) and the demand for such analysis has increased due to growing requirements of analyzing and structuring information in various social media in the form of unstructured data (Haenlein & Kaplan, Citation2010). This, in turn, has been prompted by the growing power of user-generated product reviews influencing consumer’s purchasing decisions known as electronic word-of-mouth (eWOM). eWOM is defined as “the dynamic and ongoing information exchange process between potential, actual, or former consumers regarding a product, service, brand or company, which is available to a multitude of people and institutions via the Internet” (Ismagilova et al., Citation2017) and has become an important source of information for consumers. One way to perform this analysis, that has proven to be successful, is through the use of machine learning.
Machine learning has, for the past decade, come to play an increasingly more important part in sentiment analysis (Ding et al., Citation2020; Hossain et al., Citation2013; Yaakub et al., Citation2019). The recent advent and progress in deep learning methodology (Goodfellow et al., Citation2016; Wang et al., Citation2020) has further increased the usage and utility of machine learning in the sentiment analysis domain (Ain et al., Citation2017; Araque et al., Citation2017, Citation2018).
A problem in machine learning is many times the lack of rigidly defined confidence measures for predictions resulting from such approaches (Bhattacharyya, Citation2013; Dinga et al., Citation2019) and, thus, the inability to answer the question: from which part of review (feature) space can reliable predictions be expected?
Conformal prediction is a framework, within the family of confidence predictors, that enables such rigidly defined confidence measures on an instance level (i.e. for each review) given that data are exchangeable (Vovk et al., Citation2005). It should here be noted that all machine learning methods in general assume at least exchangability or, many times, the stricter assumption of the data to be IID (Independent and Identically Distributed) which means that there are no new requirements introduced by conformal prediction when building confidence predictors.
Deep learning has previously been used for sentiment analysis of Amazon data using word vectors and a recurrent neural network of almost 5.2 million reviews from the categories: beauty, book, electronic, and home (Shrestha & Nasoz, Citation2019) also in combination with density-based conformal prediction (Messoudi et al., Citation2020) where one of the three investigated datasets was the well-balanced (1:1) 50k IMDb review dataset (Maas et al., Citation2011).
In this work, we analyze Amazon customer reviews using deep learning and Mondrian conformal prediction (Vovk et al., Citation2005), i.e. class-wise conformal prediction, related to 12 Amazon product categories (), with highly imbalanced sentiment classes.
Table 1. Dataset characteristics.
2. Method
2.1. Data collection
The data used in this investigation are a set of 12 categories of five-core product reviews collected from amazon.com () (https://nijianmo.github.io/amazon/index.html, accessed 23 April 2020). The five-grade (1–5) grading system was converted into a binary negative (1–2) (class negative) vs. neutral-positive (3–5) (class neutral and positive) classification system. All datasets are highly imbalanced () with imbalance ratios of between ∼6.7:1 and 17.4:1.
2.2. Data processing
The Amazon reviews consist of several sections where the following sections were used in this analysis:
“overall” = sentiment, “reviewTime,” “reviewerID,” “asin,” “reviewText,” and “summary”:
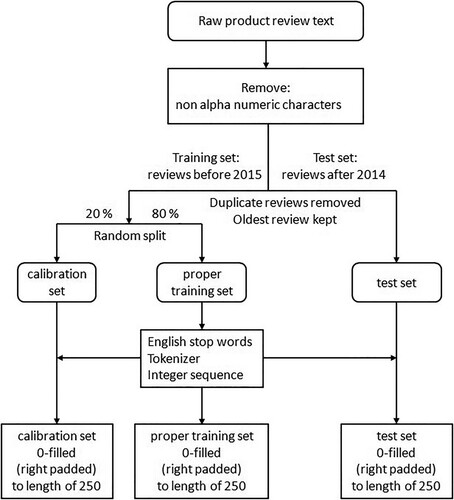
All non-alpha numeric characters were removed from the “reviewText” section and the “summary” section was then added to the “reviewText” section.
The “reviewText” section of each dataset was split in a temporal manner into a training set consisting of reviews before 2015 and a test set consisting of reviews after 2014. For multiple reviews made by the same reviewer (reviewerID) and item (asin), only the oldest review was kept regardless of whether the review was published before 2015 or after 2014.
The training set was subsequently randomly split into a proper training set (80%) and a calibration set (20%).
English stop words were imported from the Natural Language Toolkit (nltk) corpus and removed from the “reviewText” section. The vocabulary size for the tokenizer was set to 20,000 words and the tokens were generated from the proper training set and later transformed into a sequence of integers for each review and, if needed, 0-filled (right padded, i.e. adding zeros at the end of the sequence) to a constant length of 250.
The data processing pipeline is depicted in .
Figure 1. Data processing pipeline.
2.3. Deep learning and conformal prediction
2.3.1. Deep learning architecture
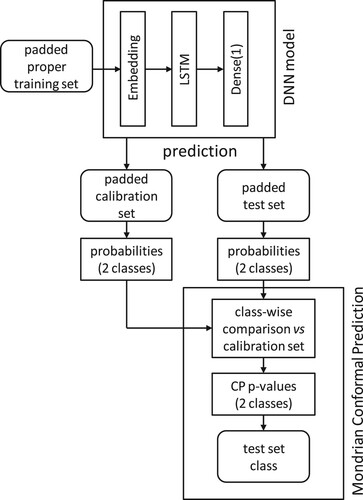
The deep neural network (DNN) layout used in this study was inspired by the Knime example on sentiment analysis (https://hub.knime.com/knime/spaces/Examples/latest/04_Analytics/14_Deep_Learning/02_Keras/08_Sentiment_Analysis_with_Deep_Learning_KNIME_nodes, accessed 10 April 2020) and the code at https://github.com/keras-team/keras/blob/master/examples/imdb_lstm.py (accessed 10 April 2020). The layout consists of three parts – an embedding layer converting each review into a fixed length vector), the long short-term memory (LSTM) part enabling the network to learn from past observations, and an output layer providing the probability of a review being negative or neutral and positive. The layout is depicted in (DNN model). Check-pointing, in this case saving the best model according to the validation set loss function, was also used in order not to over-train the model.
Figure 2. Model building using DNN and Conformal Prediction.
See Supplementary material for the DNN model building code.
2.3.2. Mondrian conformal prediction
Conformal prediction (CP) performs a recalibration of the original output from the DNN model in order to account for class imbalances and Mondrian conformal prediction (MCP) performs this recalibration separately for each class (negative and neutral and positive, respectively).
Thus, in the MCP part of the model building process, the output from the DNN model (probabilities for each of the two classes) for each review in the test was compared to the corresponding list, sorted in descending order, of calibration set probabilities for each class. The fact that a separate list is used for each class constitutes the Mondrian part of CP. The user has to set a significance level (the percentage of prediction errors that is acceptable) and the positions of each test set review in these two calibration set lists determine the class assignment.
Below is a short illustrative demonstration example of how this recalibration is performed (the actual calibration lists sizes for both classes are much larger).
In , the two separate lists of sorted calibration set class probabilities, one for each class, are shown to the left and right, and contain 19 and 9 predictions, respectively. In the upper-middle table, the predictions (class probabilities) for a set of five test reviews are shown. For each test review, the probability predictions for each class are then placed in the corresponding list of sorted calibration set class probabilities and the number of probabilities with lower or equal values are counted. For the first review, the value of 0.047 is therefore placed at the very end of the list while the value of 0.953 has seven lower values. Both lists have now been extended by 1 prediction, the test review to be determined, making them contain 20 and 10 predictions, respectively. The significance level (error rate) in this demonstration example is set to 0.2 (20% accepted errounous predictions). The ratios between the number of predictions with lower or equal probabilities to the new test review and the total number of predictions in each list are 0/20 ( = 0) and 7/10 ( = 0.7), respectively. Since the former ratio is lower than the significance level of 0.2, the prediction cannot be considered as neutral-positive. The latter ratio is, however, higher than 0.2 and the prediction can be considered as a negative class prediction. Thus, the review prediction will be classified as “negative.” The remaining four reviews are classified in same manner. Since the fourth review has ratios for both classes that are equal to the significance level, the prediction is then given for both classes (neutral-positive and negative) as an outcome (the both class). Notably, despite that the second review has a relatively high prediction probability for the neutral-positive class (0.892) and a relatively low prediction probability for the negative class (0.108), the review is still correctly classified as “negative” by the conformal prediction recalibration procedure despite the large-class imbalance that exists between the neutral-positive and negative class in this investigation.
Figure 3. Mondrian conformal prediction recalibration scheme.
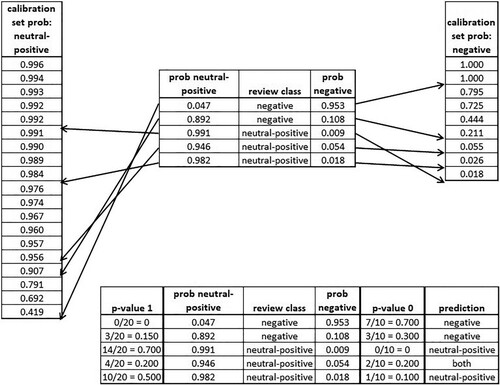
For a binary classification task, the outcome for MCP can be one of the four possibilities: negative class, neutral-positive class, both (negative and neutral-positive) classes (the both class) or none of two classes (the empty class). For further description of this procedure, see Norinder et al., (Citation2018). In MCP, a prediction is determined as correct if the prediction contains the correct class which means that both predictions are always correct since they, for binary classifications, always contain the correct class and empty predictions are always erroneous since no classes are included in the prediction. The latter is also an indication of that these predictions are outside the applicability domain of the model where reliable predictions can be made.
There are two key properties in MCP that need to be defined: Validity and efficiency. The validity (for each class in MCP), which is guaranteed by the mathematical proof (Vovk et al., Citation2005) given that the data are exchangeable, is defined as the percentage of correct predictions for each class. Efficiency is defined as the percentage of single-class, i.e. negative or neutral-positive, predictions irrespective of whether the prediction is correct or not. For the demonstration, example above the validity is 1.0 (100%) since all predictions are correct (the both prediction always being correct) while the efficiency is 0.8 (80%, four single-class predictions out of five).
3. Results (and Discussion)
The results from the analysis are presented in and and . Inspection of shows that all models are valid, given some small statistical fluctuations, or, for the most part, somewhat over-conservative, e.g. the error rate is smaller than the error rate (significance level) set by the user which is especially true for the majority, neutral-positive, class. The error rate where maximum efficiency, i.e. maximum single-class (neutral-positive or negative) predictions, occurs is around 12.5% for all datasets except for Books. The maximum efficiencies are very high with values between 97.4% and 99.9% both for the majority () and minority () classes, respectively. For Books all predictions are single-class (100% efficiency). Accuracy, in this case balanced accuracy (BA), calculated for single-class predictions, is high and is between 89.8 and 92.2% at the maximum efficiency error rate of 12.5%. Since efficiency is very high, the difference between calculated validity and BA is small and other, more traditional, measures useful for imbalanced datasets, e.g. Cohen’s Kappa and Matthews Correlation Coefficient, can also be inspected in order to assert the quality of the derived models. Also, these measures show high numbers indicative of models with significant predictive ability. Furthermore, measures such as sensitivity and specificity indicate significant predictive ability of the derived models with values between 0.90 and 0.97 and 0.88 and 0.96 for the former and latter measures, respectively. It should here also be noted that all of the reviews in the test set is of later, i.e. newer, date than the reviews in the training set and therefore the external test set predictions are of prospective nature which is many times considered more challenging than predicting from the same time span as that of the training set.
Figure 4. Test set efficiency for the neutral-positive majority class.
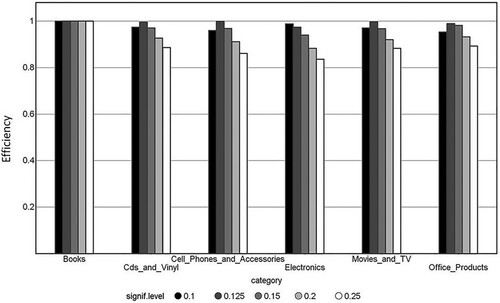
Figure 5. Test set efficiency for the negative minority class.
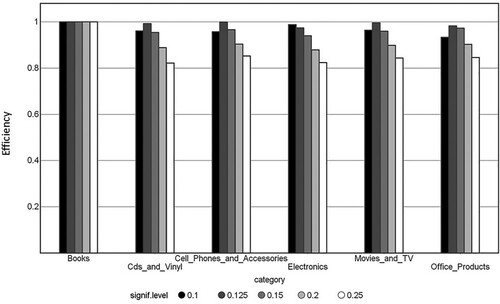
Table 2. External test set results from DNN/CP modelling.Table Footnotea
However, the described procedure of data preparation and machine learning does not, in its present form, seem to be able to handle all kinds of imbalanced review types. For datasets with a low median number of words per review, somewhere below 70 words for negative reviews, the proposed procedure is not able to establish a model but simply returns all predictions as if they were neutral-positive, i.e. the majority class (; successful = no). Several modifications to the protocol have been investigated, such as enlarging the vocabulary size, different sizes of nodes in the DNN layers, various over- and/or under-sampling techniques in order to balance the two classes and weighting schemes both with respect to class, but also reviews, without success. It should be noted that for the cell phones and accessories dataset, a successful model was developed although the set has a low median number of words per review, below 70 words for the negative reviews, and vice versa for the musical instruments dataset where no model was successfully created. A likely explanation for these results is that the former dataset has the highest percentage of negative reviews (12.9%) of all the studied categories, while the opposite is true for the latter dataset where only 6.2% of reviews are negative making it the second lowest investigated category.
Deep learning has been successfully used for sentiment analysis of Amazon data, as previously referred to, using word vectors and a recurrent neural network of almost 5.2 million reviews using a training set based on four categories (beauty, book, electronic and home) (Shrestha & Nasoz, Citation2019), indicating some level of generalizability between categories. Therefore, the unsuccessful datasets () were predicted by two models from successful datasets (Movies_and_TV and Cds_and_Vinyl, respectively) using both the models calibration set but also using the calibration set of the investigated (unsuccessful) dataset in order to derive the conformal prediction p-values and, in turn, the outcome (classification) from the prediction. and depict how the calibration set is generated and used for model building and prediction. The average results of these predictions are shown in .
Table 3. Mean values for validity and efficiency across unsuccessful datasets using cross-category models.
The cross-category predictions for all of the previously unsuccessful datasets now result in highly predictive estimates both with respect to validity as well as efficiency at various significance levels. Not surprisingly, using the calibration set from the same review category as the predicted test dataset for predicting the outcome (class) is better than using the original model’s calibration set that is related to a different review category. This is especially noticeable for the more sensitive negative minority class where using the original model’s calibration set does not result in valid models, i.e. the observed error rate is larger than the error rate (significance level) set by the user (). The average efficiency is slightly lower, but still at a very high level, using cross-category predictions when compared to the reported “successful” in-category predictions (), in which the derived model and the predicted dataset belong to the same category. Also, sensitivity and specificity for cross-category predictions are high with values of 0.89 and 0.86, respectively. The significance level for maximum efficiency is shifted from around 0.125 for the previously reported in-category (successful) predictions to 0.15 for the cross-category ones which is not surprising since 100% generalizability from one category to another cannot be expected. However, since the shift is very small, only 0.025 (an increase of the error rate by 2.5%), the cross-category generalizability seems to be rather significant for this type of binary classification indicating only a very small portion of information loss.
How can the outcome from these models be interpreted in terms of important sets of words for neutral-positive and negative reviews, respectively?
Floh et al. (Citation2013) established that online reviews consist of two dimensions, valence which describes the category of review on the positive to negative range and intensity which determines the level between high and moderate valence. This definition of “valence” is similar to the term sentiment, both referring to the consumers’ opinion, and hence the terms “sentiments” and “sentiment intensity” are used in the present study for descriptive purposes. “Sentiment intensity” in online reviews can differ regarding the positive or negative intensity in the words that are used in the review, but may also differ in their overall expression. Reviews in the negative range seem to focus on the perception and feelings connected to the reviewers’ internal disposition, while reviews on the positive range are more related to the product (externally connected) (Kim & Gupta, Citation2012).
The results of the present investigation indicate that the sentiment intensity of the neutral-positive reviews seem more consistent in which words the reviewers use. Words such as “awesome,” “fantastic,” and “superb” place high in terms of importance in the models and are occurring regardless of product category. As the neutral-positive expression seems to focus on the product, it is possible that these types of expressions are more uniform regardless of whether the review concerns the product category of e.g. Books or Electronics. Words in the negative reviews seem to spread over a larger set of words, where the “sentiment intensity” in such words is difficult to identify as negative reviews are more diverse in their expressions in comparison to the positive reviews. One of the major motivations for leaving an online review is the expression of emotions (Ismagilova et al., Citation2020). However, eWOM, as opposed to traditional word-of-mouth, lacks the ability to communicate non-verbally with cues such as gestures and facial expressions (Kim & Gupta, Citation2012). Since eWOM lacks these cues, reviewers therefore become more reliant on using more explanatory expressions. Negative reviews focusing on the internal disposition of the reviewer, where a larger set of words formed together in a longer expression is needed in order to express a negative sentiment, could explain why a consistency in a set of more specific words, like the frequently occurring terms in neutral-positive reviews, are more difficult to identify using the currently employed deep learning LSTM architecture.
The results presented in and show that the present approach using deep learning in combination with conformal prediction is capable of handling the existing class imbalances in the investigated datasets.
From a methodological point of view, there are several new contributions in this work. The conformal prediction framework presented in this investigation is based on a mathematical proof (Vovk et al., Citation2005). This means that the acceptable error rate (percentage errors) from model predictions can be set by the user in relation to what is needed for the decision to be taken from the outcome of these predictions. The requirement is that the investigated data are exchangeable. This requirement does not, however, constitute an additional criterion for conformal prediction but is needed for all empirical modelling namely that the new data to be predicted behave like the old data on which the model was created, i.e. both new and old data have the same underlying relationship. The Mondrian version of conformal prediction used in this investigation has the important advantage in that the error rate can be set (controlled) for both classes individually. This is especially important in order to ensure adequate handling and predictive performance for the minority class in highly imbalanced datasets. Furthermore, the graceful handling of the minority class is performed without any class balancing, e.g. under- and/or over-sampling or weighing, schemes since such measures may create issues when modelling imbalanced datasets. Also, the outcomes of the predictions provide additional information to the user as well as of the limitations of the current model. If for instance, at a certain significance level (error rate), the model returns a large percentage of both predictions, i.e. the efficiency is low, this indicates that the model, at present, lacks sufficient information. This, in turn, may then result in an upgrade of the model where additional, new, information has been added. If the model instead returns a large percentage of empty predictions, i.e. that no class could be assigned, this indicates that many of the new predictions (reviews) are very different from the reviews on which the present model was built and outside the applicability domain of the model. In this case, the model should be upgraded, once the outcome (class) has been obtained for some of these empty predictions, in order to enlarge the applicability domain of the model for future predictions. Furthermore, the determination of the applicability domain of the model is an intrinsic part of conformal prediction and handled within the framework without any additional measures.
4. Conclusions
In this investigation, we have shown that the combination of deep learning and conformal prediction results in highly predictive and efficient temporal test set sentiment estimates for categories of product reviews with sufficient average word count (∼100 words or more) where the error rate from the derived models can be controlled. For categories of product reviews with insufficient average word count, the present work indicates that cross-category predictions, i.e. using a model of another category for predictions in combination with the calibration set from the investigated review category, also seem to be highly predictive and efficient with only minor loss in terms of efficiency indicating generalizability across product categories. The investigation also shows that the combination of deep learning and conformal prediction gracefully handles class imbalances without explicit class balancing measures. Thus, the mathematical rigor and performance of Mondrian conformal prediction shown in this work makes the framework, agnostic to the machine learning technique employed, an attractive alternative to more traditional approaches for sentiment analysis and other similar tasks.
Supplemental Material
Download MS Word (11.5 KB)Disclosure statement
No potential conflict of interest was reported by the author(s).
References
- Ain, Q. T., Ali, M., Riaz, A., Noureen, A., Kamran, M., Hayat, B., & Rehman, A. (2017). Sentiment analysis using deep learning techniques: A review. International Journal of Advanced Computer Science and Applications, 8(6), 424–433. https://doi.org/https://doi.org/10.14569/IJACSA.2017.080657
- Araque, O., Corcuera-Platas, I., Sánchez-Rada, J. F., & Iglesias, C. A. (2017). Enhancing deep learning sentiment analysis with ensemble techniques in social applications. Expert Systems with Applications, 77, 236–246. https://doi.org/https://doi.org/10.1016/j.eswa.2017.02.002
- Bhattacharyya, S. (2013). Confidence in predictions from random tree ensembles. Knowledge and Information Systems, 35(2), 391–410. https://doi.org/https://doi.org/10.1007/s10115-012-0600-z
- Ding, R.-X., Palomares, I., Wang, X., Yang, G.-R., Liu, B., Dong, Y., Herrera-Viedma, E., & Herrera, F. (2020). Large-scale decision-making: Characterization, taxonomy, challenges and future directions from an artificial intelligence and applications perspective. Information Fusion, 59, 84–102. https://doi.org/https://doi.org/10.1016/j.inffus.2020.01.006
- Dinga, R., Penninx, B. W. J. H., Veltman, D. J., Schmaal, L., & Marquand, A. F. (2019). Beyond accuracy: Measures for assessing machine learning models, pitfalls and guidelines. BioRxiv, https://doi.org/https://doi.org/10.1101/743138
- Floh, A., Koller, M., & Zauner, A. (2013). Taking a deeper look at online reviews: The asymmetric effect of valence intensity on shopping behaviour. Journal of Marketing Management, 29(5–6), 646–670. https://doi.org/https://doi.org/10.1080/0267257X.2013.776620
- Goodfellow, I., Bengio, Y., & Courville, A. (2016). Deep learning. The MIT Press.
- Haenlein, M., & Kaplan, A. M. (2010). An empirical analysis of attitudinal and behavioral reactions toward the abandonment of unprofitable customer relationships. Journal of Relationship Marketing, 9(4), 200–228. https://doi.org/https://doi.org/10.1080/15332667.2010.522474
- Hossain, R., Ahamed, F., Zannat, R., & Rabbani, M. G. (2013). Comparative sentiment analysis using difference types of machine learning algorithm. 8th International Conference System Modeling and Advancement in Research Trends (SMART). (pp. 329–333).
- Ismagilova, E., Dwivedi, Y. K., Slade, E., & Williams, M. D. (2017). Electronic Word of Mouth (eWOM) in the marketing context. A state of the Art analysis and future directions. Springer.
- Kim, J., & Gupta, P. (2012). Emotional expressions in online user reviews: How they influence consumers’ product evaluations. Journal of Business Research, 65(7), 985–992. https://doi.org/https://doi.org/10.1016/j.jbusres.2011.04.013
- Liu, B. (2010). Sentiment analysis and subjectivity. In: Handbook of natural language processing. (2nd ed). Taylor and Francis Group.
- Luo, F., Li, C., & Cao, Z. (2016). Affective-feature-based sentiment analysis using SVM classifier. IEEE 20th International Conference on Computer Supported Cooperative Work in Design (pp. 276–281.
- Maas, A. L., Daly, R. E., Pham, P. T., Huang, D., Ng, A. Y., & Potts, C. (2011). Learning word vectors for sentiment analysis. In Proceedings of the 49th annual meeting of the association for computational (pp. 142–150).
- Mäntylä, M. V., Graziotin, D., & Kuutila, M. (2018). The evolution of sentiment analysis – a review of research topics, venues, and top cited papers. Computer Science Review, 27, 16–32. https://doi.org/https://doi.org/10.1016/j.cosrev.2017.10.002
- Messoudi, S., Rousseau, S., & Destercke, S. (2020). Deep conformal prediction for robust models. In M. J. Lesot (Ed.), Information processing and Management of uncertainty in knowledge-based systems. IPMU 2020. Communications in Computer and information science (pp. 528–540). Springer.
- Norinder, U., Myatt, G., & Ahlberg, E. (2018). Predicting aromatic amine mutagenicity with confidence: A case study using conformal prediction. Biomolecules, 8(3), 85. https://doi.org/https://doi.org/10.3390/biom8030085
- Pang, B., & Lee, L. (2008). Opinion mining and sentiment analysis. Foundations and Trends in Information Retrieval, 2(1–2), 1–135. https://doi.org/https://doi.org/10.1561/1500000011
- Redhu, S., Srivastava, S., Bansal, B., & Gupta, G. (2018). Sentiment analysis using text mining: A review. International Journal on Data Science and Technology, 4(2), 49–53. https://doi.org/https://doi.org/10.11648/j.ijdst.20180402.12
- Shrestha, N., & Nasoz, F. (2019). Deep learning sentiment analysis of Amazon.com reviews and ratings. International Journal on Soft Computing, Artificial Intelligence and Applications (IJSCAI), 8(1), 1–15. https://doi.org/https://doi.org/10.5121/ijscai.2019.8101
- Vovk, V., Gammerman, A., & Shafer, G. (2005). Algorithmic learning in a random world. Springer. pp. 1–324.
- Wang, X., Zhao, Y., & Pourpanah, F. (2020). Recent advances in deep learning. International Journal of Machine Learning and Cybernetics, 11(4), 747–750. https://doi.org/https://doi.org/10.1007/s13042-020-01096-5
- Yaakub, M. R., Latiffi, M. I. A., & Zaabar, L. S. (2019). A review on sentiment analysis techniques and applications, 4–5 February 2019 IOP Conference Series: Materials Science and Engineering 551 012070.
- Zhang, L., Wang, S., & Liu, B. (2018). Deep learning for sentiment analysis: A survey. WIRES Data Mining and Knowledge Discovery, 8(4), e1253. https://doi.org/https://doi.org/10.1002/widm.1253