
Abstract
Using regression and classification machine learning algorithms, this study explores audio features on Spotify that contribute to the popularity of songs streamed in Indonesia, and then evaluates the feature importance for prediction. The publicly accessible Kaggle data consists of 92,755 rows and 20 columns. Using multiple model comparisons for regression and classification, this study identifies Extra Trees Regressor and Random Forest Classifier as the two predictive approaches with the highest accuracy. This study contributes to the scientific literature on hit songs by examining the influence of audio features on a song's popularity using both classification and regression machine learning methods, with an emphasis on Indonesia based on consumer culture theory.
Introduction
“Hit song science,” according to some researchers, is the study of how a song's audio features contribute to its popularity (Middlebrook & Sheik, Citation2019; Pachet & Roy, Citation2008; Raza & Nanath, Citation2020). Askin and Mauskapf (Citation2017) are among the earliest scholars that thoroughly discussed how audio features in an audio track could predict its popularity in the market. Some scholars have emphasized that further investigation is needed in this relatively new body of knowledge (Araujo et al., Citation2020; Kamal et al., Citation2021; Nijkamp, Citation2018; Sandag & Manueke, Citation2020; Sciandra & Spera, Citation2022). Other researchers have continued to investigate song popularity based on audio features, most notably by utilizing the Spotify Web Application Programming Interface. Previous research has indicated that different countries may have varying musical features that contribute to the popularity of a song (Pinarbaşi, Citation2019; Suh, Citation2019).
The Indonesian market, being one of the Southeast Asian countries, is of particular importance to this study. According to Statista,Footnote1 Indonesia's music industry's revenue is expected to show an annual growth rate of 10.03%, resulting in a projected market volume of US$ 343 million by 2025. This project will analyze audio features on the Spotify API that contribute to the popularity of songs played in Indonesia using regression and classification machine learning algorithms, as well as identify the feature importance. The main research questions of this study are as follows:
RQ1. To what extent can a song audio feature predict a song's popularity by using (a) classification and (b) regression algorithms?
RQ2. According to the classification algorithm, what are the distinctive audio characteristics of prevalent songs compared to less popular ones?
RQ3. Based on the classification algorithm with the highest accuracy, what are the top ten important features that could predict a song's popularity?
This study will continue with a (1) literature review that gives some theoretical context by discussing consumer culture theory, and (2) a look at some prior work that is pertinent to the topic of predicting a song's popularity using audio features. (3) methods, which describe how the study was conducted; (4) findings, which provide a more in-depth explanation of the study's findings and analysis; (5) discussion of the study's theoretical and practical implications; and (6) limitations and suggestions for future study.
Literature review
Consumer culture theory
This study uses consumer culture theory (CCT) (Arnould & Thompson, Citation2005) as the fundamental theoretical framework to conceptualize how music features can lead to a song’s popularity. Several studies have incorporated CCT in music consumption (Collin-Lachaud & Kjeldgaard, Citation2013; Sinclair & Dolan, Citation2015; Skandalis et al., Citation2018). Consequently, this study argues that CCT can serve as the principal theoretical lens in this paper. CCT encompasses four key fields: consumer identity, marketplace cultures, consumption patterns, and mass-mediated marketplace ideology. This study argues that evaluating a song's audio features to forecast its popularity reflects consumption patterns paired with marketplace cultures and consumer identities.
It is safe to assume that music is part of the culture (Bennett, Citation2017; Rojek, Citation2011), representing an arguably dynamic consumption pattern amongst music consumers. As a product, music offers several genres targeted towards different consumer segments (Pérez-Gálvez et al., Citation2017). Due to the different social and demographic characteristics, some music genres in a particular region might not be as popular in demand as the others (Kotarba, Citation2013). This concept explains why jazz is fragmented and displays exclusivity, but pop and easy-listening are more acceptable to music consumers. This cultural notion of consumption pattern explains why popular songs may be regarded differently by various consumer categories (Pietilä, Citation2015).
With the advancement of technology, the way the market consumes recorded music amongst different demographic profiles is reasonably different (Nowak & Bennett, Citation2020). People who listen to music recorded in the 1970s, 1990s, and those in the 2010s possibly have different ways of listening to music. The ways music labels reach the potential segment listeners of their musical talents and products are also different in these eras (Ogden et al., Citation2011; Salo et al., Citation2013). The internet has dramatically changed the music promotion landscape and consumption pattern in the industry, both for professional labels and independent music (Choi & Burnes, Citation2013). The technology has enabled musicians to produce music with more ease than it used to be, providing consumers with more genre and sound selection choices.
We define popular music as a recorded musical composition that is loved, well-known, admired, and enjoyed by the general public, as opposed to specific groups. This definition fits well with the genre of pop music. Taking into account the technological advancements that have significantly altered the landscape of music consumption, we argue that the pattern by which society responds to music as a cultural product on the market has, to a certain extent, converged on a particular pattern – specifically for pop music. Based on its audio features as a cultural commodity, we propose that popular music on the market likely shares common traits. The audio features of the song help researchers better comprehend the properties that these hit songs share, which is the focus of this study.
Popularity prediction and audio features
To the best of our knowledge, it is the work from Askin and Mauskapf (Citation2017) that exhaustively analyzed song hits based on audio features in American Sociological Review. Nearly 27,000 songs were examined based on Billboard's Hot 100 lists, and their audio features, genre, and publication date were all determined. Energy, speechiness, acousticness, danceability, liveness, and time signature have a substantial impact on the success of a song. Nijkamp (Citation2018) carried out a separate study that included 1000 songs using Spotify data. His findings implied relatively weak explanatory power (R2 = 20.2%) regarding the relationship of audio features to popularity. From the regression analysis, his study indicated that some genre and audio features contributed to the song's popularity, i.e. pop, rock, rap, dance-pop, acousticness, liveness, danceability, instrumentalness, and key (specifically key of “B”) (p < 0.05). However, some audio features are not significant at the 95% level, i.e. key (other than “B”), tempo, valence, and genre (other than pop, rock, rap, and dance-pop). Danceability and instrumentalness are also essential predictors by previous works (Al-Beitawi et al., Citation2020a, Citation2020b).
Febirautami et al. (Citation2018) are the first to examine the relation between audio features and popularity in the Indonesian music market. Their work utilized 200 Spotify data, primarily from local artists, and a Decision Tree categorization method. The target variable is comprised of the terms “popular” and “unpopular.” The overall accuracy resulted in a rather high score of 72.8%, with five significant features for the classification, namely acousticness, liveness, energy, valence, and key (they did not specify a specific key, but indicated that it is “high base keys”).
Pinarbaşi (Citation2019) studied the context of music in Turkey using a relatively smaller sample of 676 unique songs using the clustering and classification method, which suggests that loudness and energy are two significant classifiers for a song's popularity using a Decision Tree. The top 200 music on Spotify Turkey were examined for their audio features, including tempo, energy, and valence measurements. According to the findings, positive valance and fast-paced music is preferred by Turkish listeners. The authors also go over the ramifications of their research for musicians and marketers, emphasizing how crucial it is to comprehend the audio features that Turkish listeners find appealing. Overall, the essay clarifies the elements influencing musical tastes in the Turkish music business and offers guidance to professionals in the field on how to produce music that appeals to the local audience. Thus, in the Turkish market, it can be concluded that it relates directly only with the level of energy and loudness for a song to be popular. This finding differs from the Indonesian market and the work of Suh (Citation2019), which explored five countries and regions, i.e. Costa Rica, the US, Norway, Taiwan, China, and Ecuador.
Using regression analysis, he discovered that valence (energy and volume) positively increased a song's popularity (negatively). In his study, the measure of popularity is the number of days a song remains on the chart. Additionally, he suggested that a guest artist in a song contributed positively to the variable of interest. A crucial result is that different countries have distinct traits, which have a substantial impact on their popularity. His research revealed, for instance, that songs with ‘happier’ vibes are more popular in Norway, whilst songs that sound less loud and less aggressive have a longer shelf life in two of the five nations and regions analyzed. This finding is in line with the results from Indonesia and Turkey – which again highlight that different countries and regions have different audio characteristics that lead to popularity – even if the sample is relatively small (Febirautami et al., Citation2018; Pinarbaşi, Citation2019).
Middlebrook and Sheik (Citation2019) obtained data from approximately 16,000 songs globally from 1985 to 2018. Using several machine learning algorithms, random forest method yielded the highest accuracy. Their results indicated that based on hit and non-hit songs, audio features predict 88% of popularity; however, their results did not report feature importance. Of all the studies that suggested Spotify's audio features to popularity, several authors also suggested no significant relationship between the two (Amsterdam, Citation2019; Raza & Nanath, Citation2020).
Methodology
This study uses high-level programming Python through Jupyter Notebook for the integrated development environment (Kluyver et al., Citation2016; VanderPlas, Citation2016) within which several Python open-source libraries are used, i.e. Numpy (Harris et al., Citation2020), Pandas (McKinney, Citation2010; The pandas development team, Citation2020), Matplotlib (Hunter, Citation2007), Seaborn (Waskom, Citation2021), and Scikit Learn (SKLearn) (Pedregosa et al., Citation2011).
This study will use a combination of machine learning algorithms e.g. linear regression, neural network, support vector regression, and random forest (see for examples Akman et al., Citation2020; Onan, Citation2021, Citation2022; Onan & Toçoğlu, Citation2021; Uysal, Citation2022). The Spotify data was obtained from Kaggle public datasets, scraped by Yamac Eren Ay using Spotify Web API.Footnote2 The original data contains 20 columns with different data types, e.g. object, float, and integer. lists the detail of independent and dependent variables for further analysis. Variable ‘Popularity’ is used for regression while ‘Popularity Class’ is for classification.
Table 1. List of variables for analysis.Footnote3
The data analysis is divided into three parts, i.e. preprocessing, training-testing, and evaluation. Data preprocessing ensures no outliers, and no missing data, non-numeric variables are removed from the analysis, and n-categorical data are transformed to n-1 dummy variables. In this study, two variables are transformed into dummy variables, i.e. ‘Key’ and ‘Time Signature’ (see ). Also, in the preprocessing phase, a new variable, ‘Popularity Class,’ is created – which bases its value on the ‘Popularity’ variable (see for the classification rule). Then, data are randomly split for training (70%) and testing (30%). This study performs rescaling to all the independent variables using SKLearn's Standard Scaler.
After rescaling independent variables, the analysis continues to fit the training data and predict the testing data to obtain the model evaluation between actual and predicted values. For classification, this study uses the following evaluation metrics, i.e. confusion matrix and classification report, which comprises the overall accuracy, precision, recall, support, and overall F1-score. This study uses two values for regression, i.e. R-squared score and Root Mean Squared Error (RMSE).
Twenty-fold cross-validation using the Cross Val Score is employed to ensure that the computation is not under- or overfitting. Lastly, hyperparameter testing using Grid Search CV is performed to identify the best number of the estimator and maximum depth. Having determined the best classification model, the study then calculates the permutation performance importance to see the top ten features considered important in the classification prediction. Assuming that the predictive power of the classification model is generally accurate, the analysis continues to perform Tukey's test as part of ANOVA Post Hoc calculation to determine the unique characteristics of songs with high popularity compared to those that are less popular.
To avoid bias in interpreting the results from this study, it is worth noting the Indonesian music market and how people generally consume music. In Indonesia, music streaming users generally show positive trends, reaching 158 million users in early 2021 (Databoks, Citation2021; Moneycontrol, Citation2022). In 2021, approximately 54% of Spotify users were from the high-income group, with more users expected to hit 8.8% by 2026 (Statista, Citation2021). Thus, the term ‘popular’ in this study might be skewed towards music that is streamed on the Spotify platform, with the understanding that the users tend to be from the high-income group. Musical genres socially affiliated with the low-income group, such as dangdut (Daniels, Citation2013; Hollander et al., Citation2009), might not be fully captured using Spotify audio features.
Findings and discussion
Findings
To answer RQ 1, and show the results of classification and regression models, respectively. Random Forest Classifier produces the highest overall accuracy and F1-score (Accuracy = 0.6974, F1-Score = .6944), whereas Extra Trees Regressor produces the highest R-squared score and smallest RMSE (R2 = 0.6857, RMSE = 12.33). Using classification and regression, we can conclude that the audio features influence around 69% of popularity. The optimal machine learning model for classifying and predicting popularity differs, which is an intriguing conclusion. Cross-validation is performed on both Random Forest Classifier and Extra Trees Classifier to determine the best number of estimators and maximum depth.
Table 2. Classification algorithm comparison.
Table 3. Regression algorithm comparison.
As this study is interested in understanding the class characteristics (RQ 2) and the feature importance (RQ 3) based on the classification algorithm, the findings and discussion will continue by focusing only on the results from Random Forest Classifier. and exhibit the confusion matrix and the classification report, including precision, recall, overall accuracy, support, and F1-score. The confusion matrix and classification report illustrate that Random Forest performs generally well on unpopular songs (precision = ± 81%, recall = ± 89%) and moderately well on highly popular songs (precision = ± 65%, recall = ± 69%).
Figure 1. Confusion matrix for random forest classifier.
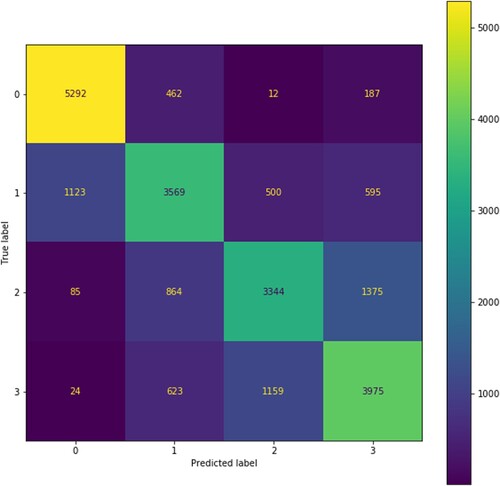
Table 4. Random forest classification report.
These results show that Random Forest Classifiers have a better prediction to determine the likelihood of a song being unpopular. Using Cross-Validation Score – with 20-fold cross-validation parameter –, it can also be inferred that the model performs consistently on the training data. It returns 68.87% accuracy with 0.79% standard deviation (). The Grid Search CV also suggests the best parameter for the Random Forest Classifier (Number of estimators = 250, Maximum depth = None).
Based on Post Hoc Test (), all audio features have significant differences in terms of the four classes (p < 0.05). This study will not examine all audio features, but just the ten most essential ones. Consequently, given the preceding most important parameter, the study continues by calculating feature importance (RQ 3). illustrates the top ten most important features for the classification results. These ten features are similar to the feature importance from Extra Trees Regressor. Nevertheless, they are slightly different in terms of order. The ten most important features based on the Random Forest Classifier are release date, loudness, instrumentalness, acousticness, duration, speechiness, energy, valence, danceability, and liveness.
Figure 2. Feature importance based on random forest classifier.
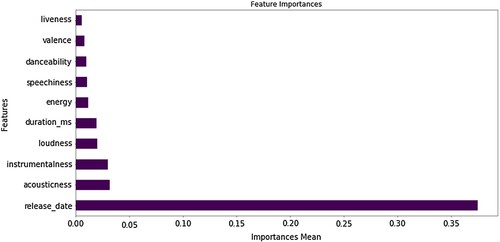
Table 5. Tukey's test from ANOVA Post Hoc.
According to , it can be inferred that a song's popularity depends on the release date (µ = 1993 ± 17.63, p < 0.00). This study argues two rationales behind this. First, it is because Spotify helps promote an artist's work through its algorithm; second, older generations stream ‘older’ music through different platforms other than Spotify – thus, resulting in a small number of streams in older songs. However, we can also infer that artists can be benefited by ‘recycling’ older songs and publishing them through Spotify to generate popularity in the market.
As for duration, highly popular songs have a significantly longer duration but a narrower standard deviation compared to the other classes, as shown in (µ = 3.97 ± 1.75 (in minutes), p < 0.000). Highly popular songs tend to be non-acoustic music (µ = 0.36 ± 0.3, p < 0.00), a mix of vocal and instruments (µ = 0.05 ± 0.18, p < 0.00), generally high level of loudness (µ = −8.90 ± 4.39, p < 0.00), and moderate energy level (µ = 0.57 ± 0.23, p < 0.000). These songs are also generally having positive vibe – as indicated by its valence feature (µ = 0.53 ± 0.25, p < 0.000), less speechy (µ = 0.05 ± 0.06, p < 0.000), normally danceable (µ = 0.55 ± 0.15, p < 0.000), and mostly recorded in studio (µ = 0.18 ± 0.16, p < 0.000). See for visualization amongst the top ten important features based on their popularity class. The study indicates that both machine learning models yield a predictive power of nearly 69% by using classification and regression algorithms. Thus, it can be inferred that audio features can predict a song's popularity in the Indonesian market. The best algorithm strategy for classification is Random Forest Classifier, whereas for regression is Extra Trees Regressor.
Figure 3. Histogram plot of the audio features on the four popularity classes.
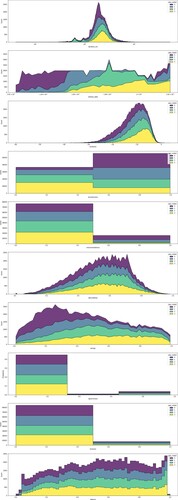
Table 6. Descriptive statistics for each class.
Discussion
Theoretical implications
Hit song science is a nascent topic that scholars continue to overlook. To generate a hit song in the music industry, this study contends that this sector need scholars from a variety of disciplines with a deeper understanding of audio characteristics. This study contributes to the body of knowledge on hit song science by offering empirical machine learning models addressing how similar audio features can predict popularity among Indonesian Spotify users. This research supports the key concepts of consumer culture theory, focusing on consumption patterns among consumer identities in the cultural marketplace in the context of music streaming, as indicated by audio features that can indicate a song's market popularity.
Grounded by the data and the machine learning model results, we theorize that highly popular songs in Indonesia streamed through Spotify tend to (1) be newly released – which can plausibly include old recycled songs, (2) have higher loudness level (dB), (3) are non-instrumental, (4) include mostly digital or electronic musical nuances, (5) are lengthier in duration, (6) less speechy, (7) have higher energy, (8) have a positive mood, (9) be highly danceable, and (10) recorded in-studio (not a live recording).
Our study results align with the previous works that discovered that features such as energy, valence, and instrumentalness are important predictors for popularity (Al-Beitawi et al., Citation2020b; Pinarbaşi, Citation2019; Suh, Citation2019). Middlebrook and Sheik (Citation2019) also denoted that the Random Forest Classifier results in the highest accuracy of the other classification algorithms. It can also be inferred to predict a song's popularity in Indonesia. Some other factors may contribute, e.g. gender, guest artist, institutional support, and artists' familiarity (Askin & Mauskapf, Citation2017). However, these variables were not considered due to lack of data.
The top ten items to predict a song's popularity in Indonesia based on Random Forest Classifier with a maximum depth of 32 and 250 number of estimators are, in order of importance: release date, loudness, instrumentalness, acousticness, duration, speechiness, energy, valence, danceability, and liveness, which is partially in line with the findings from previous studies (Askin & Mauskapf, Citation2017; Febirautami et al., Citation2018; Suh, Citation2019). Previous studies have noted loudness, mode, energy, valence, danceability, instrumentalness, acousticness, liveness, and key (Al-Beitawi et al., Citation2020a, Citation2020b; Nijkamp, Citation2018; Pinarbaşi, Citation2019; Suh, Citation2019). According to the results of feature importance, this study suggests that highly popular songs have shared and distinct audio features compared to others.
Practical implications
This study presents various practical implications based on its findings. It is essential to emphasize that the focus of this study is limited to the audio features derived from the Spotify API. The popularity of a song may be affected by other variables. However, based on the theoretical context and model results, the following practical consequences can be used as a reference. New or existing music artists, producers, or labels can rethink their priorities in terms of music composition to increase the likelihood of producing a piece of popular music in Indonesia.
As release date is an essential feature, music producers and artists may consider (1) recycling old songs by taking into account some audio feature composition that makes music highly popular, e.g. danceable, positive, and loud; (2) focus on creating digital music that combines music and vocal elements on the audio; (3) avoid rap and full instrumental music, e.g. instrumental jazz or fusion; (4) stick to positive/happy mood on song production; (5) live recording is not a priority; (6) keep the song duration on average about three to a maximum of four minutes; (7) artists who are mainly instrumentalists can collaborate with vocalists for building greater exposure in the market.
Another important implication for musicians in response to this study is that a popular song defined in this study is particular in terms of audio features. From a marketing perspective, if every musician follows this path, it will not be easy to seek differentiation points from the market’s perspectives – as local musicians have similar forms of music. The market will then assume that such a musical form is considered ‘mainstream’ (Kowald et al., Citation2021). Musicians and labels shall look for differentiation points in their musical form to make them unique and attain a unique positioning that can lead to competitive advantage if formulated and appropriately executed.
Limitations and future research
Despite its strengths, this study is not without limitations. First, this study limits its scope mainly to the Indonesian music streaming market. Future studies may want to expand the scope to conduct a comparative analysis with western countries or in the larger Asia Pacific region. Second, the artists analyzed in this study are not exclusively local musicians. Future works may also consider focusing the analysis specifically on local artists. Third, this study does not consider several essential items, e.g. institutional support, genre, artists’ familiarity, or lyrics. Future research is encouraged to incorporate these predictors to accompany audio features that enhance the model's interpretability and accuracy.
Disclosure statement
No potential conflict of interest was reported by the author(s).
Correction Statement
This article has been corrected with minor changes. These changes do not impact the academic content of the article.
Notes
1 https://www.statista.com/outlook/dmo/digital-media/digital-music/indonesia accessed at 4/21/2021 3:39 PM.
2 https://www.kaggle.com/yamaerenay/spotify-tracks-dataset-19222021 accessed 4/21/2021 12:58 PM.
3 https://developer.spotify.com/documentation/web-api/reference/#category-tracks accessed 4/21/2021 1:17 PM.
References
- Akman, E., Karaman, A. S., & Kuzey, C. (2020). Visa trial of international trade: Evidence from support vector machines and neural networks. Journal of Management Analytics, 7(2), 231–252. https://doi.org/10.1080/23270012.2020.1731719
- Al-Beitawi, Z., Salehan, M., & Zhang, S. (2020a). Cluster analysis of musical attributes for top trending songs. Proceedings of the 53rd Hawaii International Conference on System Sciences.
- Al-Beitawi, Z., Salehan, M., & Zhang, S. (2020b). What makes a song trend? Cluster analysis of musical attributes for Spotify Top trending songs. Journal of Marketing Development and Competitiveness, 14(3), 79–91.
- Amsterdam, N. (2019). Analyzing popular music using Spotify’s machine learning audio features.
- Araujo, C. V. S., Cristo, M. A. P., & Giusti, R. (2020). A model for predicting music popularity on streaming platforms. Revista de Informática Teórica e Aplicada, 27(4), 108–117. https://doi.org/10.22456/2175-2745.107021
- Arnould, E. J., & Thompson, C. J. (2005). Consumer culture theory (CCT): Twenty years of research. Journal of Consumer Research, 31(4), 868–882. https://doi.org/10.1086/426626
- Askin, N., & Mauskapf, M. (2017). What makes popular culture popular? Product features and optimal differentiation in music. American Sociological Review, 82(5), 910–944. https://doi.org/10.1177/0003122417728662
- Bennett, A. (2017). Music, space and place: Popular music and cultural identity. Routledge.
- Choi, H., & Burnes, B. (2013). The internet and value co-creation: The case of the popular music industry. Prometheus, 31(1), 35–53. https://doi.org/10.1080/08109028.2013.774595
- Collin-Lachaud, I., & Kjeldgaard, D. (2013). Loyalty in a cultural perspective: Insights from french music festivals. In Consumer Culture Theory, Research in Consumer Behavior (Vol. 15, pp. 285–295). Emerald Group Publishing Limited. https://doi.org/10.1108/S0885-2111(2013)0000015019
- Daniels, T. P. (2013). Social drama, dangdut, and popular culture. In T. P. Daniels (Ed.), Performance, Popular Culture, and Piety in Muslim Southeast Asia (pp. 161–177). Palgrave Macmillan. https://doi.org/10.1057/9781137318398_7
- Databoks. (2021). Mengesankan! Spotify Tembus 158 juta Pelanggan Berbayar di Kuartal I-2021 | Databoks. https://databoks.katadata.co.id/datapublish/2021/06/22/jumlah-pelanggan-premium-spotify-naik-21-di-kuartal-i-2021
- Febirautami, L. R., Surjandari, I., & Laoh, E. (2018). Determining characteristics of popular local songs in Indonesia’s music market, 197–201.
- Harris, C. R., Millman, K. J., van der Walt, S. J., Gommers, R., Virtanen, P., Cournapeau, D., Wieser, E., Taylor, J., Berg, S., & Smith, N. J. (2020). Array programming with NumPy. Nature, 585(7825), 357–362. https://doi.org/10.1038/s41586-020-2649-2
- Hollander, E., d’Haenens, L., & Bardoel, J. (2009). Television performance in Indonesia: Steering between civil society, state and market. Asian Journal of Communication, 19(1), 39–58. https://doi.org/10.1080/01292980802618098
- Hunter, J. D. (2007). Matplotlib: A 2D graphics environment. Computing in Science & Engineering, 9(03), 90–95. https://doi.org/10.1109/MCSE.2007.55
- Kamal, J., Priya, P., Anala, M. R., & Smitha, G. R. (2021). A classification based approach to the prediction of song popularity. Proceedings of the 2021 IEEE International Conference on Innovative Computing, Intelligent Communication and Smart Electrical Systems, ICSES 2021. Scopus, https://doi.org/10.1109/ICSES52305.2021.9633884
- Kluyver, T., Ragan-Kelley, B., Pérez, F., Granger, B. E., Bussonnier, M., Frederic, J., Kelley, K., Hamrick, J. B., Grout, J., & Corlay, S. (2016). Jupyter notebooks-a publishing format for reproducible computational workflows.
- Kotarba, J. A. (Ed.). (2013). Understanding society through popular music (2nd ed.). Routledge. https://doi.org/10.4324/9780203076811
- Kowald, D., Muellner, P., Zangerle, E., Bauer, C., Schedl, M., & Lex, E. (2021). Support the underground: Characteristics of beyond-mainstream music listeners. EPJ Data Science, 10(1), 14. https://doi.org/10.1140/epjds/s13688-021-00268-9
- McKinney, W. (2010). Data structures for statistical computing in python. In Proceedings of the 9th Python in Science Conference (Vol. 445, No. 1, pp. 51–56).
- Middlebrook, K., & Sheik, K. (2019). Song hit prediction: Predicting billboard hits using Spotify data. ArXiv:1908.08609 [Cs, Stat]. http://arxiv.org/abs/1908.08609
- Moneycontrol. (2022). India, Indonesia drive Spotify’s user growth in Q4 2021. Moneycontrol. https://www.moneycontrol.com/news/business/india-indonesia-drives-spotifys-user-growth-in-q4-2021-8035231.html
- Nijkamp, R. (2018). Prediction of product success: Explaining song popularity by audio features from Spotify data.
- Nowak, R., & Bennett, A. (2020). Music consumption and technological eclecticism: Investigating generation Y’s adoption and uses of music technologies. YOUNG, 28(4), 347–362. https://doi.org/10.1177/1103308819896173
- Ogden, J. R., Ogden, D. T., & Long, K. (2011). Music marketing: A history and landscape. Journal of Retailing and Consumer Services, 18(2), 120–125. https://doi.org/10.1016/j.jretconser.2010.12.002
- Onan, A. (2021). Sentiment analysis on product reviews based on weighted word embeddings and deep neural networks. Concurrency and Computation: Practice and Experience, 33(23), e5909. https://doi.org/10.1002/cpe.5909
- Onan, A. (2022). Bidirectional convolutional recurrent neural network architecture with group-wise enhancement mechanism for text sentiment classification. Journal of King Saud University - Computer and Information Sciences, 34(5), 2098–2117. https://doi.org/10.1016/j.jksuci.2022.02.025
- Onan, A., & Toçoğlu, M. A. (2021). A term weighted neural language model and stacked bidirectional LSTM based framework for sarcasm identification. IEEE Access, 9, 7701–7722. https://doi.org/10.1109/ACCESS.2021.3049734
- Pachet, F., & Roy, P. (2008). Hit song science is not yet a science, 355–360.
- Pedregosa, F., Varoquaux, G., Gramfort, A., Michel, V., Thirion, B., Grisel, O., Blondel, M., Prettenhofer, P., Weiss, R., & Dubourg, V. (2011). Scikit-learn: Machine learning in Python. The Journal of Machine Learning Research, 12(10), 2825–2830.
- Pérez-Gálvez, J. C., Lopez-Guzman, T., Gomez-Casero, G., & Fruet Cardozo, J. V. (2017). Segmentation of the spectators attending a festival based on musical preferences. International Journal of Event and Festival Management, 8(3), 346–360. https://doi.org/10.1108/IJEFM-03-2017-0021
- Pietilä, T. (2015). A segmented music market and attempts to capture It. In T. Pietilä (Ed.), Contracts, patronage and mediation: The articulation of global and local in the South African recording industry (pp. 71–88). Palgrave Macmillan UK. https://doi.org/10.1007/978-1-137-56232-6_4
- Pinarbaşi, F. (2019). Demystifying musical preferences at Turkish music market through audio features of Spotify charts. Turkish Journal of Marketing, 4(3), 264–279. https://doi.org/10.30685/tujom.v4i3.62
- Raza, A. H., & Nanath, K. (2020). Predicting a hit song with machine learning: Is there an apriori secret formula? 111–116.
- Rojek, C. (2011). Pop music, pop culture. Polity.
- Salo, J., Lankinen, M., & Mäntymäki, M. (2013). The use of social media for artist marketing: Music industry perspectives and consumer motivations. International Journal on Media Management, 15(1), 23–41. https://doi.org/10.1080/14241277.2012.755682
- Sandag, G. A., & Manueke, A. M. (2020). Predictive models for popularity of solo and group singers in Spotify using decision tree. 2020 2nd International Conference on Cybernetics and Intelligent System, ICORIS 2020. Scopus. https://doi.org/10.1109/ICORIS50180.2020.9320838
- Sciandra, M., & Spera, I. C. (2022). A model-based approach to Spotify data analysis: A beta GLMM. Journal of Applied Statistics, 49(1), 214–229. https://doi.org/10.1080/02664763.2020.1803810
- Sinclair, G., & Dolan, P. (2015). Heavy metal figurations. Marketing Theory, 15(3), 423–441. https://doi.org/10.1177/1470593115569015
- Skandalis, A., Banister, E., & Byrom, J. (2018). The spatial aspects of musical taste. Marketing Theory, 18(2), 249–265. https://doi.org/10.1177/1470593117732464
- Statista. (2021). Music streaming—Indonesia | Statista Market Forecast. Statista. https://www.statista.com/outlook/dmo/digital-media/digital-music/music-streaming/indonesia
- Suh, B. J. (2019). International music preferences: An analysis of the determinants of song popularity on Spotify for the US, Norway, Taiwan, Ecuador, and Costa Rica.
- The pandas development team. (2020). Pandas-dev/pandas: Pandas. https://doi.org/10.5281/zenodo.3509134
- Uysal, M. P. (2022). Machine learning-enabled healthcare information systems in view of industrial information integration engineering. Journal of Industrial Information Integration, 30, 100382. https://doi.org/10.1016/j.jii.2022.100382
- VanderPlas, J. (2016). Python data science handbook: Essential tools for working with data. O’Reilly Media, Inc.
- Waskom, M. L. (2021). Seaborn: Statistical data visualization. Journal of Open Source Software, 6(60), 3021. https://doi.org/10.21105/joss.03021