
ABSTRACT
This paper investigates neurophysiological correlates of prosodic prominence in German with two EEG experiments. Experiment 1 tested different degrees of prominence (three accent types: L+H*, H*, H+L* and deaccentuation) in the absence of context, making the acoustic signal the only source for attention orienting. Experiment 2 tested L+H* and H+L* accents in relation to contexts such as “Guess what happened today” triggering expectations as to how exciting the following utterance will be. Results reveal that prominence cues that attract attention, such as a signal-driven high level of prosodic prominence or a content-driven expression of excitement, engender positivities of varying latency. Furthermore, contextual expectations trigger prediction errors, e.g. deviations from an appropriate level of prosodic prominence result in a negative ERP deflection. Hence, the data suggest that the two core processes – attentional orientation and predictive processing – reflect discrete stages in the construction of a mental representation during real-time comprehension.
1. Introduction
Prosody is often used to highlight new or surprising information, making it more prominent, while given or predictable information is prosodically attenuated, making it less prominent. For German it has been shown that pitch accent types differ in their degree of perceived prominence (Baumann & Röhr, Citation2015) and that they play an important role in the marking of information structure. Data from event-related brain potentials (ERPs) indicate that different pitch accent types are mapped onto information status (newness/givenness in discourse) in real-time: Mismatches between accent type and information status evoked a more pronounced N400 followed by a Late Positivity (Schumacher & Baumann, Citation2010; see also Hruska & Alter, Citation2004). One way to account for this pattern is that the negativity reflects the contextually driven detection of the mismatch between prosody and information structure, while the positivity reflects repair and updating processes of mental representations. An open question is whether the latter process arises from conflicting information in the input (as suggested by Schumacher & Baumann, Citation2010) or is tied to signal-driven attentional orienting.
The current paper is concerned with neurophysiological correlates of prosodic prominence with the aim of investigating the nature of the interplay between signal-driven attention orienting and expectation-driven processes. Previous ERP research has typically focused on the presence or absence of accent with the exception of Schumacher and Baumann (Citation2010) who differentiated between two accent types and deaccentuationFootnote1 in German. In the current paper we will further investigate German accent types on critical words in controlled discourse-semantic experimental environments in order to arrive at a more detailed characterisation of the cognitive processes and linguistic functions involved. To be able to disentangle potential effects of signal-driven and expectation-driven processes, we conducted two EEG studies: In Experiment 1, three pitch accent types plus deaccentuation were tested in the absence of context which makes the acoustic signal the only source for attention orienting. In Experiment 2, two pitch accent types (rise and fall) were tested in relation to prior contexts generating expectations about appropriate upcoming prosody, i.e. triggering expectation-driven mechanisms. Due to the fact that we compared different prosodic realisations of the target word, the data were analysed using regression-based ERPs (rERPs; e.g. Smith & Kutas, Citation2015a, Citation2015b), which allowed us to take into account acoustic properties like pitch and intensity as continuous covariates.
The paper is structured as follows: The current section provides an introduction to prosodic prominence (1.1) and neurophysiological correlates (1.2). The two EEG experiments are presented separately in Section 2 (Experiment 1) and Section 3 (Experiment 2). The methods of both experiments are very similar, hence the methods part of Experiment 1 elaborates on the methodological details, in particular with regard to a regression-based ERP analysis (Sections 2.1.3 and 2.1.4). Section 4 provides a general discussion of both experiments. Finally, Section 5 summarises the results and explores their implications for real-time language comprehension involving prosodic cues.
1.1. Prosodic prominence
Prosodic prominence at the utterance level involves highlighting an element in order to make it stand out. This highlighting and its converse – prosodic attenuation – can take different forms, i.e. they find expression in phonological choices, such as accentuation and phrasing as well as in phonetic parameters, such as fundamental frequency (f0), intensity, segmental durations and spectral characteristics (Beckman & Venditti, Citation2010a, Citation2010b; Féry, Citation1993; Gussenhoven, Citation2004; Ladd, Citation2008; Uhmann, Citation1991). For instance, pitch accent types are defined by discrete and continuous modulations in the f0 movement on or near a lexically stressed syllable (Grice et al., Citation2017). This implies the direction of f0 movement (rising – falling), the extent of f0 excursion (steep – shallow) and the scaling of the f0 target corresponding to the accentual tone (high – mid/downstepped – low) (e.g. Grice & Baumann, Citation2007). There is evidence for a relation between perceived prominence – measured by behavioural responses – and different accent types in German that can be attributed to these dimensions in the acoustic signal. In a perception experiment, Baumann and Röhr (Citation2015) investigated the perceived degree of prosodic prominence of nuclearFootnote2 accent types that are currently attested for German (see German ToBI model = German Tones and Break Indices: Grice & Baumann, Citation2002; Grice et al., Citation2005), comparing them to deaccentuation. The six tested accent types and their tonal configurations are displayed in . (G)ToBI is an intonation model that is based on principles of autosegmental-metrical phonology in which intonation contours are analysed into sequences of (high (H) and low (L)) tones that are associated with heads and edges in the prosodic structure of utterances (Jun, Citation2005, Citation2014; Ladd, Citation2008; Pierrehumbert, Citation1980). The tonal inventory involves monotonal as well as bitonal accents which primarily account for the pitch movement leading towards an accented syllable (i.e. the tonal onglide; Ritter & Grice, Citation2015). The tonal onglide is the part of the f0 contour that is generally accounted for phonologically in terms of a leading tone in right-headed accent types, such as the L in an L+H* accent, or the first H in an H+!H* or H+L* accent.
Figure 1. Stylised intonation contours of GToBI pitch accents (accented syllables shaded in grey) (from Grice et al., Citation2019). Accent types are ordered according to their perceived prominence (decreasing prominence from left to right) and different tonal dimensions, i.e. the direction of pitch movement, the degree of pitch excursion and the height of the f0 target corresponding to the starred tone.
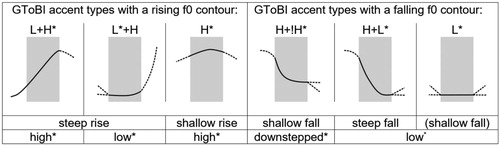
The relation of the different tonal cues to perceived prominence is complex but results reveal that there are gradual differences in perceived prominence between different accent types. These differences can be attributed to three tonal dimensions that differ in their perceptual relevance. Most important for German listeners is the direction of pitch movement in the vicinity of the accented syllable, with rises being more prominent than falls (see also Baumann & Winter, Citation2018). The extent of the pitch excursion and the height of the starred tone are relevant as well, but turned out to be perceptually less relevant: Steep rises are more prominent than shallow rises, while shallow falls (to a mid f0 level) are more prominent than steep falls (to a low f0 level), and high accents are more prominent than downstepped and low accents. In general, the results of Baumann and Röhr (Citation2015) suggest the following (hierarchical) organisation of different German (nuclear) accent types according to perceived prominence, assuming a decrease in prominence from left to right (cf. ): rising accent (L+H* > L*+H) > high accent (H*) > falling accent (H+!H* < H+L*) > low accent (L*) > no accent.
It is commonly known that in West Germanic languages prosodic prominence plays an important role in the linguistic marking of information structure. It has been shown that information status and focus domains of different sizes and types are marked not only by accent placement but also by the level of prominence expressed by different pitch accent types. Several studies on English (e.g. Brazil, Citation1975; Chen et al., Citation2007; Gussenhoven, Citation1984, Citation2002; Pierrehumbert & Hirschberg, Citation1990) and German (e.g. Baumann, Citation2006; Baumann & Grice, Citation2006; Kohler, Citation1991; Röhr & Baumann, Citation2010) have investigated accent type, providing evidence that high and rising accents are preferentially used for less accessible or new information, whereas low and falling accents are preferred for more accessible or given information. Furthermore, across a number of West Germanic languages words in narrow and contrastive focus have been found to involve greater prosodic prominence compared to words in broad and non-contrastive focus, respectively (e.g. Baumann et al., Citation2007; Breen et al., Citation2010; Grice et al., Citation2017; Hanssen et al., Citation2008; Ito et al., Citation2004).
This also means that a listener should be able to interpret an element’s level of prominence as indicative of the information structure that the speaker is intending to convey (e.g. Breen et al., Citation2010; Grice et al., Citation2017; Ito & Speer, Citation2008; Röhr & Baumann, Citation2011; Welby, Citation2003). Accordingly, there is evidence that the perception of prominence is not only determined by the auditory, i.e. signal-driven input, but may also be affected by both intrinsic properties of words and expectations derived from language-specific experience and interpretations of pragmatic and phonological context. For instance, Cole et al. (Citation2010) found that word frequency (based on a corpus of spontaneous speech) and textual givenness measured through a repetition index (i.e. a word’s number of repetitions in the preceding discourse segment) influence a listener’s judgment of prominence as well, i.e. low-frequency and less predictable words are more likely to be perceived as prominent. This effect turned out to be stronger and at least partly independent of acoustic prominence for word frequency. Moreover, Cole et al. (Citation2010) argue that prior experience (with the language or discourse context) facilitates processing which also influences the listener’s judgment of a word’s prominence: New information is typically processed faster when it is accented and given information shows processing advantages when deaccented (for similar effects see Birch & Clifton, Citation1995; Bock & Mazzella, Citation1983; Terken & Nooteboom, Citation1987). However, there is also evidence that expectations evoked by the discourse context may modulate a listener’s speech perception, overwriting the information conveyed by the acoustic signal: Bishop (Citation2012) conducted a prominence rating study in which test sentences did not vary in their prosodic structure but were presented with different context questions that induced varying expectations as to the size of a focus domain. Results revealed that a sentence-final object was judged as more prominent relative to a less prominent verb when it occurred in a context under narrow focus than when it was interpreted to be part of a broader focus constituent (i.e. sentence or verb phrase). Hence, listeners’ expectations about prominence patterns were shown to be systematically different depending on their interpretation of the underlying information structure. In line with the findings reported above, Kakouros et al. (Citation2018) argue that the impression of prominence is a dynamic process. They found that the probability of an f0 contour – which was based on a (brief) preceding prosodic exposure – had an effect on the listeners’ perception of prominence: F0 contours (on sentence-final words) that were less frequent than the baseline f0 pattern were more likely to be perceived as prominent, independently of the direction of f0 change (rising or falling). Accordingly, the results suggest that even recent speech experience can override language-typical cues for signalling prominence.
Previous behavioural research thus indicates that signal-driven processes, derived from the acoustic properties of a stimulus, may differ from expectation-driven processes, derived from contextual and information structural triggers as well as from prior acoustic exposure. In the current research, we seek to disentangle these two mechanisms through online measures of prosodic processing.
1.2. Neurophysiological correlates of prosodic cues
Event-related brain potentials (ERPs) allow for a fine-grained characterisation of the time-course of the neurocognitive mechanisms underlying information processing. Current research is particularly interested in the mechanisms subserving predictive processing and attentional orientation (see Bornkessel-Schlesewsky & Schumacher, Citation2016).
First, the processing system constantly engages in the construction of a mental model from which predictions for upcoming input are derived. Predicted stimuli yield decreased activity in sensory cortices (Blakemore et al., Citation1998). In turn, prediction failures (Friston, Citation2010), i.e. mismatches between context and target items have been widely investigated and have been claimed to yield negative ERP deflections (Bornkessel-Schlesewsky & Schlesewsky, Citation2019). For instance, the N400 is a negative potential peaking around 400 ms after the onset of a critical entity. It represents processes that affect an early discourse linking stage and derive from expectations for an entity raised by the discourse context. The higher the processing costs for an entity or the more difficult its reconciliation with prior discourse, the more enhanced is the N400 amplitude. This has been found for the processing of semantically less expected words (e.g. Kutas & Federmeier, Citation2011; Ventura et al., Citation2020; inter alia) and less accessible discourse entities (e.g. Burkhardt, Citation2006; Schumacher & Hung, Citation2012) among others.
Second, attentional (re)orienting is commonly interpreted as a response to signal-driven processing arising from novel or highlighted incoming cues (or potentially dangerous events) (Corbetta & Shulman, Citation2002). From an electrophysiological perspective, attentional orienting to visual or auditory stimuli can be best associated with the P300 component family, representing a positive ERP deflection with a peak around 300 ms that also displays considerable variability in latency (Polich, Citation2007). A P300 occurs in response to a less probable stimulus but also to a prominent novel stimulus (which attracts attention) (Kok, Citation2001). In fact, P300 effects commonly correspond to task-related attention allocation (e.g. Picton, Citation1993; Polich, Citation2003). For instance, a P300 is easily elicited by a rare stimulus, as in classical oddball paradigms. It has been further suggested that the P300 is generated by the locus coeruleus norepinephrine neurotransmitter system which increases the response to a target stimulus (Nieuwenhuis et al., Citation2005).
Novelty and attention induced by visual or auditory stimuli can also be associated with late positive responses (e.g. Ruchkin et al., Citation1990; Squires et al., Citation1975). These late positivities, which have a peak latency around 600 ms, are also considered to be part of the P300 family. One way to account for them is that they reflect updating mechanisms of the mental model. Listeners are usually required to update their mental model when there is an attention reorienting cue (e.g. when a topic shift is signalled or new information is introduced). This mechanism has been found to engender a positive-going potential with a peak latency around 600 ms after the critical entity (see Brouwer & Hoeks, Citation2013; Burkhardt, Citation2006; Schumacher et al., Citation2015; Wang & Schumacher, Citation2013). (Some authors refer to this as P600, others as Late Positivity. We use the term Late Positivity here.) Updating can also occur when an otherwise unexpected cue is processed that is not associated with attentional signalling – e.g. violations of phrase structure and agreement (see Friederici et al., Citation1996), structural complexity (e.g. Kaan et al., Citation2000) or semantic reversal anomalies (see Kolk et al., Citation2003). We assume that attention allocation results in updating of the mental model in cases in which a reorientation is warranted. It may also coincide with conflict resolution when contradictory information is encountered, for instance when prosodic and contextual cues point to different information status (Schumacher & Baumann, Citation2010).
Several auditory ERP studies revealed that prosodic cues such as pitch are computed as the sensory input unfolds, and expectations are incrementally built up for upcoming entities (including their prosodic realisation). While prosodic cues entail sensory input, i.e. signal-driven attention orienting (known to engender P300 responses) based on the prosodic realisation, and are used by the speaker to (re)orient the listener’s attention, they also interact with expectation-driven prominence, i.e. when expectations are raised by the pragmatic or the prosodic context. Accordingly, mismatching prosodic input, such as missing accents on prominent (e.g. focused/new) information or (superfluous) accents on background or given information have been shown to elicit an N400 (e.g. Baumann & Schumacher, Citation2012; Heim & Alter, Citation2006; Toepel et al., Citation2007). Accentuation and the N400 have also been associated with the depth of semantic processing. Semantic incongruence has been found to yield larger N400 effects when the incongruent word is accented (and focused), indicating that accentuation increases the depth of semantic processing (e.g. Li & Ren, Citation2012; Ventura et al., Citation2020; Wang et al., Citation2011). Moreover, there is evidence that rises in spoken pitch evoke a P300 effect relative to falls, an effect which has been linked to attentional orienting (Hsu et al., Citation2015). Further, attention orienting by prosodic cues has been observed in relation to the occurrence of a Late Positivity in the case of prosodically marked new information and focused constituents (e.g. Hruska & Alter, Citation2004; Toepel et al., Citation2007). However, a Late Positivity has also been observed (in addition to an N400) for unexpected prosodic realisations, i.e. contextually inappropriate or missing accents (e.g. deaccentuation of accessible or new items: Baumann & Schumacher, Citation2012; Schumacher & Baumann, Citation2010), superfluous accents on background information (e.g. Li et al., Citation2018), and deviant or less probable prosodic patterns (due to prior exposure: e.g. Kakouros et al., Citation2018). In the former cases a conflict arises between prosodic and information structural cues, which must be resolved and therefore causes enhanced costs in subsequent discourse updating processes (mental model reorganisation/repair) (see also Brouwer & Hoeks, Citation2013; Dimitrova et al., Citation2012; Magne et al., Citation2005; Toepel et al., Citation2007).
More precisely, the ERP study by Schumacher and Baumann (Citation2010) showed that prosodically encoded information status is processed in real-time and that different pitch accents impact expectation-driven processing and updating in distinct ways. In this study, whole-part relations were tested (“Sabine repaired an old shoe. In doing so, she cut the sole.”) in which the referentially accessible target word (“the sole”) was presented with three different prosodic realisations (the contextually licensed H+L*, a nuclear H* accent and deaccentuation (Ø)). ERPs time-locked to the target word revealed a three-way N400 modulation (Ø > H* > H+L*), reflecting the severity of the mismatch between context and prosody, and a Late Positivity effect for deaccentuation relative to the other two conditions (Ø > H*/H+L*), indicating the need to resolve the conflict between discourse (requiring the introduction of a representation for the target item) and prosody (where deaccentuation falsely indicates that the target entity is already given in discourse). These results suggest that expectation-driven and signal-driven processes are dissociable in real-time comprehension.
Previous EEG research has mostly contrasted one prosodic realisation (or the presence/absence of accentuation) in different contexts and concentrated on predictive processing with respect to the focus-background and the given-new distinction. We were interested in (i) the comparison of different accent types within a given carrier sentence enabling the isolation of signal-driven differences and (ii) the exploration of a further pragmatic dimension – the effect of context evoked by contextualising phrases such as “Guess what happened today” leading to expectations as to how exciting (and prosodically prominent) the content of a following utterance will be. Such an approach bears certain challenges since the target items vary in their acoustic properties. We therefore decided to run regression-based ERP analyses (Smith & Kutas, Citation2015a, Citation2015b) with pitch and intensity as continuous covariates. This allowed us to test for categorical (i.e. higher-order or “cognitive”) effects of the different accent types and at the same time control for low-level (physical) variance. While in the standard ERP analysis ERPs are calculated by simple (unweighted) averaging across conditions, regression-based analysis of ERPs can account for (i) different factor weights, (ii) continuous variables without the need to transform them into categorical variables via binning and (iii) they permit controlling for variance introduced by diverse variables in linguistic experiments (e.g. frequency, number of characters, word length, but also, as here, pitch and intensity).
2. Experiment 1 – signal-driven processes
Experiment 1 addresses the question whether different phonological accent types (in German) evoke fine-grained processing profiles in real time, as suggested by the offline prominence perception task by Baumann and Röhr (Citation2015). Therefore, we tested sentences without context making the acoustic signal the only source for attention orienting. This set-up allowed us to assess correlates of signal-driven prominence linked to the critical word which was presented with four different intonation contours: We tested nuclear accented items with a high level of acoustic prominence (steep f0 rise, L+H* accent), a medial level of prominence (shallow f0 rise, H* accent) and a low level of prominence (f0 fall, H+L* accent) as well as non-prominent, deaccented items (i.e. no accent (Ø) on the critical word). In the latter condition the nuclear accent (L+H*) was realised on a word following the critical word.
Prominence ratings of the same sentences (Röhr et al., Citation2020) already provide behavioural evidence that the accents with a pronounced rising f0 (as in L+H*) generally (i.e. independently of their position in the sentence) involve an extra high level of perceptual prominence, whereas accents with a considerably less pronounced f0 rise (as in H*) and with a falling f0 (as in H+L*) involve a medium level of perceptual prominence. Deaccented words were perceived as least prominent.
With regard to online correlates, the differences in acoustic prominence between the four prosodic conditions may affect the sensory input and influence attention orienting in discrete ways, which we predict to surface as a positive ERP deflection (P300), most likely with an early peak onset, as our predicted measure of attentional orienting.
Hypothesis 1a: If only the acoustic signal plays a role, the four levels of prosodic prominence tested may induce stepwise modulations of the amplitude of the P300. We expect a larger amplitude in the case of an acoustically more prominent item, i.e. based on the findings of Baumann and Röhr (Citation2015) and Röhr et al. (Citation2020), we expect increasing amplitudes of the positivity from deaccentuation (Ø) through falling (H+L*) and shallow rising (H*) to steep rising (L+H*) nuclear pitch accents.
Hypothesis 1b: If not only the acoustic signal but also context plays a role, i.e. if the utterance is interpreted as being uttered out of the blue as in an all-new context, a positivity may be induced in the case of a (contextually) inappropriate prosodic realisation – i.e. items that stand out acoustically (L+H*) or deviate from an unmarked pattern (Ø). An unpredicted utterance results in a conflict between the mental model and the meaning conveyed by the actual utterance. In this case, an update of the model is induced, resulting in a late positive ERP response. In all-new sentences where the whole sentence represents focused new information, a prosodic marking of the last sentence argument by a “neutral”, less prominent nuclear accent, such as H* or H+L*, is assumed to be most appropriate. Accordingly, we expect positivity amplitudes (potentially in addition to a mismatch N400) for the most prominent items with a steep rising (L+H*) nuclear accent and for deviant, deaccented (Ø) items where the nuclear accent occurs in a different position than in the other three conditions.
2.1. Method
2.1.1. Participants
Twenty-four right-handed, monolingual native speakers of German from the University of Cologne participated in this ERP experiment after giving written informed consent in accordance with the Declaration of Helsinki. The protocol was approved by the ethics committee of the German Linguistic Society (No. 2016-09-160914). Data from one participant had to be discarded from the analysis due to excessive ocular and movement artifacts. The remaining 23 participants (16 female, 7 male) were aged between 18 and 28 years (mean age = 23.3 years, SD = 2.9). None of them reported any auditory, visual or neurological impairment.
2.1.2. Stimuli
Four different prosodic realisations of the direct object as the target word were tested in sentences with the structure exemplified in (1): pronominal subject wir, auxiliary verb haben, direct object (e.g. Milena in (1)) and past participle (e.g. getroffen in (1)).
(1) Wir haben Milena getroffen.
we have Milena met
“We met Milena.”
Sixty test sentences with different lexical material for the direct object and participle were constructed and realised with each of the four intonation contours illustrated above (= 240 critical items). The subject and auxiliary verb of the sentences (“Wir haben … ”) were not altered to keep their influence on the prominence perception of the following target word to a minimum. In order to ensure segmental comparability of the 60 target words, they are composed of three syllables with primary stress on the second syllable. As target words we used 37 proper nouns (person names like Milena) and 23 common nouns in their plural form without a definite article (such as Bananen “bananas”). All target words have a simple segmental structure and are mainly composed of voiced sounds to enable a continuous f0 course. Furthermore, in order to avoid truncation or compression of the f0 contour on the nuclear accented target word, the following sentence-final participles are composed of at least three syllables. For segmental comparability we only used participles (60 items) with the prefix ge-. A complete list of stimuli is included in the supplemental online material available via https://osf.io/2hfgm/.
In addition to the test sentences, 120 sentences with an identical syntactic structure were created that served as filler items. The direct objects and participles of all fillers differ in the lexical material and in the number and structure of the syllables they are composed of. With regard to prosodic structure, the fillers always display a nuclear accent with a shallow rise (H*) but vary in the position of the nuclear accent, i.e. each of the four words of the sentence carried the accent 30 times (pronominal subject wir, auxiliary verb haben, direct object and participle). By using the H* accent for all filler items this accent type is more prevalent in the experimental stimuli than the other conditions, i.e. it appears in 180 of the 360 sentences, and in 90 of 180 sentences even on the same item (the target noun). It should be noted that this uneven distribution of accent types can have an effect on prominence perception: According to Kakouros et al. (Citation2018), a higher probability of an f0 contour can make the word less prominent. However, in our study we expect this effect to be considerably less powerful, since our experimental setup involves seven different f0 contours in total (including filler sentences), while Kakouros et al. only contrasted two different f0 contours.
All stimuli (240 critical and 120 filler items) were read by a trained 48-year-old male phonetician and recorded in a sound-attenuated cabin with a sampling rate of 44100 Hz and 16 bit resolution (mono). We controlled the acoustic equivalence of the respective accent types in the test sentences. shows the mean f0 contours as well as the individual f0 contours of all test sentences (= critical items) per condition superimposed on each other. The figures indicate that the intonation contours were produced in a very consistent manner in each of the four conditions.
Figure 2. Top panel: Mean f0 contours of all test sentences per condition temporally aligned with the onset of the critical word in the target sentence (onset at vertical bar); bottom panel: Individual f0 contours of all test sentences per condition, superimposed on each other, from the onset of the test sentence.
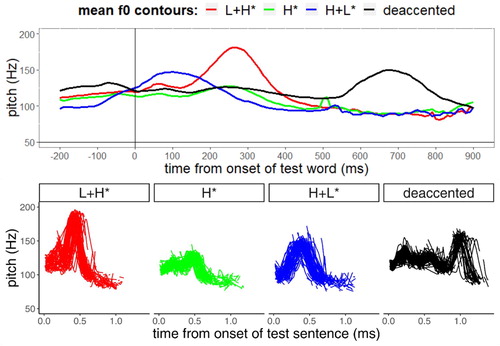
For most stimuli, the originally read version entered the experiment. For some stimuli, we made small adjustments of the accentual tonal targets and resynthesized the naturally produced contours using the speech analysis tool Praat (Boersma & Weenink, Citation2013): The f0 values of the accentual peaks or valleys were adjusted if they exceeded a designated range of 10–15 Hz around the mean value for a specific condition (number of resynthesized stimuli per condition: L+H* = 23, H* = 19, H+L* = 25 and deaccented = 19). The (re)synthesisation process generated (interpolated) smoothed f0 traces that are mostly free of microprosodic perturbations but retain the essential macroprosodic information of the original stimulus. The manipulations were generally kept to a minimum in order to maintain a natural sound quality. We perceptually controlled the naturalness of the resynthesized stimuli in relation to the original versions. shows the means and standard deviations for each experimental condition of (i) the tonal onglide on the target word (i.e. the pitch movement leading towards the starred tone (H*/L*) of the accented syllable in Hertz and semitones) including reference pitch values (i.e. the height of the accentual peaks (H) and valleys (L)), (ii) the intensity of the test sentences as well as (iii) the duration of the test sentences and their constituents. The values show stepwise differences in the height of the f0 peak corresponding to the accentual H tone with the highest value for L+H* accents, a medial value for H+L* accents (with an early peak, see ) and the lowest value for H* accents (which is similar to the f0 value of deaccented target syllables). As intended, target words with a steep rising (L+H*) accent and a falling (H+L*) accent also exhibit larger tonal onglides than a shallow rising (H*) accent. Furthermore, the values for duration are generally higher for test sentences with an H+L* accent and deaccentuation on the target word than for the other two conditions (except for the duration of the participle after an H+L* accent). Clearly, it takes longer to mark a tonal peak before the accented syllable, as a contrast to the medial and late peaks displayed by the other accent types. The increased duration of deaccented items may be a compensatory effect for the lack of tonal movement (see e.g. Grice & Baumann, Citation2002).
Table 1. Means and standard deviations (in brackets) for each experimental condition of (i) the tonal onglide (in Hertz, Hz and in semitones, st) on the test words including the height of the accentual peaks (H) and valleys (L) (in Hertz, Hz), of (ii) the intensity (in decibel, dB) of the test sentences as well as of (iii) the duration (in milliseconds, ms) of the test sentences and its constituents. (The accentual H for deaccentuation refers to the f0 value in the middle of the vowel of the stressed syllable. The accentual L for H* accents refers to the f0 value 30 ms before the accented syllable.).
During EEG recording participants performed a word recognition task after each stimulus. For this task, stimuli were matched with a correct or an incorrect probe word. Recognition items systematically represented proper/common nouns and participles in the critical sentences as well as all words in the filler sentences. The different recognition items and expected yes/no responses were equally distributed across the materials and conditions.
Each experimental session contained all 360 trials, involving 240 critical items (60 lexically different sentences × 4 intonation contours) plus 120 filler items. Critical and filler items were pseudo-randomised. Two lists with different randomisations were used. Each participant saw only one of the two lists of the 360 items which were presented in eight blocks with pauses in between. Critical and filler items as well as the different conditions were evenly distributed across blocks, i.e. on average 30 critical sentences (SD = 3.2) with 7.5 items per condition (SD = 1.7) and 15 filler sentences (SD = 3.2) with 3.9 items per condition (SD = 1.5) were presented in each experimental block. By means of pseudo-randomisation and distribution of test sentences with the same lexical material into different blocks, we aim to account for potential effects of word frequency and repetition on prominence perception as reported by Cole et al. (Citation2010), since each target word plus participle occurs four times (with different prosody) during the whole experiment. Furthermore, in order to avoid systematic order and frequency effects in the exposure to the stimuli, experimental stimuli were presented in different condition sequences across the blocks.
2.1.3. Procedure
After electrode application, participants were seated in a sound-attenuated cabin. They were instructed to look at the computer monitor in front of them and to focus on a fixation star while the auditory stimuli were presented over loudspeakers. The presentation level was kept constant across participants. In order to assess participants’ attentiveness they had to perform a word recognition task: After each auditory stimulus a word was presented and the participants had to decide whether this word had occurred in the previous stimulus or not. Answers were given by pressing one of two buttons (for “yes” or “no”) on a game controller as quickly and accurately as possible.
At the beginning of the recording session participants were familiarised with the experimental procedure by means of a short practice block (six stimuli). Each experimental trial started with the presentation of a fixation star in the centre of the screen. The auditory stimulus was presented after 500 ms, while the fixation star remained on the screen. Between the end of the auditory stimulus and the visual presentation of the probe word for the recognition task the screen was blank for 500 ms. Maximum response times to the word recognition task were set to 4000 ms. The next trial started after 1000 ms. The probe words as well as the fixation star were visually presented in the centre of the screen in pale yellow characters on a dark grey background. The experiment consisted of eight blocks (forty-five trials per block) with pauses in between. Participants individually determined the duration of the pauses between blocks. The experiment took about 40 min (without pauses).
2.1.4. Data recording, preprocessing and analysis
The electroencephalogram (EEG) was recorded and digitised (500 Hz) by means of 24 Ag/AgCl electrodes placed on the scalp according to the standard 10–20 system (BrainVision Brain-Amp amplifier). EEGs were referenced online to the left mastoid. The ground electrode was placed at AFz. To control for eye-movement artifacts, the electrooculogram (EOG) was recorded by two pairs of electrodes – for horizontal eye movements, these were placed at the outer canthus of each eye, and for vertical eye movements, electrodes were placed above and below the left eye. Electrode impedances were kept below 5 kΩ.
Due to design-immanent differences in the acoustic properties across the critical conditions, we performed a regression-based ERP (rERP) analysis: The data were analysed using a python3 implementation of MNE python (Gramfort et al., Citation2014), version 0.15. After the data were re-referenced to linked mastoids, we used automatic detection of blinks and saccades on the raw data. The identified portions of raw data containing blinks were excluded from further analysis. Furthermore, the ERP analysis only included trials with correct responses to the word recognition task. This resulted in the rejection of 5.73% of the data points over all conditions (correct responses per condition: L+H* = 93.8 %, H* = 94.8 %, H+L* = 96.1 % and deaccented (Ø) = 97.0 %). The EEG data were filtered with a 0.3–45 Hz bandpass filter (cf. Friederici et al., Citation2000; Maess et al., Citation2016a, Citation2016b; Schumacher & Hung, Citation2012; Widmann et al., Citation2015; Wolff et al., Citation2008). We consider that the filtering procedure is more advantageous in dealing with pre-stimulus differences that are inherently associated with different pitch accent types than applying a baseline correction (see Maess et al., Citation2016a, Citation2016b on advantages of appropriate filters over baseline correction). After filtering, the data were epoched from –200 to 900 ms post stimulus onset. For the calculation of the regression-based event-related potentials (rERPs; cf. Hauk et al., Citation2006; Sassenhagen, Citation2019; Smith & Kutas, Citation2015a, Citation2015b), data were downsampled to 100 Hz to reduce computational demands.
The rERP analysis was then carried out using the lm() function in R (R Core Team, Citation2018). We calculated linear regression models for each time point (10 ms steps) and channel per participant (per channel = 110 models) with three factors: a categorical factor condition (accent type of target word: L+H*, H*, H+L*, Ø) and two continuous covariates pitch (Hz) and intensity (dB). Intensity and pitch were extracted for periods of 10 ms from the audiofiles using a Praat script from −200 to 900 ms post critical word onset. After model calculation, the effect of the categorical factor condition was extracted from each model (using the effect() function as implemented in the “effects” package in R (Fox & Weisberg, Citation2018)) under exclusion of the contribution of the continuous factors pitch and intensity. Hence, the rERP plots show the fitted microvolt values for each condition based on the beta coefficients for every time point and channel. A comparison with classic ERPs showed that the regression-based analysis significantly reduced “noise”, especially in the first 200 ms after stimulus onset.
The fitted microvolt values for every time point and channel (rERPs) were then used for further statistical analysis (cf. Hauk et al., Citation2006 for a similar procedure). To test for statistical significance, we calculated linear mixed-effect models using the lmer() function from the “lme4” package for R (Bates, Mächler, et al., Citation2015) with mean fitted microvolt values from 0 to 900 ms in steps of 100 ms as dependent variable. The models included a fixed factor condition (prosody: L+H*, H*, H+L*, Ø) as well as two continuous factors sagittality and laterality based on the planar (x and y) coordinates of the standard BESA coordinate system. The categorical variable was encoded with treatment coding, i.e. each level of the categorical variable is contrasted to a specified reference level, such that the model coefficient represents the size of the contrast from a given predictor level to the reference level. The H+L* (falling accent) condition served as reference level, since this accent type commonly occurs in reading style especially in isolated sentences or paragraph finally (Grice & Baumann, Citation2016). This accent type is also used in the “neutral” condition in Experiment 2 (see Section 3.1.2). For plotting, we grouped electrodes into quadrants after model calculation (left, right, anterior, posterior) and calculated the mean of the effects. Therefore, we arrive at a categorisation that is comparable to a traditional ROI analysis, while the central and lateral midline electrodes are still part of the model, contributing to overall power and fit. For model comparison, we used a backwards approach in each time window, starting with maximally specified random effects until we arrived at a converging model (cf. Bates, Kliegl, et al., Citation2015). The models all assume random intercepts and slopes for condition by participants. In the following, we will report only effects that are significant by the |t| > 2 criterion (corresponding to the classic significance level of p ≤ .05; cf. Baayen et al., Citation2008). The full model summaries are included in the supplemental online material available via https://osf.io/2hfgm/.
2.2. Results
depicts the grand-average rERPs for the four experimental conditions time-locked to the onset of the critical word and illustrates statistically significant effects for relevant time windows (see also in Section 2.3 for pairwise comparisons). In the following, the rERP waveform for H+L* accents (blue line) serves as reference for all other conditions. That is, when we speak of positivities or negativities in the following, we use these terms relative to the reference condition.
Figure 3. Grand-average rERPs for the four experimental conditions (negativity plotted upwards). Electrodes are grouped by centrality, laterality and sagittality. Time course on horizontal axis spans from 200 ms before until 900 ms after the onset of the critical word (vertical bar). Solid arrows indicate different rERP effects for the critical word. Dashed arrows indicate different rERP effects for the participle.
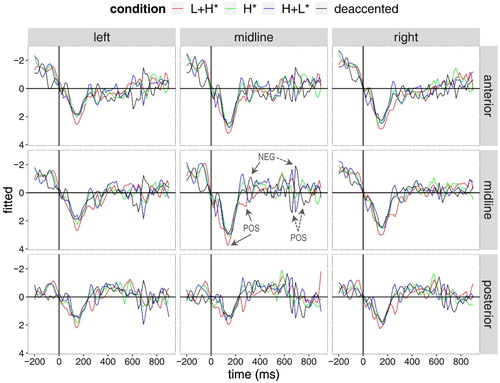
Figure 4. Mean f0 contours (top panel) for the test sentences of the four experimental conditions synchronised with grand average rERPs (negativity plotted upwards) at a selected electrode (Cz). The rERPs for different conditions are pairwise compared with the H+L* condition. Time course on horizontal axis spans from 200 ms before until 900 ms after the onset of the critical word (vertical bar). Solid arrows indicate different rERP effects for the critical word. Dashed arrows indicate different rERP effects for the participle.
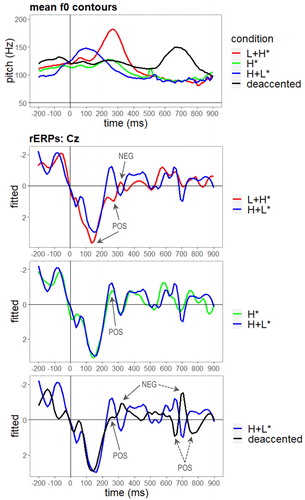
The rERPs show in particular a series of positivities (labelled “POS” in and ): First, there is a large positive-going waveform between 100–200 ms for all conditions which is most pronounced for L+H* accents (red line). This is followed by another positive peak between 200–300 ms for L+H* accents over central and posterior regions. Furthermore, between 600–800 ms (i.e. after the onset of the participle) the rERPs for the deaccentuation condition (black line) reveal two positive-going peaks. In addition, the waveforms for L+H* accents and deaccentuation show a small negative-going peak in the time window between 300–400 ms, while the waveform for deaccentuation also shows a pronounced negative-going peak around 700 ms (negativities are labelled “NEG” in and ).
In the following we will report the results of the statistical analyses for the time windows mentioned above. An overview of all statistically significant results is given in (see also supplemental online material at https://osf.io/2hfgm/ for statistical details). Furthermore, based on pairwise comparison, significant contrasts between all other conditions will additionally be reported (in parentheses). Unless otherwise indicated, the conditions do not differ significantly from each other.
Table 2. Significant effects of the statistical analyses for each time window (100 ms) with specification of the conditions that significantly differ relative to the H+L* condition.
For the time window from 100–200 ms, statistical analyses revealed a significant effect of condition [χ2 = 9.31, p = .03] as well as an interaction of sagittality x condition [χ2 = 28.82, p < .001]: The rERPs for L+H* accents are significantly more positive than the rERPs for H+L* accents (and for the other two conditions), while the rERPs for the other conditions do not differ significantly from H+L* (and from each other). The contrast between rERPs for L+H* and the other conditions is enhanced in anterior regions (sag:cond[L+H*]: beta = .25, t = 4.58).
For the time window from 200–300 ms, statistical analyses registered significant effects of condition [χ2 = 12.99, p = .005] and of the interactions sagittality x condition [χ2 = 9.83, p = .02] and laterality x condition [χ2 = 18.15, p < .001]: Here, all rERPs deviate from the H+L* condition in a positive direction. The rERPs for L+H* accents are overall more positive than the rERPs for the other conditions (cond[L+H*]: beta = .63, t = 2.74), but reveal a significant effect only relative to H+L* which is more pronounced in right-lateral regions (lat:cond[L+H*]: beta = .22, t = 4.22). Furthermore, H* accents and deaccentuation (which do not differ significantly from each other either) engender significantly more positive rERPs than H+L* accents in anterior regions (sag:cond[H*]: beta = .13, t = 2.10; sag:cond[Ø]: beta = .18, t = 2.56). For deaccentuation this effect is also registered in right-lateral regions (lat:cond[Ø]: beta = .13, t = 2.52).
For the time window from 300–400 ms, statistical analyses revealed a sagittality x condition interaction [χ2 = 42.10, p < .001]: The rERPs for the L+H* accents (significantly deviate from the other three conditions and) are more negative relative to H+ L* (and H*) accents (and more positive relative to deaccentuation) in anterior regions (sag:cond[L+H*]: beta = −.24, t = −4.85).
With regard to the later time windows, statistical analyses registered an interaction of sagittality x condition for the time windows from 600–700 ms [χ2 = 53.10, p < .001] and from 700–800 ms [χ2 = 19.12, p < .001], as well as an interaction of laterality x condition for the time window from 700–800 ms [χ2 = 38.98, p < .001]: Between 600–700 ms, rERPs for deaccentuation are significantly more positive than rERPs for H+L* (as well as for H* and L+H*) accents in anterior regions (sag:cond[Ø]: beta = .64, t = 5.96), and between 700–800 ms they are more positive in posterior and right-lateral regions (sag:cond[Ø]: beta = −.32, t = −3.40; lat:cond[Ø]: beta = .31, t = 3.93). However, in the later time window the contrast registered in posterior regions is only significant between the deaccentuation and H+L* condition. Between 700–800 ms, H* accents moreover engender significantly more negative deflections than H+L* accents in anterior regions (sag:cond[H*]: beta = −.35, t = −3.70).
2.3. Discussion
In this EEG study we investigated the processing of different German accent types plus deaccentuation in the absence of context with the aim of identifying signal-driven processes. provides an illustration of the rERP effects by depicting pairwise comparisons of the grand-average rERPs at a selected electrode (Cz) for each prosodic condition in relation to the H+L* accent condition. Additionally, the rERPs are presented temporally aligned to the mean f0 contours (top panel of ) for all test conditions, which enables a direct comparison of the rERP traces with the corresponding f0 traces. While we were able to “extract” the effect of the continuous pitch changes, we still see its impact on the EEG response. At time points of maximum deviation between pitch contours (100–300 and 500–800 ms), we also see maximum deviation among rERP waveforms. Given that the effect of pitch is statistically accounted for, this suggests that at these time points the different accent types can be successfully distinguished. We examine this in detail below.
The early f0 peak of the falling (H+L*) accents is reached just before 100 ms after the onset of the critical word. Subsequently, between 100–200 ms the falling f0 movement starts towards the low tonal target which coincides with the start of the steep and shallow rising f0 movements of the L+H* and H* accents. Between 200–300 ms, these two high and rising accents (L+H* and H*) reach their accentual peaks, with the greatest displacement and highest f0 value for L+H* accents. Here, H* accents and deaccented items show a similar, slightly rising pitch contour with a moderately high f0 value, while H+L* accents still show a falling contour, with the lowest f0 value of all conditions. Between 300–500 ms, all items exhibit a more or less steep falling f0 movement reaching a minimum around 500 ms after the onset of the critical word. Between 500–800 ms, conditions with a nuclear accent on the critical item exhibit a flat contour at the same low f0 level, while conditions with a deaccented critical item exhibit a rising-falling f0 movement on the participle, which is accented in this condition only, with L+H*.
As far as the electrophysiological correlates are concerned, the most prominent accent, L+H*, which has a steep rise in f0, has been found to engender effects at an early processing stage. This is reflected in two early positive rERP deflections (see “POS” in the second panel of ) between 100–300 ms after the onset of the critical item that resemble P300 effects. The first occurs between 100–200 ms at the beginning of the f0 rise, while the second occurs between 200–300 ms, when the f0 peak is reached. The rERPs for H* accents and deaccentuation also revealed significant deviations in a positive direction from rERPs for H+L* accents (see early “POS” in the third and fourth panel of ). It appears that these early positive deflections (for L+H*, H* and deaccentuation) are triggered by a rising pitch excursion and a higher pitch in relation to the falling, low pitched (H+L*) accents. Between 200–300 ms, rERPs show a three-way modulation – the positive deviation (relative to H+L*) is most pronounced for L+H* accents, somewhat pronounced for deaccentuation and least pronounced for H* accents. However, the differences between the three conditions did not reach statistical significance.
These results are in accordance with studies showing that rises in speech stimuli evoke a P300 effect (Hsu et al., Citation2015). Importantly, in our study it is a rise on the stressed syllable of the critical word (and of the accented participle, see below) and not a rise elsewhere. For instance, there is a rise in the H+L* accent, but it is before the stressed syllable and could be seen as a transitional f0 contour preparing for the fall in pitch on the stressed syllable. This rise does not appear to evoke a P300 effect. We take this to reflect the prosodic structure of German, in which the stressed syllable is the docking site for pitch accent tones and thus the part of the word on which communicatively relevant, distinctive f0 is placed. Mandarin Chinese, for example, has a greater density of docking sites for tone, such f0 is distinctive on (almost) every syllable. This explains the difference between our results and those of Hsu et al. for Mandarin who found that rises on any syllable evoked a P300. We take this to be evidence that it may be meaningful rises that orient attention, rather than rises per se. The present data support these findings, and suggest that encountering an accented item with a strong prosodic prominence, i.e. with a raised f0 on the stressed syllable, results in more attention allocation reflected in an enhanced positivity. Additionally, however, the data seem to indicate that the observed Early Positivity is not purely signal-driven (contra Hypothesis 1a) but is modulated by context: In line with the assumption that H* and H+L* accents are the most appropriate prosodic realisations of the target word in the out of the blue context, the most pronounced early positivities were observed for targets with a steep rising (L+H*) nuclear accent and for deaccented targets. This confirms Hypothesis 1b with an early onset latency of the positivity.
Similar effects can be observed during processing of the L+H* accents on the participle (after 500 ms) in the deaccentuation condition. The f0 peak is reached between 600–700 ms, and rERPs show a positivity (in relation to H+L*) plus another positivity during the falling f0 movement between 700–800 ms (see late “POS” in the fourth panel of ). Since rERPs appear to be sensitive to the f0 movement in the vicinity of a stressed syllable, we will interpret these rERP deflections in relation to the beginning of the participle. Results suggest that the strong prosodic prominence of the participle (in combination with the deviating and rare position of the nuclear accent) engenders positivities resembling effects of the P300 component family. Hence, these data provide further evidence for attention allocation triggered by prosody.
The data also suggest that mismatches between context and prosody (based on expectations that are induced by an out of the blue context and calibrated in relation to the stimulus set) result in negative-going potentials (N400). This is reflected in negativities (labelled “NEG” in ) for the prominent L+H* accent (and deaccentuation) between 300–400 ms as well as a negativity induced by the accent on the participle observable around 700 ms in the deaccentuation condition (labelled as “NEG” in ). While the negativity around 300–400 ms most likely represents a prediction error response (N400) to inappropriate prosody on the target, the pronounced negativity around 700 ms most likely represents a prediction error response that reflects the difficulty to reconcile the unexpected accentuation pattern on the following word, i.e. a prominent nuclear accent on the participle, with an all-new interpretation triggered by the lack of contextual information.
In general, the results of the current study did not register gradient effects in the neurocognitive processing of different accent types as proposed in Hypothesis 1a, but rather imply that context (out of the blue context and/or the stimulus set) plays a role which affects the processing of more or less “marked” prosodic realisations. The results confirm that phonetic cues to prominence such as pitch are computed and processed as the sensory input unfolds and suggest that acoustically prominent accents or inappropriate accent patterns (including missing and unexpected accents) yield early positive deflections as a mechanism of signal-driven attention orienting (P300 effects) and engender costs in the sense of prediction errors (N400 effects).
3. Experiment 2 – expectation-driven processes
The second experiment is concerned with the nature of the interplay between expectation-driven processes and signal-driven attention orienting. We tested sentences in relation to a pre-context that triggers expectations about appropriate upcoming prosody. This set-up served the purpose of identifying correlates of expectation-driven prosodic prominence linked to the critical word which was presented with two different pitch accent types. We used the test sentences from Experiment 1 that were realised with a prominent rising (L+H*) accent and a less prominent falling (H+L*) accent. The test sentences were crossed with two types of context (implying that what is to come is exciting or neutral) that either matched or mismatched the prosodic realisation of the test sentences. Exciting context sentences (e.g. “Guess what happened to us today!”) license a prominent accent (L+H*) on the critical word in the test sentence, while neutral contexts (e.g. “Today, nothing special happened.”) commonly entail a less prominent accent (H+L*).
In a previous behavioural study (mentioned above), we conducted prominence and appropriateness ratings of the contextualised sentences (Röhr et al., Citation2020). Results confirm that rising (L+H*) accents involve a high level of prosodic prominence, while falling (H+L*) accents involve a lower level of prominence and reveal – contrary to findings of previous studies for English (e.g. Bishop, Citation2012) – that contextually induced expectations did not affect the perception of prominence. However, the different levels of perceptual prominence appear to license the use of a particular accent type in different contexts: While L+H* accents were only appropriate as a marker of exciting information, H+L* accents were similarly appropriate as a marker of neutral and exciting information.
With regard to online correlates, mismatches, i.e. incongruent combinations of prosody and context-induced expectation, but also differences in acoustic prominence between the two prosodic conditions may affect the sensory input and influence expectation- and signal-driven processes in discrete ways.
Hypothesis 2a: We expect that mismatches will result in a prediction error (N400) on the critical item of the target sentences.
Hypothesis 2b: In addition to an N400, a (Late) Positivity may arise as a repair of conflicting information (as suggested by Schumacher & Baumann, Citation2010) or when a prominent pitch accent (L+H*) leads to mental model updating.
3.1. Method
3.1.1. Participants
Twenty-four right-handed, monolingual native speakers of German from the University of Cologne participated in this ERP experiment after giving written informed consent in accordance with the Declaration of Helsinki. The protocol was approved by the ethics committee of the German Linguistic Society (No. 2016-09-160914). Data from two participants had to be discarded from the analysis due to excessive ocular and movement artifacts. The remaining 22 participants (19 female, 4 male) were aged between 19 and 26 years (mean-age = 22 years, SD = 1.9). None of them reported any auditory, visual or neurological impairment and they did not overlap with the group of participants of Experiment 1.
3.1.2. Stimuli
In this experiment two pitch accent realisations from Experiment 1, i.e. critical sentences with a rising (L+H*) accent and a falling (H+L*) accent on the target words (see (2a) and (2c) in Section 2.1.2) were reused as test sentences and crossed with two types of pre-contexts. The two context sentences generate two types of expectations about appropriate prosody in the test sentences, as exemplified in (3) and (4). The stylised lines above the sample sentences in (3b) and (4b) illustrate the two intended intonation contours of the test sentences. The position of the nuclear accent is indicated by capital letters: The context in (3a) builds up an expectation for “new”, exciting information, guiding the attention of the listener to an event that should be highlighted by prosodic prominence. By contrast, the context in (4a) establishes that nothing “new” or unusual will follow and thus builds up an expectation for a more neutral prosodic realisation, i.e. less prosodic prominence. Test sentence (3b), with a prominent accent (L+H*) appropriate for “new”, exciting information, matches context (3a) but not context (4a). Conversely, test sentence (4b), with a less prominent accent (H+L*), typically found on contextually derivable information, matches context (4a) but not context (3a), although it may be permissible after this context, owing to its neutral character.
Sixty context sentences for the exciting and neutral context each were created along the lines of (3a) and (4a) with different lexical material (= 120 context sentences). In order to avoid expectations that may arise from pragmatic or semantic aspects, we controlled the context sentences with respect to their effect on (i) the focus structure of the test sentences and (ii) the level of givenness of the sentence constituents. In all critical sentences the target word and the sentence-final participle are part of a broad focus domain and are not derivable from the context. Moreover, we tried to keep the different contexts semantically as unspecific as possible and did not use nouns or participles of the critical sentences so as to avoid word frequency or repetition effects as reported by Cole et al. (Citation2010). A complete list of stimuli is included in the supplemental online material available via https://osf.io/2hfgm/.
In addition to the critical sentences, the 120 filler sentences of Experiment 1 were used. We designed an exciting or neutral context for each filler sentence so that both context types are equally distributed over the four different filler conditions (with an H* nuclear accent on the pronominal subject, auxiliary verb, direct object or participle).
All context sentences (120 for critical and 120 for filler items) were read as neutrally as possible by the same speaker who read the critical sentences (see Section 2.1.2) and were recorded in the same sound-attenuated cabin with a sampling rate of 44100 Hz and 16 bit resolution (mono). No further adjustments of the stimuli were made. In the experimental session context and target sentences were merged to one stimulus separated by a pause of 400 ms.
During EEG recording participants performed a word recognition task after each stimulus (as in Experiment 1). For this task, stimuli were matched with a correct or an incorrect probe word. We systematically asked for proper/common nouns and participles in the critical sentences, all words in the filler sentences and random words in the context sentences (critical and filler). The different recognition items and expected yes/no responses were equally distributed across the materials and conditions.
Each experimental session contained all 360 trials, involving 240 critical items (60 lexically different context sentences per 2 context types crossed with 60 lexically different test sentences x 2 intonation contours) plus 120 filler items (60 lexically different context sentences per 2 context types evenly combined with 30 lexically different filler sentences per 4 accent positions). Critical and filler items were pseudo-randomised (cf. Experiment 1, Section 2.1.2). Two lists with different randomisations were used. Each participant saw only one of the two lists of the 360 items which were presented in eight blocks with pauses in between. Critical and filler items as well as the different conditions were evenly distributed across blocks, i.e. on average 30 critical sentences (SD = 1.5) with 7.5 items per condition (SD = 1.2) and 15 filler sentences (SD = 1.6) with 2 items per condition (SD = 0.9) were presented in each experimental block. In order to prevent repetition effects, test sentences with the same lexical material were assigned to different experimental blocks. Furthermore, in order to avoid systematic order and frequency effects in the exposure to the stimuli, experimental stimuli were presented in different condition sequences across the blocks.
3.1.3. Procedure
This experiment was conducted in exactly the same way as Experiment 1 (cf. Section 2.1.3) and took about 60 min (without pauses).
3.1.4. Data recording, preprocessing and analysis
The same EEG recording technique and preprocessing method was applied as in Experiment 1 (see Section 2.1.4). The exclusion of raw data containing blinks and of trials with false responses to the word recognition task resulted in the rejection of 6.52 % of the data points over all conditions (correct responses per condition: exciting/L+H* = 92.8 %, neutral/L+H* = 92.7 %, exciting/H+L* = 95.6 % and neutral/H+L* = 93.2 %).
After the EEG recording, we again computed rERPs on 100 Hz resampled epoched data between −200 and 900 ms relative to the onset of the critical word. The plots are based on linear regression models for each time point and channel per participant (per channel = 110 models) with the categorical factors prosody (accent type of target word: L+H* and H+L*) and context (exciting and neutral) and two continuous covariates pitch (Hz) and intensity (dB). After model calculation the interaction of the categorical factors prosody x context was extracted (using the effect() function from the “effects” package in R (Fox & Weisberg, Citation2018)) under exclusion of the contribution of the continuous factors pitch and intensity. The rERP plots thus show the fitted microvolt values for each condition based on the beta coefficients for every time point and channel.
Then the mean fitted microvolt values of 100 ms time windows from 0 to 900 ms were used as dependent variable for the statistical analysis. We fitted linear mixed-effects models for the full prosody by context design (using the lmer() function from the “lme4” package for R (Bates, Mächler, et al., Citation2015)) with prosody (L+H*, H+L*) and context (exciting, neutral) as fixed effects as well as the two continuous factors sagittality and laterality based on the planar coordinates of the standard BESA coordinate system. We included by-subject intercepts and slopes for prosody and context as random effects. The categorical variable was encoded with sum encoding (i.e. ANOVA-style coding), such that the model coefficient represents the size of the contrast from a given predictor level to the (grand) mean.
We then carried out separate analyses for L+H* accents and H+L* in those 100 ms time windows that registered a prosody x context interaction. The models included context (exciting, neutral) as fixed factor, the continuous factors sagittality and laterality and by-subject intercepts and slopes for context as random effect. In the following, we will report only effects that are significant by the |t| > 2 criterion (cf. Baayen et al., Citation2008). The full model summaries are included in the supplemental online material available via https://osf.io/2hfgm/.
3.2. Results
depicts the grand-average rERPs for the overall two-by-two design time-locked to the onset of the critical word and illustrates statistically significant effects of prosody. The rERPs registered a pronounced positivity between 100–200 ms for the prominent, rising accents (L+H*, red lines) relative to the less prominent, falling accents (H+L*, blue lines). Subsequently, the prominent accents engendered a more negative deflection between 200–300 ms (over anterior and right-lateral regions), followed by another positivity around 600 ms. These effects were confirmed by the statistical analyses summarised in (see also supplementary online material at https://osf.io/2hfgm/ for statistical details). For instance, the analyses showed an effect of prosody for the early time windows from 0–100 ms [χ2 = 40.48, p < .001] and 100–200 ms [χ2 = 74.14, p < .001] as well as for the later time windows from 500–600 ms [χ2 = 6.89, p = .008] and 600–700 ms [χ2 = 15.72, p < .001]. We return to the overall effects of prosody in the general discussion below. In the following two sections, we first report separate analyses resolved by prosody for those time windows that registered a prosody x context (x sagittality/laterality) interaction and subsequently compare the processing profiles for the two prosodic conditions with their profiles registered in Experiment 1 (without context).
Figure 5. Grand-average rERPs for all experimental conditions (negativity plotted upwards). Electrodes are grouped by centrality, laterality and sagittality. Time course on horizontal axis spans from 200 ms before until 900 ms after the onset of the critical word (vertical bar). Arrows indicate effects of prosody.
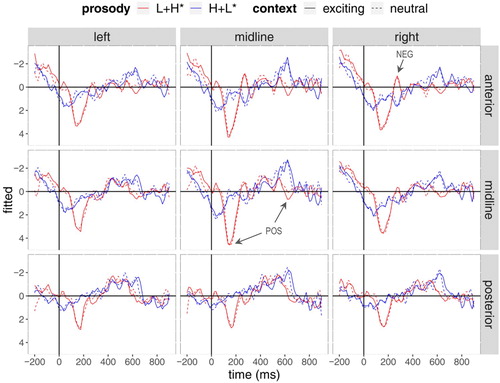
Table 3. Significant effects of the statistical analyses for each time window (100 ms) of rERPs for the overall design.
3.2.1. Experiment 2 – the effect of context
In the grand-average rERPs (time-locked to the onset of the critical word in the test sentences) are presented for the rising (L+H*) accents in the top panel (indicated in red) and for the falling (H+L*) accents in the bottom panel (indicated in blue). Arrows indicate significant effects. An overview of all statistically significant results for L+H* and H+L* accents is given in (see also supplemental online material at https://osf.io/2hfgm/ for statistical details).
Figure 6. Grand-average rERPs for L+H* accents (top panel) and H+L* accents (bottom panel). Negativity is plotted upwards. Electrodes are grouped by centrality, laterality and sagittality. Time course on horizontal axis spans from 200 ms before until 900 ms after the onset of the critical word (vertical bar). Arrows indicate effects of context.
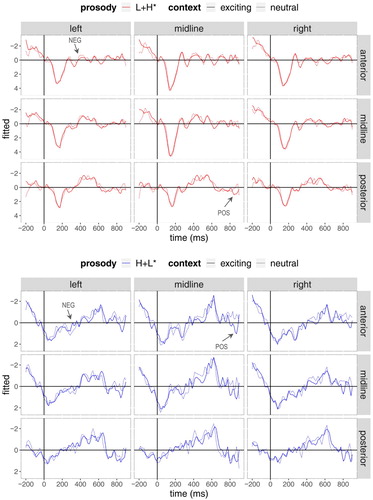
Table 4. Significant effects of the statistical analyses for each time window (100 ms) of rERPs for L+H* accents (top) and for H+L* accents (bottom).
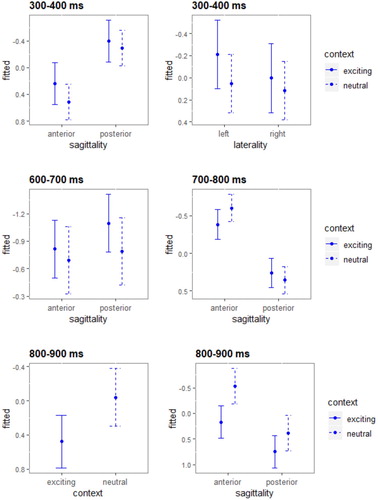
The top panel of indicates that the grand-average rERPs for L+H* accents show a negative deflection between 300–500 ms for the (inappropriate) neutral context (red dashed line) in central and anterior regions and a positive-going potential between 800–900 ms for the exciting context (red solid line). With regard to the former time windows, statistical analyses registered a significant interaction of sagittality x context for the time windows from 300–400 ms [χ2 = 6.74, p = .009] and from 400–500 ms [χ2 = 6.21, p = .01], as well as an interaction of laterality x context for the time window from 400–500 ms [χ2 = 8.49, p = .003]. The effect plots in illustrate for the respective time windows that the rERPs for the rising (L+H*) accents are significantly more negative after the mismatching neutral context than after the matching exciting condition over anterior and left-lateral regions. For the time window from 800–900 ms, statistical analyses revealed an interaction of sagittality x context [χ2 = 22.45, p < .001] and a sagittality x laterality x context interaction [χ2 = 5.22, p = .02]: The effect plots for this window () confirm a more positive effect for the exciting context over (left) posterior electrode sites.
Figure 7. Significant context effects of rERPs for L+H* accents for the time windows from 300-400 ms (top panel), from 400-500 ms (medial panels) and from 800-900 ms (bottom panels). Error bars represent 83% confidence intervals, i.e. 0.05 significance level. Negativity is plotted upwards.
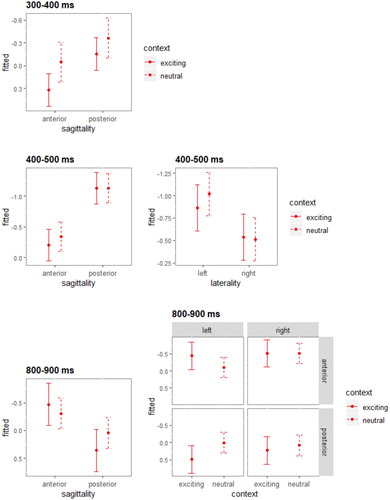
As to the results for H+L* accents (see bottom panel of ), the rERPs for the (inappropriate) exciting context (blue solid line) show a negative-going potential between 300–400 ms over anterior, left-lateral regions and a positive-going deflection between 400–500 ms (which however only reached marginality). Starting at 600 ms after the onset of the critical word, the exciting context registered another positivity. Within the 300–400 ms time window, statistical analyses registered a significant interaction of sagittality x context [χ2 = 8.17, p = .004], as well as an interaction of laterality x context [χ2 = 3.98, p = .05]. The effect plots in illustrate for the respective time window that the rERPs for the falling (H+L*) accents are significantly more negative after the mismatching exciting context than after the matching neutral condition (blue dashed line) over anterior and left-lateral regions. For the later time windows from 600–900 ms, statistical analyses revealed sagittality x context interactions [600–700 ms: χ2 = 4.94, p = .03; 700–800 ms: χ2 = 17.12, p < .001; 800–900 ms: χ2 = 7.24, p = .007] and for the time window from 800–900 ms there was also an effect of context [χ2 = 4.14, p = .04]. The effect plots for these time windows () confirm a more positive effect for the exciting context over anterior electrodes.
Figure 8. Significant context effects of rERPs for H+L* accents for the time windows from 300-400 ms (top panels), from 600-800 ms (medial panels) and from 800-900 ms (bottom panels). Error bars represent 83% confidence intervals, i.e. 0.05 significance level. Negativity is plotted upwards.
3.2.2. Experiment 1 and Experiment 2 – a comparison
In Experiment 2, we used a subset of the test stimuli from Experiment 1, i.e. sentences with a rising (L+H*) and a falling (H+L*) accent on the critical word, which allows us to assess whether context in general has an effect on the processing profiles of the two accent types. Below we compare the processing profiles for the accent types tested in isolation (Experiment 1) with their processing profiles obtained in relation to context (Experiment 2). depicts the grand-average rERPs (bottom panels) together with the mean f0 contours (top panels) of the tested accent types temporally aligned to the onset of the critical word in the target sentence (onset at vertical bar). The rERPs of Experiment 1 are displayed in the (bottom) left panel and the rERPs of Experiment 2 in the (bottom) right panel. Results for prominent rising (L+H*) accents are indicated in red and for less prominent falling (H+L*) accents in blue.
Figure 9. Mean f0 contours of the experimental stimuli (top panels) synchronised with grand average rERPs for L+H* and H+L* accents (negativity plotted upwards) at a selected electrode (Cz). The left panel displays results of Experiment 1 (without context) and the right panel of Experiment 2 (with context). Time course on horizontal axis spans from 200 ms before until 900 ms after the onset of the critical word (vertical bar).
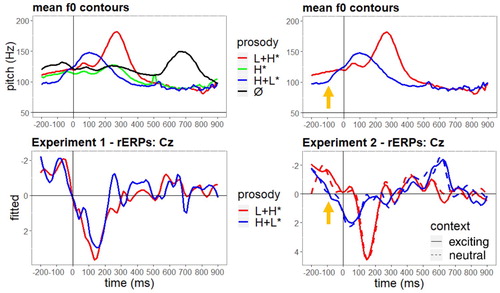
The rERPs show that the processing profiles of Experiment 1 (without context) were less distinct in the early positive peak. However, the comparison of Experiment 1 and Experiment 2 still supports the view that signal-driven prosodic prominence results in an early positive deflection: In both studies the L+H* accent evoked an Early Positivity relative to the less prominent H+L* accent, which is more pronounced in Experiment 2 (with context).
Furthermore, a comparison of the two experiments reveals earlier rERP onsets for falling (H+L*) accents in Experiment 2 (with context). Differences in the f0 movement before the onset of the test word seem to lead to these differences in the onset latencies of the respective rERPs: shows that there is an f0 movement before the onset of test words with a falling accent (indicated by the orange arrow in the top right panel), while there is no f0 movement at this point in the stimuli with rising accents. In Experiment 2 the onsets of the rERPs for the falling (H+L*) accents (indicated by the orange arrow in the bottom right panel of ) appear to be triggered by the start of the rising f0 movement before the onset of the test word. In Experiment 1 there is no such effect of this movement before the test word which suggests that the presence of the other two prosodic conditions (H* and deaccentuation) reduces the perceptual differences between the L+H* and H+L* conditions.
3.3. Discussion
In this EEG study we investigated the processing of prominent rising (L+H*) and less prominent falling (H+L*) accents in relation to matching and mismatching contexts with the aim of identifying expectation-driven processes.
In line with Experiment 1, results generally confirm that prominent accents consume attentional resources. This is reflected in pronounced positivities between 100–200 ms (Early Positivity effect) and additionally around 600 ms (Late Positivity effect) after the onset of the critical item. This finding is also in line with prominence ratings of the same stimuli (Röhr et al., Citation2020) indicating that, both with and without prior context, pronounced accentual rises (L+H*) involve a particularly high level of perceptual prominence.
In addition, for both accent types we found that mismatching conditions yield more pronounced negative deflections between 300–400 ms. Since auditory stimuli commonly show earlier onset latencies we consider this an instance of an N400 prediction error response. Hence, with regard to neurophysiological responses, these results are in line with Hypothesis 2a and confirm that not only lexical and referential, but also prosodic parameters elicit an N400 prediction error response: Contextually inappropriate accents or an unexpected level of prosodic prominence engender costs during predictive processing (see also Schumacher & Baumann, Citation2010 for prosodic mismatches involving referential accessibility).
In line with appropriateness ratings of the same stimuli (Röhr et al., Citation2020), the present data also provide further evidence for the assumption that a high level of prosodic prominence (e.g. L+H* accent) is less expected in a neutral context, while a low level of prosodic prominence (e.g. H+L* accent) is less expected in an exciting context. However, in the latter case a low level of prosodic prominence is nonetheless acceptable, since it has a more neutral meaning, as discussed above.
Furthermore, the exciting contexts engendered a Late Positivity (700–900 ms) in both prosodic realisations, suggesting that this particular context has an extra highlighting function. Hence, this effect as well as the Positivity for L+H* accents may be tied to a mechanism of attention orienting and cannot be accounted for on the basis of a repair mechanism.
Interestingly – despite the fact that the audio files are identical across Experiment 1 and Experiment 2 – the Early Positivity effect triggered by L+H* accents is more pronounced in Experiment 2 with the pre-context. This corroborates the earlier claim that the signal-driven cues are not processed in isolation but interact with information built up by the experimental context. Note however that in Experiment 2 there is no prosody-by-context interaction in the Early Positivity time windows. This suggests that the interplay with context is not a matter of the information built up by context at this point but rather that there is a default prosodic realisation for isolated (all new, broad focus) utterances and paragraph finality (H+L*) against which the signal-driven information is received (see Baumann & Grice, Citation2006, p. 1648; Mücke & Grice, Citation2014, p. 53).
The differences found between the two experiments, such as distinctions in the Early Positivity amplitudes and in onset latencies, might also be related to the selection of test stimuli used in both experiments: In Experiment 2 we only tested two of the four prosodic conditions that were tested in Experiment 1. The reduction of alternative prosodic conditions to a binary distinction probably enhances the perception of a contrast between the two types of stimuli (see e.g. Kakouros et al., Citation2018). For instance, the clear difference in prosodic prominence between rising (L+H*) and falling (H+L*) accents might induce greater deviations in the early positive amplitude in Experiment 2.
4. General discussion
In the present paper we conducted two EEG experiments in order to test for signal- and expectation-driven effects of different German accent types. In Experiment 1, we were concerned with the neurocognitive processing of four different degrees of prosodic prominence (in the absence of context), while in Experiment 2 we employed a mismatch paradigm and contrasted the processing of appropriate and inappropriate prosodic realisations as a function of context. Results showed that a regression-based analysis of ERPs is a useful approach in order to account for continuous linguistic variables such as pitch. Through this approach we were able to significantly reduce “noise” with respect to low-level variance in pitch, but were still able to test for categorical effects of the different accent types.
In general we found attention orienting to be reflected in Early and Late Positivities. Experiment 1 and 2 revealed that a rising pitch on a stressed syllable is a decisive tonal cue to prominence and consumes attentional resources, i.e. prosodically more prominent items (L+H* accents) elicit attentional effects at an early processing stage (P300 effect) (see below for the influence of context). Interestingly, Experiment 1 also showed that inappropriate accent patterns (such as deaccentuation of the target and the nuclear accent in a marked position) trigger a similar mechanism of attention orienting (P300 effect). This indicates that the positivities arise in response to signal-driven prosodic cues. Furthermore, in Experiment 2 we also found attention orienting to be reflected in Late Positivities for prominent accents (L+H*) (600 ms) and exciting contexts (700–900 ms), suggesting that prominent information within a discourse in general (i.e. on the prosodic and discourse-pragmatic level) has a particular highlighting effect that elicits costs at a later updating stage.
Furthermore, in Experiments 1 and 2 inappropriate prosodic realisations (either with respect to the accent type or the presence or absence of an accent) engendered costs associated with prediction errors (N400 effects). The results confirm that the appropriateness of a prosodic realisation is generally interpreted in relation to context, either an explicit context as in Experiment 2 or an out of the blue context (which is implicit) as in Experiment 1.
In both experiments we observed signal-driven mechanisms triggered by different degrees of prosodic prominence. The data indicate that strong prosodic prominences result in a pronounced Early Positivity, which we attribute to signal-driven attention allocation (P300 effect). Yet, in contrast to earlier perception studies that focused on perceived prominence, results revealed that during the real-time processing of isolated and contextualised sentences, the falling (H+L*) accent appeared to be the most appropriate and least conspicuous prosodic realisation. The amount of attention allocated to the stimuli is thus determined by signal-inherent properties coupled with contextual cues. In contrast to research that has investigated attentional allocation and positivities in the ERPs under specific task demands in linguistic (e.g. Coulson et al., Citation1998; Haupt et al., Citation2008; Sassenhagen et al., Citation2014) and non-linguistic research (e.g. Donchin, Citation1981), the current positivity is associated with more subtle, involuntary attentional processes that result in a reorienting response (Kahneman, Citation1973).
In addition to the prosody-induced signal-driven processing, we also observed a late positive deflection (700–900 ms) in Experiment 2 for the exciting context (irrespective of its prosodic realisation). We take this to be a context/content-induced indication of attentional allocation: The context sentence (“Guess what happened to us today!”) triggers an anticipation of noteworthy and important information which in itself yields a positivity during the process of matching the incoming information with this context relative to the neutral context that does not license attentional allocation for notable information. This suggests that the positivity is a general reflex of attention orienting, which is observed here for (i) signal-driven (i.e. prosodic) cues and (ii) content-driven cues provided by the context. Previous ERP research has identified referential form as an attentional cue (see Schumacher et al., Citation2015 on demonstrative pronouns) as well as morphological discourse markers (Hirotani & Schumacher, Citation2011 on topic marking).
As far as expectation-driven processes are concerned, Experiment 2 provided evidence for context-induced predictions for particular prosodic realisations. Prediction errors, i.e. mismatches between context and prosody resulted in an N400. To a certain extent, this was also observable in Experiment 1 for the severe mismatch of encountering a steep rising (L+H*) accent or a missing accent in an out of the blue context. This corroborates earlier findings on mismatches between prosody and information structure (e.g. Baumann & Schumacher, Citation2012; Heim & Alter, Citation2006; Schumacher & Baumann, Citation2010; Toepel et al., Citation2007).
5. Summary and conclusion
In two EEG experiments we tested different German accent types (L+H*, H*, H+L*, Ø) in isolation as well as prominent rising (L+H*) and less prominent falling (H+L*) accents in relation to an exciting and neutral context. The experiments aimed to investigate signal- and expectation-driven effects of prosodic prominence. While previous electrophysiological research tested mismatches between prosody and information structure, the present study assessed different prosodic realisations of stimuli without context as well as their appropriateness with respect to expectations as to how exciting the content of a following utterance will be. Regression-based ERPs were calculated for the analysis of the prosodically distinct stimuli.
The experiments reveal that signal-driven and expectation-driven processing of prosodic prominence is dissociable in real-time. Both experiments showed that a high level of prosodic prominence (L+H* accent) in general consumes attentional resources at an early processing stage which is reflected in pronounced Early Positivities. Importantly, in our study it is an f0 rise on the stressed syllable of the critical word (and of the accented participle) that evokes an early positive deflection and not a rise elsewhere. We take this to be evidence that it may be meaningful rises that orient attention, rather than rises per se. In addition, contextually induced highlighting (exciting context) elicits updating costs at a later processing stage reflected in a Late Positivity (700–900 ms). This provides evidence that the positivities are tied to mechanisms of attentional orienting. Moreover, results confirm that prosodic parameters also evoke prediction errors (interpreted in relation to implicit and explicit context): We found acoustically unexpected accents (i.e. prominent accents in Experiment 1), as well as contextually inappropriate prosodic realisations (in Experiment 1, which includes missing accents, and Experiment 2) to be associated with N400 prediction errors.
In sum, the present results suggest that overall prominence-related information influences two core processes during real-time comprehension. (1) Prior context builds up expectations for upcoming input: Fed by prosodic and contextual cues in our studies, prediction errors, like deviations in appropriate prosodic prominence, result in a negative deflection. (2) Attentional cues – both signal-driven, such as a high level of prosodic prominence and content-driven, such as the expression of excitement – engender positivities of varying latency. Assuming that the goal of language comprehension is the construction of a mental representation, these two processes reflect discrete stages in the build-up of the mental model: Predictive processing mirrors an early matching of feed-forward predictions with the incoming input. Thus, attentional cues trigger re-orientation, which requires updating of the mental model.
Supplemental online material
An overview of the test material (in German) plus audio stimuli for Experiment 1 (critical sentences) and Experiment 2 (contexts plus critical sentences) as well as the results of the statistical analysis (plus scripts) for both Experiments are available via https://osf.io/2hfgm/.
Acknowledgements
We would like to thank Claudia Kilter and Brita Rietdorf for support in data acquisition and Matthias Gauser for assistance in data analysis.
Disclosure statement
No potential conflict of interest was reported by the authors.
Additional information
Funding
Notes
1 Deaccentuation indicates the absence of a pitch accent on a word that is expected to be accented in an analogous unmarked “all-new” utterance (cf. Ladd, Citation1980).
2 A nuclear pitch accent is defined as the last pitch accent in an intonation unit. It constitutes the only obligatory element in the phrase and is considered to be the structurally (phonologically) most important element determining the interpretation of the phrase’s information structure (cf. Halliday, Citation1967; O’Connor & Arnold, Citation1973).
References
- Baayen, R. H., Davidson, D. J., & Bates, D. M. (2008). Mixed-effects modeling with crossed random effects for subjects and items. Journal of Memory and Language, 59(4), 390–412. https://doi.org/10.1016/j.jml.2007.12.005
- Bates, D., Kliegl, R., Vasishth, S., & Baayen, R. H. (2015). Parsimonious Mixed Models. arXiv:1506.04967 (stat.ME).
- Bates, D., Mächler, M., Bolker, B., & Walker, S. (2015). Fitting linear mixed-effects models using lme4. Journal of Statistical Software, 67(1), 1–48. https://doi.org/10.18637/jss.v067.i01
- Baumann, S. (2006). The intonation of givenness – Evidence from German. Niemeyer.
- Baumann, S., Becker, J., Grice, M., & Mücke, D. (2007, August 6–10). Tonal and articulatory marking of focus in German. Proceedings of the 16th International Congress of Phonetic Sciences (ICPhS), Saarbrücken, Germany (pp. 1029–1032).
- Baumann, S., & Grice, M. (2006). The intonation of accessibility. Journal of Pragmatics, 38(10), 1636–1657. https://doi.org/10.1016/j.pragma.2005.03.017
- Baumann, S., & Röhr, C. T. (2015, August). The perceptual prominence of pitch accent types in German. Proceedings of the 18th International Congress of Phonetic Sciences (ICPhS), The University of Glasgow, Glasgow, UK (Vol. 298, pp. 1–5).
- Baumann, S., & Schumacher, P. B. (2012). (De-)Accentuation and the processing of information status: Evidence from event-related brain potentials. Language and Speech, 55(3), 361–381. https://doi.org/10.1177/0023830911422184
- Baumann, S., & Winter, B. (2018). What makes a word prominent? Predicting untrained German listeners’ perceptual judgments. Journal of Phonetics, 70, 20–38. https://doi.org/10.1016/j.wocn.2018.05.004
- Beckman, M. E., & Venditti, J. J. (2010a). Intonation. In J. Goldsmith, J. Riggle, & A. C. L. Yu (Eds.), The handbook of phonological theory (pp. 485–532). Blackwell.
- Beckman, M. E., & Venditti, J. J. (2010b). Tone and intonation. In W. J. Hardcastle & J. Laver (Eds.), The handbook of phonetic sciences (pp. 603–652). Blackwell.
- Birch, S., & Clifton, C. (1995). Focus, accent, and argument structure: Effects on language comprehension. Language and Speech, 38(4), 365–391. https://doi.org/10.1177/002383099503800403
- Bishop, J. (2012). Information structural expectations in the perception of prosodic prominence. In G. Elordieta & P. Prieto (Eds.), Prosody and meaning (pp. 239–270). Mouton De Gruyter.
- Blakemore, S.-J., Wolpert, D. M., & Frith, C. D. (1998). Central cancellation of self-produced tickle sensation. Nature Neuroscience, 1(7), 635–640. https://doi.org/10.1038/2870
- Bock, J. K., & Mazzella, J. R. (1983). Intonational marking of given and new information: Some consequences for comprehension. Memory & Cognition, 11(1), 64–76. https://doi.org/10.3758/BF03197663
- Boersma, P., & Weenink, D. (2013). Praat: Doing Phonetics by Computer (Version 5.3.80) [Computer Program]. http://www.praat.org/
- Bornkessel-Schlesewsky, I., & Schlesewsky, M. (2019). Toward a neurobiologically plausible model of language-related, negative event-related potentials. Frontiers in Psychology, 10(298), 1–17. https://doi.org/10.3389/fpsyg.2019.00298.
- Bornkessel-Schlesewsky, I., & Schumacher, P. B. (2016). Towards a neurobiology of information structure. In C. Féry & S. Ishihara (Eds.), The Oxford handbook of information structure (pp. 581–598). Oxford University Press.
- Brazil, D. (1975). Discourse intonation (Vol. 1). Birmingham University.
- Breen, M., Fedorenko, E., Wagner, M., & Gibson, E. (2010). Acoustic correlates of information structure. Language and Cognitive Processes, 25(7-9), 1044–1098. https://doi.org/10.1080/01690965.2010.504378
- Brouwer, H., & Hoeks, J. C. J. (2013). A time and place for language comprehension: Mapping the N400 and the P600 to a minimal cortical network. Frontiers in Human Neuroscience, 7(758), 1–12. https://doi.org/10.3389/fnhum.2013.00758
- Burkhardt, P. (2006). Inferential bridging relations reveal distinct neural mechanisms: Evidence from event-related brain potentials. Brain and Language, 98(2), 159–168. https://doi.org/10.1016/j.bandl.2006.04.005
- Chen, A., Den Os, E., & De Ruiter, J. P. (2007). Pitch accent type matters for online processing of information status: Evidence from natural and synthetic speech. The Linguistic Review, 24(2–3), 317–344. https://doi.org/10.1515/TLR.2007.012
- Cole, J., Mo, Y., & Hasegawa-Johnson, M. (2010). Signal-Based and expectation-based factors in the perception of prosodic prominence. Laboratory Phonology, 1(2), 425–452. https://doi.org/10.1515/labphon.2010.022
- Corbetta, M., & Shulman, G. L. (2002). Control of goal-directed and stimulus-driven attention in the brain. Nature Review Neuroscience, 3(3), 201–215. https://doi.org/10.1038/nrn755
- Coulson, S., King, J. W., & Kutas, M. (1998). Expect the unexpected: Event-related brain response to morphosyntactic violations. Language and Cognitive Processes, 13(1), 21–58. https://doi.org/10.1080/016909698386582
- Dimitrova, D., Stowe, L. A., Redeker, G., & Hoeks, J. C. J. (2012). Less is not more: Neural responses to missing and superfluous accents in context. Journal of Cognitive Neuroscience, 24(12), 2400–2418. https://doi.org/10.1162/jocn_a_00302
- Donchin, E. (1981). Surprise! … Surprise? Psychophysiology, 18(5), 493–513. https://doi.org/10.1111/j.1469-8986.1981.tb01815.x
- Féry, C. (1993). German intonational patterns. Niemeyer.
- Fox, J., & Weisberg, S. (2018). Visualizing fit and lack of fit in complex regression models with predictor effect plots and partial residuals. Journal of Statistical Software, 87(9), 1–27. https://doi.org/10.18637/jss.v087.i09
- Friederici, A. D., Hahne, A., & Mecklinger, A. (1996). Temporal structure of syntactic parsing: Early and late event-related brain potential effects. Journal of Experimental Psychology: Learning, Memory, and Cognition, 22(5), 1219–1248. https://doi.org/10.1037/0278-7393.22.5.1219
- Friederici, A. D., Wang, Y., Herrmann, C. S., Maess, B., & Oertel, U. (2000). Localization of early syntactic processes in frontal and temporal cortical areas: A magnetoencephalographic study. Human Brain Mapping, 11(1), 1–11. https://doi.org/10.1002/1097-0193
- Friston, K. (2010). The free-energy principle: A unified brain theory. Nature Reviews Neuroscience, 11(2), 127–138. https://doi.org/10.1038/nrn2787
- Gramfort, A., Luessi, M., Larson, E., Engemann, D. A., Strohmeier, D., Brodbeck, C., Parkkonen, L., & Hämäläinen, M. (2014). MNE Software for processing MEG and EEG data. NeuroImage, 86, 446–460. https://doi.org/10.1016/j.neuroimage.2013.10.027
- Grice, M., & Baumann, S. (2002). Deutsche Intonation und GToBI. Linguistische Berichte, 191, 267–298.
- Grice, M., & Baumann, S. (2007). An introduction to intonation - functions and models. In J. Trouvain & U. Gut (Eds.), Non-native prosody. Phonetic description and teaching practice (pp. 25–51). De Gruyter.
- Grice, M., & Baumann, S. (2016). Intonation in der Lautsprache: Tonale Analyse. In U. Domahs & B. Primus (Eds.), Handbuch Laut, Gebärde, Buchstabe (pp. 84–105). De Gruyter.
- Grice, M., Baumann, S., & Benzmüller, R. (2005). German intonation in autosegmental-metrical phonology. In S.-A. Jun (Ed.), Prosodic typology: The phonology of intonation and phrasing (pp. 55–83). Oxford University Press.
- Grice, M., Baumann, S., Ritter, S., & Röhr, C. T. (2019). GToBI. Übungsmaterialien zur deutschen Intonation. www.gtobi.uni-koeln.de
- Grice, M., Ritter, S., Niemann, H., & Roettger, T. B. (2017). Integrating the discreteness and continuity of intonational categories. Journal of Phonetics, 64, 90–107. https://doi.org/10.1016/j.wocn.2017.03.003
- Gussenhoven, C. (1984). On the grammar and semantics of sentence accents. Foris Publications.
- Gussenhoven, C. (2002, April 11–13). Intonation and interpretation: Phonetics and phonology. Proceedings of the 1st international conference on Speech Prosody, Aix-en-Provence, France.
- Gussenhoven, C. (2004). The phonology of tone and intonation. Cambridge University Press.
- Halliday, M. A. K. (1967). Intonation in grammar in British English. Mouton.
- Hanssen, J., Peters, J., & Gussenhoven, C. (2008, May 6–9). Prosodic effects of focus in Dutch declaratives. Proceedings of the 4th international conference on Speech Prosody, Campinas, Brazil (pp. 609–612).
- Hauk, O., Davis, M. H., Ford, M., Pulvermüller, F., & Marslen-Wilson, W. D. (2006). The time course of visual word recognition as revealed by linear regression analysis of ERP data. NeuroImage, 30(4), 1383–1400. https://doi.org/10.1016/j.neuroimage.2005.11.048
- Haupt, F. S., Schlesewsky, M., Roehm, D., Friederici, A. D., & Bornkessel-Schlesewsky, I. (2008). The status of subject–object reanalyses in the language comprehension architecture. Journal of Memory and Language, 59(1), 54–96. https://doi.org/10.1016/j.jml.2008.02.003
- Heim, S., & Alter, K. (2006). Prosodic pitch accents in language comprehension and production: ERP data and acoustic analyses. Acta Neurobiologiae Experimentalis, 66(1), 55–68.
- Hirotani, M., & Schumacher, P. B. (2011). Context and topic marking affect distinct processes during discourse comprehension in Japanese. Journal of Neurolinguistics, 24(3), 276–292. https://doi.org/10.1016/j.jneuroling.2010.09.007
- Hruska, C., & Alter, K. (2004). Prosody in dialogues and single sentences: How prosody can influence speech perception. In A. Steube (Ed.), Information structure: Theoretical and empirical aspects (pp. 221–226). De Gruyter.
- Hsu, C.-H., Evans, J. P., & Lee, C.-Y. (2015). Brain responses to spoken F0 changes: Is H special? Journal of Phonetics, 51, 82–92. https://doi.org/10.1016/j.wocn.2015.02.003
- Ito, K., & Speer, S. (2008). Anticipatory effects of intonation: Eye movements during instructed visual search. Journal of Memory and Language, 58(2), 541–573. https://doi.org/10.1016/j.jml.2007.06.013
- Ito, K., Speer, S., & Beckman, M. (2004, March 23–26). Informational status and pitch accent distribution in spontaneous dialogues in English. Proceedings of the 2nd international conference on Speech Prosody, Nara, Japan (pp. 279–282).
- Jun, S.-A. (2005). Prosodic typology: The phonology of intonation and phrasing. Oxford University Press.
- Jun, S.-A. (2014). Prosodic typology II: The phonology of intonation and phrasing. Oxford University Press.
- Kaan, E., Harris, A., Gibson, E., & Holcomb, P. (2000). The P600 as an index of syntactic Integration difficulty. Language and Cognitive Processes, 15(2), 159–201. https://doi.org/10.1080/016909600386084
- Kahneman, D. (1973). Attention and effort. Prentice-Hall Inc.
- Kakouros, S., Salminen, N., & Räsänen, O. (2018). Making predictable unpredictable with style – Behavioral and electrophysiological evidence for the critical role of prosodic expectations in the perception of prominence in speech. Neuropsychologia, 109, 181–199. https://doi.org/10.1016/j.neuropsychologia.2017.12.011
- Kohler, K. (1991). Terminal intonation patterns in single-accent utterances of German: Phonetics, phonology and semantics. Arbeitsberichte des Instituts für Phonetik und Digitale Sprachverarbeitung der Universität Kiel (AIPUK), 25, 115–185.
- Kok, A. (2001). On the utility of P3 amplitude as a measure of processing capacity. Psychophysiology, 38(3), 557–577. https://doi.org/10.1017/S0048577201990559
- Kolk, H. H. J., Chwilla, D. J., van Herten, M., & Oor, P. J. W. (2003). Structure and limited capacity in verbal working memory: A study with event-related potentials. Brain and Language, 85(1), 1–36. https://doi.org/10.1016/S0093-934X
- Kutas, M., & Federmeier, K. D. (2011). Thirty years and counting: Finding meaning in the N400 component of the event-related brain potential (ERP). Annual Review of Psychology, 62(1), 621–647. https://doi.org/10.1146/annurev.psych.093008.131123
- Ladd, D. R. (1980). The structure of intonational meaning: Evidence from English. Indiana University Press.
- Ladd, D. R. (2008). Intonational phonology (2nd ed.). Cambridge University Press.
- Li, W., Deng, N., Yang, Y., & Wang, L. (2018). Process focus and accentuation at different positions in dialogues: An ERP study. Language, Cognition and Neuroscience, 33(2), 255–274. https://doi.org/10.1080/23273798.2017.1387278
- Li, X., & Ren, G. (2012). How and when accentuation influences temporally selective attention and subsequent semantic processing during on-line spoken language comprehension: An ERP study. Neuropsychologia, 50(8), 1882–1894. https://doi.org/10.1016/j.neuropsychologia.2012.04.013
- Maess, B., Schröger, E., & Widmann, A. (2016a). High-Pass filters and baseline correction in M/EEG analysis. Commentary on: “How inappropriate high-pass filters can produce artefacts and incorrect conclusions in ERP studies of language and cognition”. Journal of Neuroscience Methods, 266, 164–165. https://doi.org/10.1016/j.jneumeth.2015.12.003
- Maess, B., Schröger, E., & Widmann, A. (2016b). High-Pass filters and baseline correction in M/EEG analysis-continued discussion. Journal of Neuroscience Methods, 266, 171–172. https://doi.org/10.1016/j.jneumeth.2016.01.016
- Magne, C., Astesano, C., Lacheret-Dujour, A., Morel, M., Alter, K., & Besson, M. (2005). On-line processing of “pop-out’’ words in spoken French dialogues. Journal of Cognitive Neuroscience, 17(5), 740–756. https://doi.org/10.1162/0898929053747667
- Mücke, D., & Grice, M. (2014). The effect of focus marking on supralaryngeal articulation – Is it mediated by accentuation? Journal of Phonetics, 44, 47–61. https://doi.org/10.1016/j.wocn.2014.02.003
- Nieuwenhuis, S., Aston-Jones, G., & Cohen, J. D. (2005). Decision making, the P3, and the locus coeruleus-norepinephrine system. Psychological Bulletin, 131(4), 510–532. https://doi.org/10.1037/0033-2909.131.4.510
- O’Connor, J. D., & Arnold, G. F. (1973). Intonation of colloquial English. Longman.
- Picton, T. W. (1993). The P300 wave of the human event-related brain potential. Journal of Clinical Neurophysiology, 9(4), 456–479. https://doi.org/10.1097/00004691-199210000-00002
- Pierrehumbert, J. B. (1980). The phonetics and phonology of English intonation. Indiana University Linguistics Club.
- Pierrehumbert, J. B., & Hirschberg, J. (1990). The meaning of Intonational contours in the interpretation of discourse. In P. R. Cohen, J. Morgan, & M. E. Pollak (Eds.), Intentions in communication (pp. 271–311). MIT Press.
- Polich, J. (2003). Overview of P3a and P3b. In J. Polich (Ed.), Detection of change: Event-related potential and fMRI findings (pp. 83–98). Kluwer Academic Press.
- Polich, J. (2007). Updating P300: An integrative theory of P3a and P3b. Clinical Neurophysiology, 118(10), 2128–2148. https://doi.org/10.1016/j.clinph.2007.04.019
- R Core Team. (2018). R: A language and environment for statistical computing. R foundation for statistical computing. R Foundation for Statistical Computing. https://www.R-project.org
- Ritter, S., & Grice, M. (2015). The role of tonal onglides in German nuclear pitch accents. Language and Speech, 58(1), 114–128. https://doi.org/10.1177/0023830914565688
- Röhr, C. T., & Baumann, S. (2010, May 10–14). Prosodic marking of information status in German. Proceedings of the 5th international conference on Speech Prosody, Chicago, IL (Vol. 100019, pp. 1–4).
- Röhr, C. T., & Baumann, S. (2011, August 17–21). Decoding information status by type and position of accent in German. Proceedings of the 17th International Congress of Phonetic Sciences (ICPhS), Hong Kong, China (pp. 1706–1709).
- Röhr, C. T., Baumann, S., Schumacher, P. B., & Grice, M. (2020, May 25–August 31). Perceptual prominence of accent types and the role of expectations. Proceedings of the 10th international conference on Speech Prosody, Tokyo, Japan (pp. 366–370).
- Ruchkin, D. S., Johnson, R., Canoune, H. L., Ritter, W., & Hammer, M. (1990). Multiple sources of P3b associated with different types of information. Psychophysiology, 27(2), 157–176. https://doi.org/10.1111/j.1469-8986.1990.tb00367.x
- Sassenhagen, J., Schlesewsky, M., & Bornkessel-Schlesewsky, I. (2014). The P600-as-P3 hypothesis revisited: Single-trial analyses reveal that the late EEG positivity following linguistically deviant material is reaction time aligned. Brain and Language, 137, 29–39. https://doi.org/10.1016/j.bandl.2014.07.010
- Sassenhagen, S. (2019). How to analyse electrophysiological responses to naturalistic language with time-resolved multiple regression. Language, Cognition and Neuroscience, 34(4), 474–490. https://doi.org/10.1080/23273798.2018.1502458
- Schumacher, P. B., Backhaus, J., & Dangl, M. (2015). Backward- and forward-looking potential of anaphors. Frontiers in Psychology, 6(1746), 1–14. https://doi.org/10.3389/fpsyg.2015.01746.
- Schumacher, P. B., & Baumann, S. (2010). Pitch accent type affects the N400 during referential processing. NeuroReport, 21(9), 618–622. https://doi.org/10.1097/WNR.0b013e328339874a
- Schumacher, P. B., & Hung, Y.-C. (2012). Positional influences on information packaging: Insights from topological fields in German. Journal of Memory and Language, 67(2), 295–310. https://doi.org/10.1016/j.jml.2012.05.006
- Smith, N. J., & Kutas, M. (2015a). Regression-based estimation of ERP waveforms: I. The rERP framework. Psychophysiology, 52(2), 157–168. https://doi.org/10.1111/psyp.12317
- Smith, N. J., & Kutas, M. (2015b). Regression-based estimation of ERP waveforms: II. Nonlinear effects, overlap correction, and practical considerations. Psychophysiology, 52(2), 169–181. https://doi.org/10.1111/psyp.12320
- Squires, N. K., Squires, K. C., & Hillyard, S. A. (1975). Two varieties of long-latency positive waves evoked by unpredictable auditory stimuli in man. Electroencephalography and Clinical Neurophysiology, 38(4), 387–401. https://doi.org/10.1016/0013-4694
- Terken, J. M. B., & Nooteboom, S. (1987). Opposite effects of accentuation and deaccentuation on verification latencies for given and new information. Language and Cognitive Processes, 2(3–4), 145–163. https://doi.org/10.1080/01690968708406928
- Toepel, U., Pannekamp, A., & Alter, K. (2007). Catching the news: Processing strategies in listening to dialogs as measured by ERPs. Behavioral and Brain Functions, 3(53). https://doi.org/10.1186/1744-9081-3-53.
- Uhmann, S. (1991). Fokusphonologie. Eine Analyse deutscher Intonationskonturen im Rahmen der nicht-linearen Phonologie. Niemeyer.
- Ventura, C., Grice, M., Savino, M., Kolev, D., Brilmayer, I., & Schumacher, P. B. (2020). Attention allocation in a language with post-focal prominences. NeuroReport, 31(8), 624–628. https://doi.org/10.1097/WNR.0000000000001453
- Wang, L., Bastiaansen, M., Yang, Y., & Hagoort, P. (2011). The influence of information structure on the depth of semantic processing: How focus and pitch accent determine the size of the N400 effect. Neuropsychologia, 49(5), 813–820. https://doi.org/10.1016/j.neuropsychologia.2010.12.035
- Wang, L., & Schumacher, P. B. (2013). New is not always costly: Evidence from online processing of topic and contrast in Japanese. Frontiers in Psychology, 4(363), 1–20. https://doi.org/10.3389/fpsyg.2013.00363
- Welby, P. (2003). Effects of pitch accent position, type, and status on focus projection. Language and Speech, 46(1), 53–81. https://doi.org/10.1177/00238309030460010401
- Widmann, A., Schröger, E., & Maess, B. (2015). Digital filter design for electrophysiological data – A practical approach. Journal of Neuroscience Methods, 250, 34–46. https://doi.org/10.1016/j.jneumeth.2014.08.002
- Wolff, S., Schlesewsky, M., Hirotani, M., & Bornkessel-Schlesewsky, I. (2008). The neural mechanisms of word order processing revisited: Electrophysiological evidence from Japanese. Brain and Language, 107(2), 133–157. https://doi.org/10.1016/j.bandl.2008.06.003